
Abstract
The Hyper Duplex Stainless Steel HDSS enhanced corrosion resistance and toughness relies upon high alloying to obtain a balanced ferrite and austenite volume and pitting resistance equivalent number PREn. However, during welding, sigma phase precipitates might form, hindering corrosion and mechanical performance. Therefore, a kinetics model is developed to avoid the sigma phase's formation during welding and validated using physical simulation, finite element analysis (FEA), welding, and SEM characterisation. The sigma phase kinetics model produced calculated and validated temperature-time-transformation (TTT) and continuous-cooling-transformation (CCT) curves from which a 4°C/s cooling rate was found as a cooling rate threshold for sigma phase formation in this new material. Three-layered gas tungsten arc welding GTAW cladded mockup with 53 beads produced 24°C/s minimum cooling rate. Moreover, microscopy, mechanical, and corrosion testing attested it as a sigma-free weld.
Introduction
The recently developed HDSS is tailored for use in oil and chemical industries due to its favourable mechanical properties, including high yield strength and excellent corrosion resistance [1–3]. The alloying elements Cr, Mo, and N result in a PREn value exceeding 48, classifying it as HDSS [4,5].
However, welding manufacturing involves a complex thermal history that modifies the microstructure. During solidification, part of the ferrite (α) transforms into austenite (γ), forming a duplex microstructure. In multipass welding, reheating cycles cause partial ferrite dissolution [6]. Yet, rapid weld cooling rates lead to an unbalanced microstructure due to the slower α→γ transformation during cooling. Fast cooling also significantly affects the local chemical composition due to diffusion limitations. Yang et al. [7] correlated austenite volume with an increase in pitting resistance and demonstrated heat input PREn differences in simulated heat-affected zones (HAZ).
Highly alloyed metastable ferrite is prone to intermetallic formation. Temperatures between 600°C and 1200°C can lead to the precipitation of sigma phase (σ), chi phase (χ), and chromium nitride (Cr2N) [2,8]. Sigma phase, the primary intermetallic in duplex stainless steel (DSS), negatively affects mechanical properties due to its partially ordered structure and reduces corrosion resistance by depleting chromium in its vicinity [2]. Sigma phase forms at α/γ interfaces in DSS and grows into ferrite due to its higher content and faster diffusion of chromium and molybdenum [9]. This diffusion leads to the formation of metastable ferrite, depleted of α stabilisers, promoting the transformation to secondary austenite [10]. The resulting microstructure (α and γ2) is depleted in chromium and molybdenum, increasing susceptibility to corrosion [11]. Fine sigma phase precipitates lead to more pronounced intragranular corrosion, forming a network structure along interfaces [12].
HDSS material was developed for tubing used in severely corrosive environments, such as heat exchangers. Therefore, studies have focused on evaluating the material's performance due to potential sigma phase formation [13–15]. Most research focused on base material artificially aged to induce intermetallic formation. Jeon et al. [13,16,17] studied the influence of chemical composition with additions of Cu, W, and Ce for small ingots, observing a reduction in sigma phase formation and an increase in chi phase precipitation. Zhang et al. [14] investigated sigma phase precipitation behaviour in a small heat rolled to a 4 mm thick plate, observing rapid precipitation at the nose temperature of 950°C and strong eutectoid (σ+γ2) formation over 30 min. Acuna and Ramirez [18] conducted an in-depth kinetics analysis of sigma phase formation in HDSS filler metals, revealing a double-stage sigma phase kinetics mechanism involving eutectoid precipitation and interface-controlled growth, followed by further diffusion-controlled growth.
Limited research focused on welding, primarily considering autogenous welding [19,20]. However, heat exchanger applications require HDSS arc-cladded tubesheets. Thus, this study addresses the sigma phase precipitation kinetics in HDSS filler metal to enable the production of sigma phase-free weld cladded tubesheet. The analysis and results of the gas tungsten arc welding (GTAW) cladded layer's microstructure and kinetics are applicable and reusable for various welding and joining processes.
A Gleeble®-controlled isothermal sigma phase precipitation experiment provided data for the Kampmann-Wagner-Numerical (KWN) model implemented on ThermoCalc® through a non-equilibrium CALPHAD-based calculation [18,21]. The kinetics of continuous-cooling-transformation (CCT) curves were calculated and experimentally validated from the computational time-temperature-transformation (TTT) curves using the additive rule. Employing an implemented finite element analysis (FEA) thermal model, a cooling rate limit for a three-layered multipass weld was determined. Consequently, a sigma-free HDSS welded mockup was developed by avoiding the identified cooling rate threshold.
Materials and methods
The HDSS alloy composition consisted of Fe(bal.)-26.03Cr-6.67Ni-4.93Mo-0.4N-1.3Co-0.94Mn with a 48.5 PREn, verified through optical emission spectroscopy, and nitrogen content verified on a LECO TC600 combustion spectrometer.
Thermodynamic and kinetics calculations
Thermocalc® 2022b software, along with TCFE11 and MOBFE6 databases, was utilised, considering only ferrite, austenite, sigma, chi, and nitrides (Cr2N) as phases and constituents in the kinetics model. Phase diagrams were generated to determine sigma solvus temperature (σs) and ferrite composition at this temperature, providing insights into phase stability based on temperature, Cr, Mo, and N contents.
Non-equilibrium sigma phase kinetics were implemented using the classical nucleation theory through the KWN model in CALPHAD, describing nucleation, growth, and coarsening in the multi-component system [21]. The KWN model, which determines the nucleation rate primarily based on nucleation site distribution and interfacial energy, was fine-tuned according to experimental precipitation data.
Intermetallic precipitation experimental data
The precipitation experiment was conducted on HDSS rods using a Gleeble® 3800 physical simulator, applying controlled isothermal heat treatments over the sigma phase precipitation temperature range in HDSS (600C to 1100C) for varying durations (0s to 600s), with a heating rate of 100°C/s and a cooling rate of 37°C/s [1,2,14,18,22].
Microscopic characterisation
Microscopy specimen preparation involved grinding with 1200 grit sandpaper, followed by two-step polishing, namely 1µm manual polishing and 0.02µm colloidal silica automated polishing for three hours. Electrochemical etching, adapted from Ramirez et al. [6], was carried out using a solution of 40%vol. nitric acid and 60%vol. distilled water, applied in two steps:
20s at 1.3 V to etch grain boundaries and interfaces. 300s at 0.9 V for ferrite etching.
Quantitative microscopy was performed on scanning electron microscope (SEM) images (FEI Apreo) using digital analysis to calculate the volumetric fractions of different phases. The volume fractions were determined based on an average of seven field measurements, with the standard error calculated for a 95% confidence interval.
Kinetics model validation
The HDSS sigma phase kinetics CCT curves were derived from the computational TTT curves using the additive rule [23]. The validation process involved applying controlled cooling rates of 4°C/s, 2.5°C/s, and 1°C/s through the sigma phase precipitation temperature range, using a Gleeble® 3800 with a thermal cycle that included a 100°C/s heating rate up to the solution heat treatment temperature (1200°C) to prevent sigma phase precipitation during heating. This temperature was held for 90s before applying the cooling rates. The quantitative metallography on BSE SEM images compared the calculated sigma phase volume fraction with the developed CCT curve.
GTAW welding parameter.
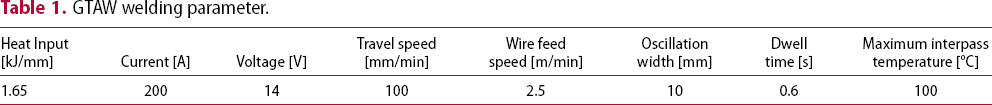
Thermal history was acquired using four type-K thermocouples on the mockup's top and bottom surfaces (Supplementary Figure S1). This data served to validate a developed finite element analysis (FEA) thermal model, enabling the calculation of thermal history and cooling rates at any node. Further details on the FEA simulation can be found in the Supplementary Document (Figures S2 and S3, and Table S1).
Welded mockup specimens were employed for microstructural characterisation, subsize impact toughness measurement (ASTM-E23 [24]), microhardness mapping (Leco AMH45, 200 g for 15s), and assessment of critical pitting temperature (ASTM-G48 [25] method E) to verify the presence of sigma phase and evaluate material performance.
Results and discussion
Equilibrium calculations
There are compositional changes during the HDSS welding. Primarily due to nitrogen variations resulting from diffusion as an interstitial atom, changes in nitrogen solubility during solidification, and the loss of lightweight elements during arc welding. Hence, the recommendation of nitrogen addition in the shielding gas during welding.
On the other hand, sigma phase precipitation causes local depletion of Cr and Mo in the surrounding precipitate. Therefore, phase stability diagrams, depicting the relationship between alloying content and temperature, offer a deeper understanding of phase stabilities. The isopleth diagram and phase equilibrium as a function of temperature reveal the strong nitrogen dependence of HDSS. Above 0.33%wt. N, austenite forms from the liquid phase, limiting ferrite grain size and maximum Cr and Mo content, which hinders sigma phase formation.
In Figure 1(a), the equilibrium phase diagram shows critical features of the alloy, including the sigma solvus temperature (σs) at 1105°C, the ferrite chemical composition at σs (60.3Fe-27.06Cr-5.03Ni-6.23Mo-0.074N) used as the matrix for non-equilibrium simulations, and a maximum of 40%vol. sigma phase at 804°C. Ferrite remains the main solid-phase stable at higher temperatures, but austenite solidification occurs below 1365°C, primarily due to the high nitrogen content. During cooling, the solid-state α→γ transformation increases, reaching 50% at 1165°C.
Calculated equilibrium phases’ volume fraction for the HDSS. (a) at the measured chemical composition. (b) comparison of N content of 0.2%, 0.3%, and 0.4% (in wt-%).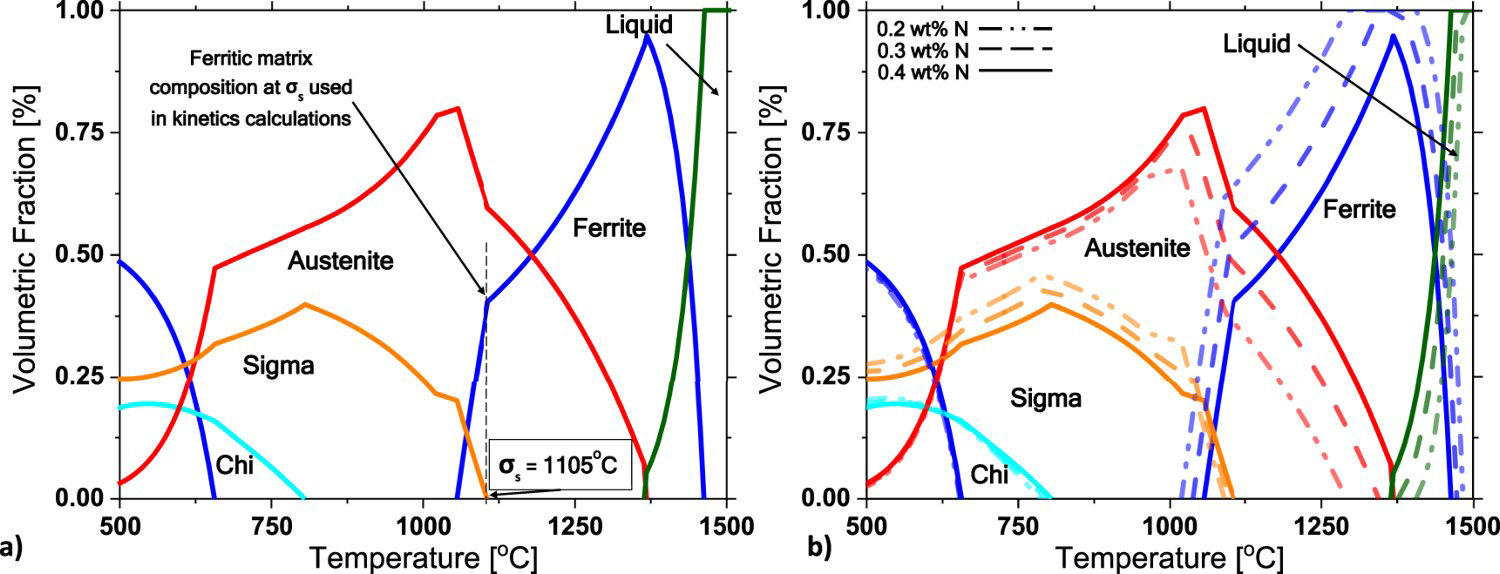
The sigma phase stabilises below 1105°C, defining the sigma phase solvus (σs) temperature. The calculated ferrite composition at this temperature (Fe(bal.)-27Cr-6.23Mo-5Ni-0.073N-1.24Co in wt-%) serves as the matrix composition for precipitation kinetics. As the temperature decreases, the chi phase precipitates, reaching a maximum volume fraction of 19% at 550°C, consuming the sigma phase.
The phase distribution and maximum sigma content align with literature calculations on SDSS and DSS [26,27]. The sigma phase consumes the remaining ferrite due to its higher solubility and diffusivity of Cr and Mo. Therefore, nitrogen, an essential austenite promoter, not only reduces ferrite but also changes the Cr and Mo partition coefficients, leading to a reduction in ferrite Cr content [2,7,15].
During welding, nitrogen loss can occur due to diffusion and the welding arc itself. Therefore, calculations were conducted for the HDSS alloy with different nitrogen amounts: 0.2%, 0.3%, and 0.4% in wt. (Figure 1(b)). Comparing the higher nitrogen content (continuous line) with the lower nitrogen contents (dashed lines), it is evident that higher nitrogen leads to a reduction in the ferritic field, an expansion of the austenitic field, and subsequently, a reduction in the sigma phase field. Hosseini et al. [28] verified that high heat inputs cause greater nitrogen loss, increasing ferrite and sigma phase volumetric fractions. In contrast, low heat inputs yield a lower sigma phase volume fraction due to their higher nitrogen content. The calculations also illustrate the role of nitrogen in the Cr partition, with the calculated ferrite composition at σs temperature presenting 27.61, 27.20, and 26.92 (in wt-%) Cr for alloys with 0.2, 0.3, and 0.4 (in wt-%) N, respectively.
Microstructural analysis
The solution-annealed material exhibited no intermetallics and had a 50% ± 3.33% ferrite volumetric fraction. In Figure 2(a), a sample subjected to isothermal treatment at 842°C for 600 s is shown in a backscattered electron (BSE) image obtained using SEM. The BSE signal's atomic number contrast is used for volumetric phase quantification through image threshold segmentation. In the image, phases rich in high atomic number elements, such as Cr and Mo, appear brighter (blue arrows), while lighter elements phases appear darker (red arrows), as seen in the case of Cr nitrides (Cr2N). The Sigma phase, richer in Cr and Mo, appears as the second brightest phase. The image reveals the significant consumption of previous ferritic grains by the sigma phase and secondary austenite (γ2) from eutectoid decomposition.
Microstructure characterization. (a) specimen heat-treated at 842°C for 600s presenting sigma and chi (blue arrows) phases and chromium nitrides (red arrows). Specimen heat treated at 830°C for 500s with (b) BSE and (c) EBSD phase identification.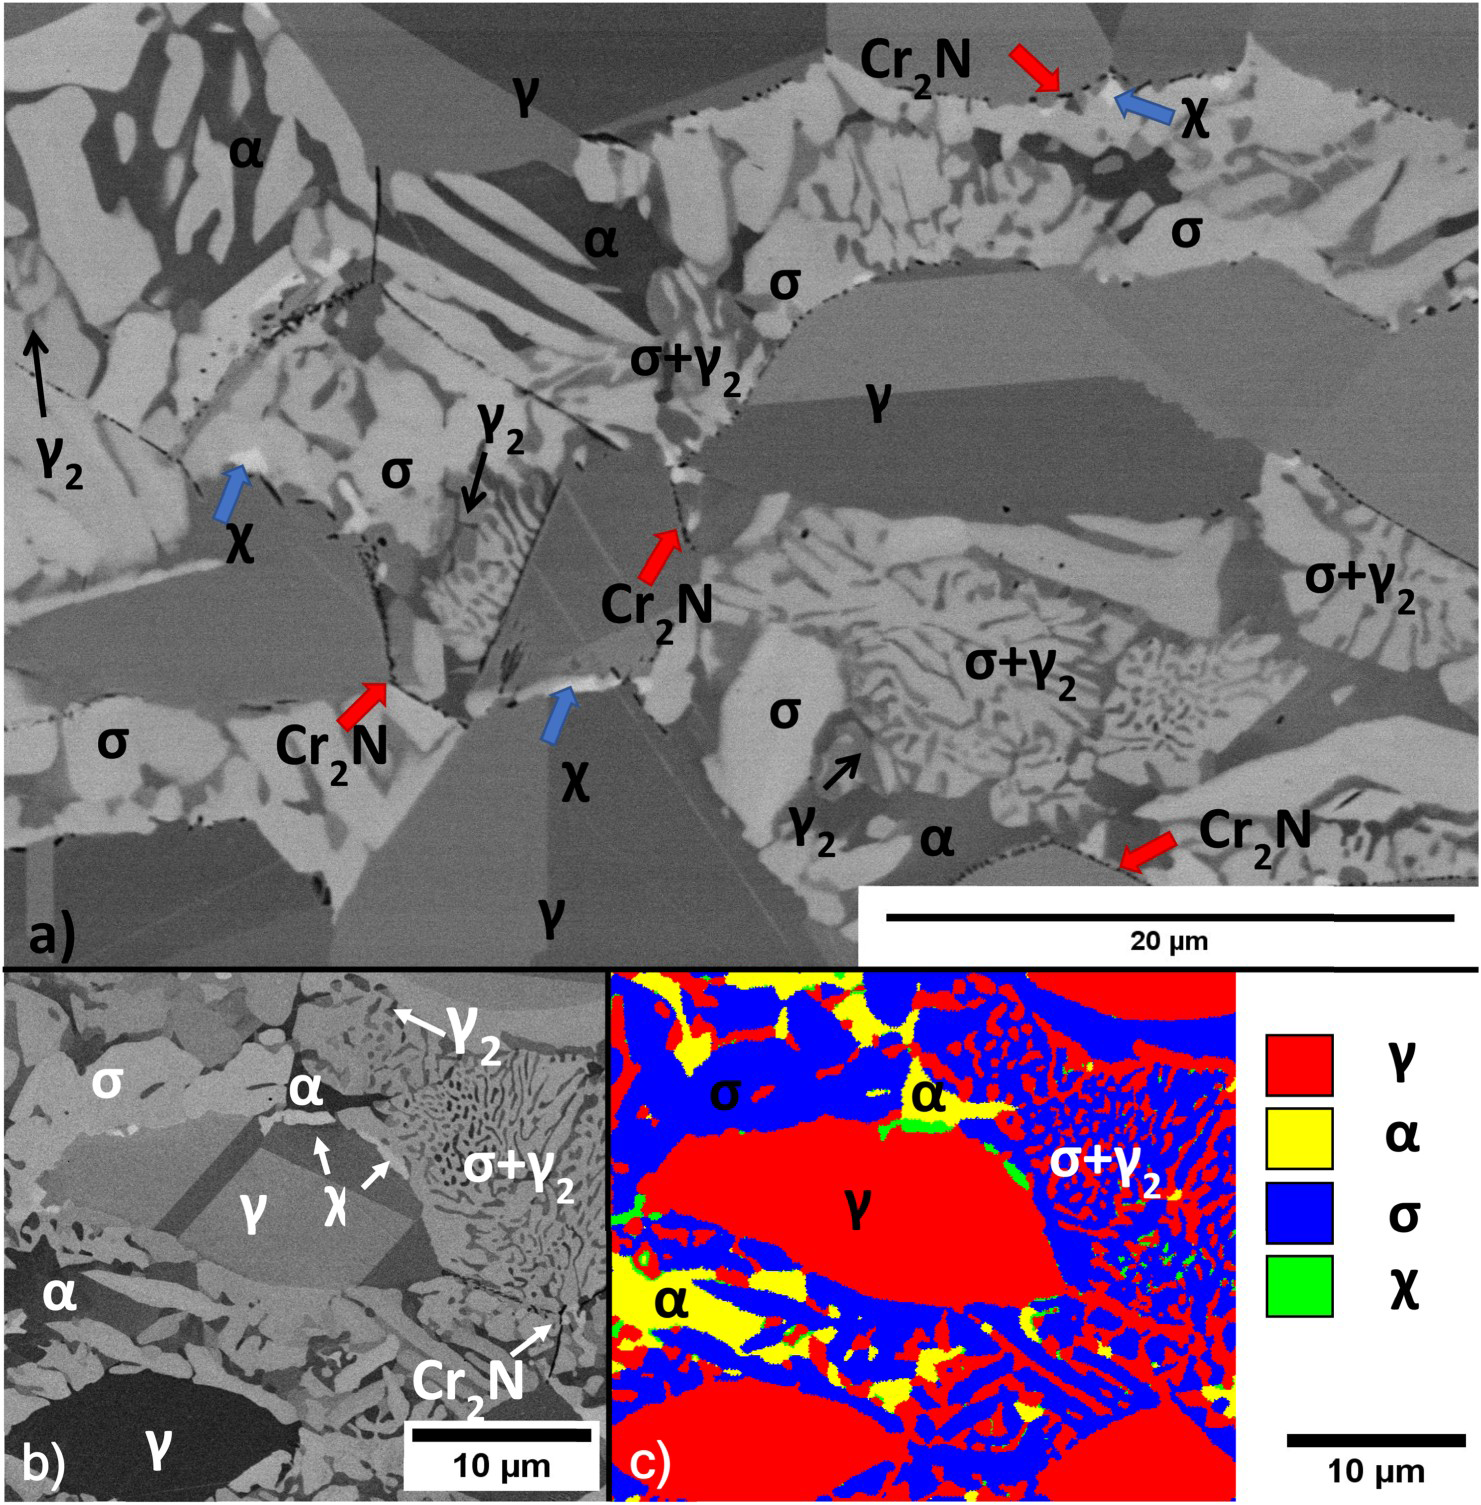
Most of the previous ferritic grains exhibit a lamellar structure resulting from ferrite eutectoid decomposition (α→σ+γ2). This process involves a cooperative diffusion partition reaction where the sigma phase grows, consuming Cr and Mo from the ferrite [21,29]. The resulting metastable ferrite, depleted in Cr and Mo, transforms into secondary austenite, releasing Cr and Mo into the ferrite to precipitate another sigma phase grain.
In addition to the BSE image phase identification, Figure 2(b), Electron Backscatter Diffraction (EBSD) analysis is applied to validate the phase identification and volumetric fraction (Figure 2(c)). A high level of agreement was observed using both techniques for quantification. However, diffraction indexing of the sigma phase is challenging and time-consuming due to its tetragonal structure.
The precipitation data, combining aging time, temperature, and sigma phase volumetric fraction, were used to generate the TTT map in Figure 3. The maximum sigma phase kinetics occurs at 925°C, taking 62.2 s to precipitate 1%. The HDSS alloy's sigma phase precipitation temperature range is between 600°C and 1100°C.
HDSS sigma phase TTT kinetic model. The contour plot represents the experimental TTT map. The dashed lines represent the calculated sigma phase kinetics model at 1%, 5%, and 10% volumetric fractions.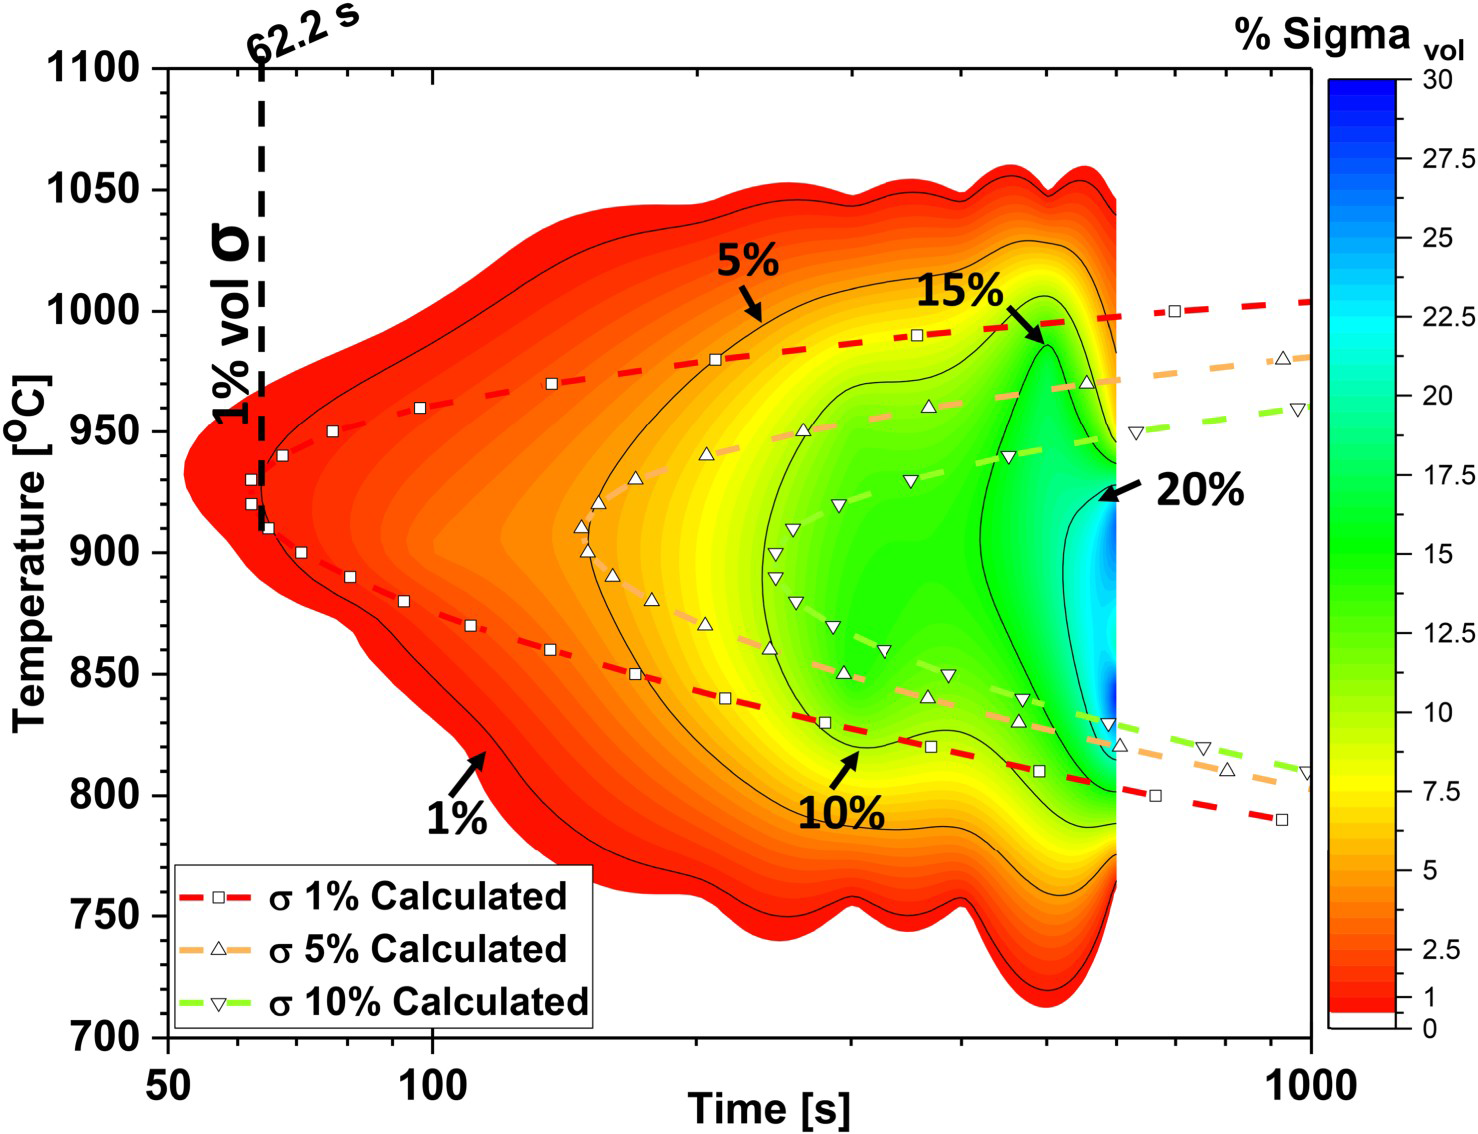
(For Figure 3 and further experimental information on the precipitation contour plot, refer to Supplemental Document Figure S3).
HDSS sigma phase kinetics model
Implementing an HDSS non-equilibrium sigma phase kinetics model is crucial for controlling sigma phase formation during welding. The model is derived from CALPHAD-based calculations and adjusted with reliable experimental data (see supplementary document and Figure S4 for precipitation experiment details). The developed sigma phase kinetics model includes TTT and CCT curves, representing isothermal and continuous cooling conditions, respectively.
The kinetics model's parameters, interfacial energy and nucleation sites, are fine-tuned to match the TTT curves with the experimental data, enabling accurate estimations of precipitation volume, times, and temperatures. The model's theory and adjustment process are detailed in the supplementary document and Figure S5. Although the TTT kinetics model might not fully replicate transformations beyond 1000°C and below 800°C, it shows excellent agreement with experimental results at the curves’ inflection points (indicated by dashed lines in Figure 3) at 1%, 5%, and 10% volumetric fractions.
However, welding involves continuous cooling cycles, not isothermal ones, making the kinetics model more useful in CCT form. To calculate CCT curves, we applied the additivity rule [23,30]. Wilson and Nilsson [23] developed a computational application for calculating the CCT from experimental TTT data through the additive rule. Later studies by Nilsson et al. [31] used the application on SDSS. A similar calculation was applied by Kim et al. [32] and by Ferro et al. [33]. In this research, we followed Wilson and Nilsson's [23] approach to calculate the experimental-based CCT curves. Figure 4 presents the calculated CCTs for sigma phase volumes of 1%, 5%, and 10% (blue, magenta, and scarlet symbol lines, respectively). The figure also illustrates typical cooling rates for arc welding (100°C/s–50°C/s) and a measured GTAW weld cladding cooling rate (20°C/s), all of which do not cause sigma phase formation. The three cooling rates (4°C/s, 2.5°C/s, and 1°C/s) enclose the kinetics model's 1%–5% volume fraction.
HDSS sigma phase CCT kinetics model. Typical arc process cooling in the empty symbol lines for welding, 100°C/s–50°C/s, and GTAW weld cladding, 20°C/s. The kinetics validation cooling rates of 4°C/s, 2.5°C/s, and 1°C/s are presented in green, orange, and red, respectively. The detail table compares the kinetics model calculated and measured sigma phase volume fractions.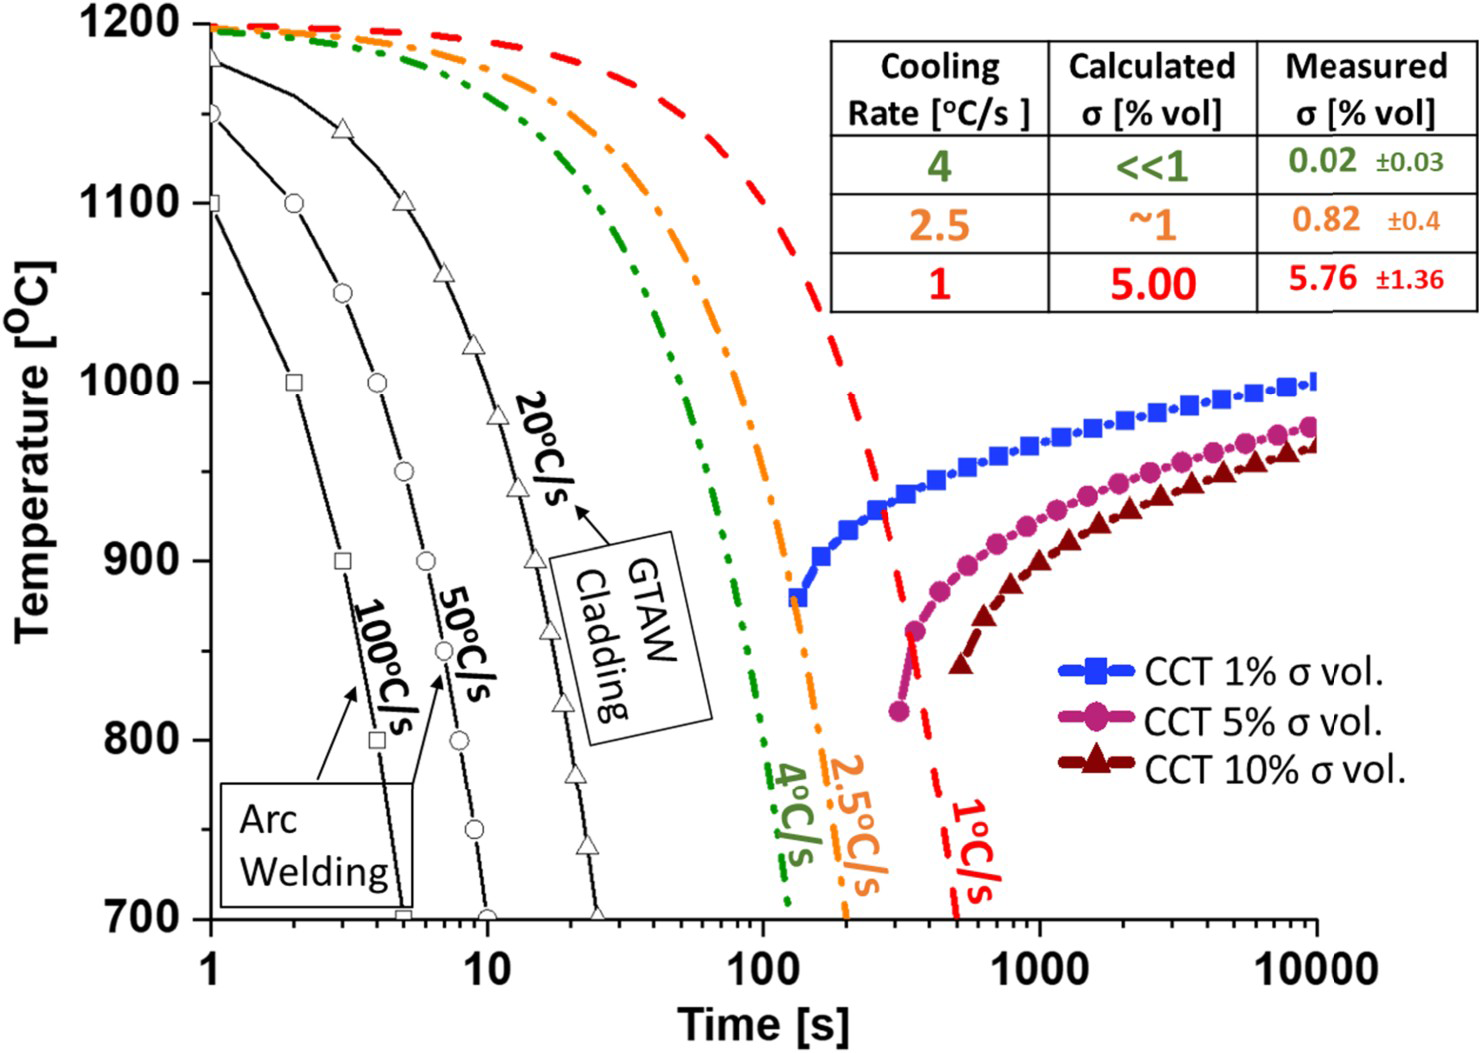
The kinetics model was validated by subjecting HDSS to these cooling rates within the sigma phase measured precipitation temperature range (1100°C–700°C) using a Gleeble® simulator. The measured sigma phase volumetric fractions aligned well with the CCT kinetics model, as shown in Figure 4 table. At cooling rates of 4°C/s, 2.5°C/s, and 1°C/s, the model predicted sigma phase volumetric fractions of 0%, 1%, and 5%, respectively. Experimental results showed fractions of 0.02% ± 0.03%, 0.82% ± 0.40%, and 5.76% ± 1.36%, respectively. This indicates that the sigma phase starts forming at the 4°C/s cooling rate, suggesting it as a sigma phase threshold. These rates are similar to those found by Wilson and Nilsson [23] and Ferro et al. [33] for super duplex stainless steels with lower chromium content.
The results are counterintuitive; a high Cr and Mo alloy does not exhibit higher sigma phase kinetics. Several hypotheses may explain this phenomenon:
The presence of 0.4% N promotes significant austenite formation [3], limiting the amount of ferrite, which is the parent phase of the sigma phase. Nitrogen influences the partitioning of Cr and Mo [2,7,15], resulting in ferrite being less enriched with these elements and reducing their diffusion into the sigma phase. Unlike SDSS [3], HDSS lacks copper and tungsten additions that typically enhance intermetallic formation [16,34].
Figure 5 shows the FEA-calculated thermal history of the welded mockup, specifically for pass number 3. The thermal history data indicate that no bead experienced a cooling rate within 1100°C–600°C lower than 20°C/s. Furthermore, regardless of the thermal history of each layer, the subsequent layer reaches a peak temperature exceeding the sigma solvus (σs) temperature (1105°C). If sigma phase were present, it would rapidly dissolve [35]. Therefore, in this welding configuration, only the cooling rate of the final layer is significant for sigma phase precipitation, and it remained higher than the established threshold at 24°C/s.
FEA calculated thermal history at the pass 3 location during the mockup completion.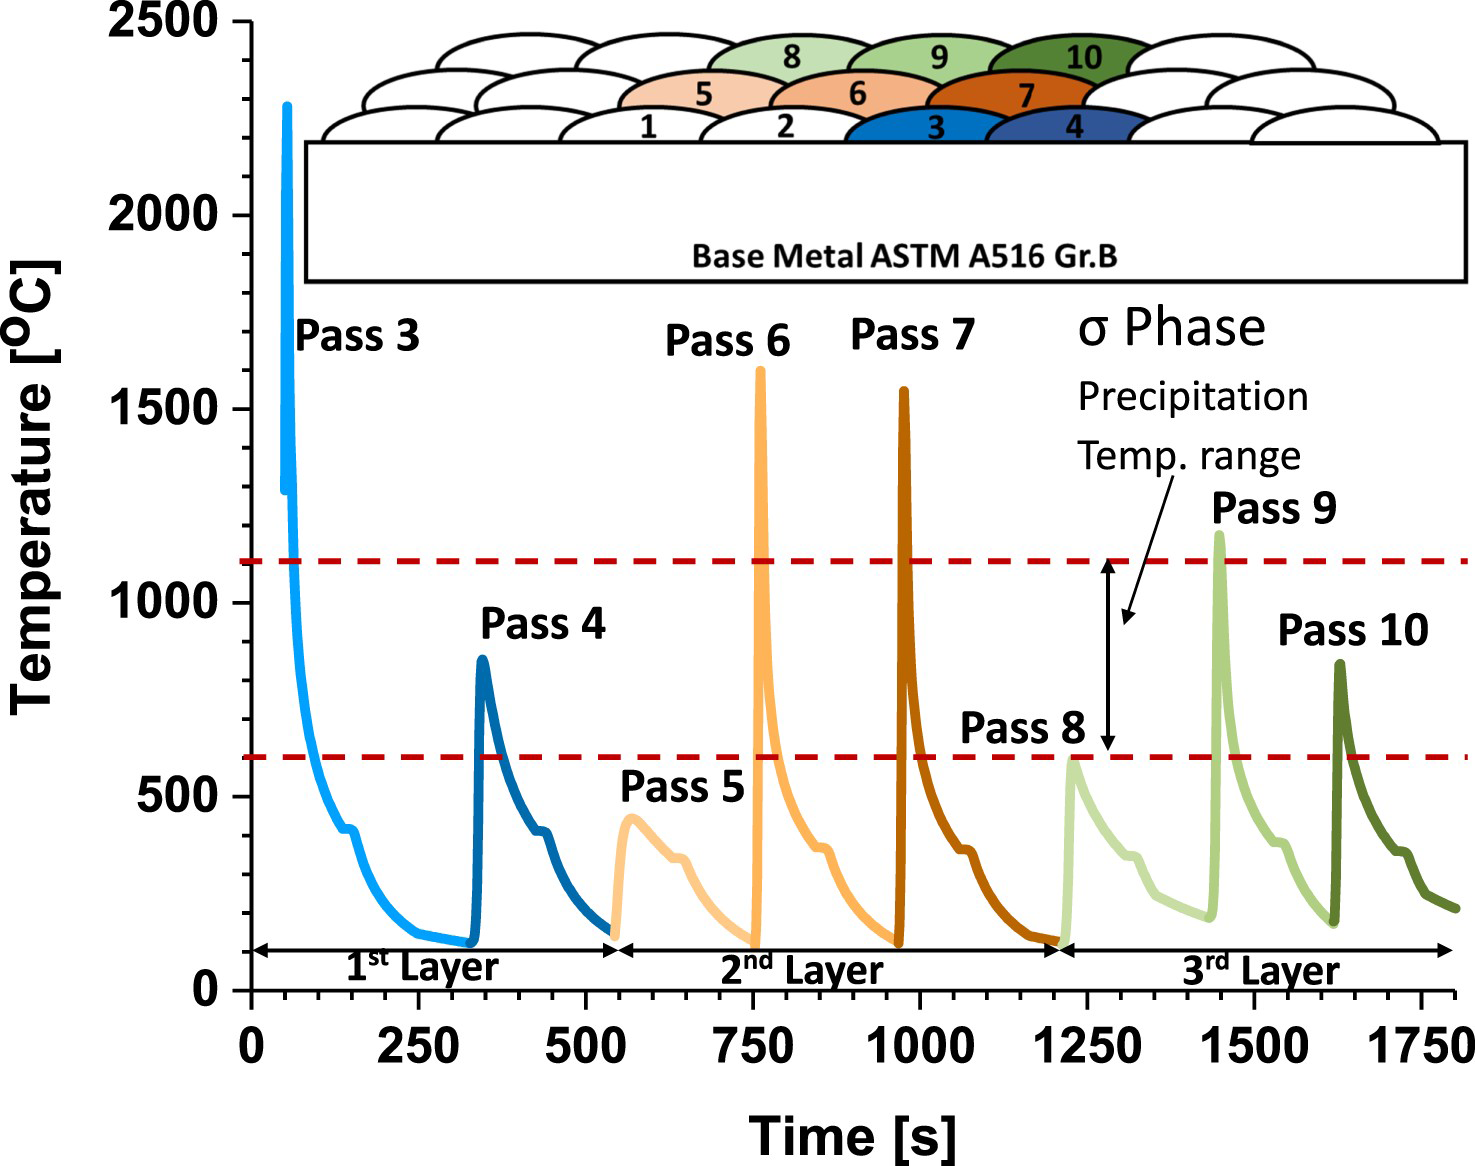
The mockup's microstructural analysis revealed no evidence of sigma phase presence, observed through both optical and electron microscopy. The microstructure, shown in Figure 6(a), displays a three-dimensional representation of the third layer, with ferrite as the tan-colored matrix and nucleated white phase as austenite. Some secondary austenite (red arrow) is present due to reheating from neighbouring overlay bead deposition. The measured ferrite volumetric fraction was 51.11% ± 2.74%, 51.72% ± 1.13%, and 55.74% ± 1.88% for the first, second, and third layers, respectively.
Overlay mockup specimen results. (a) LOM microstructure, presenting ferrite, austenite, secondary austenite (red arrow), and Cr2N colonies (blue arrow). (b) CVN impact toughness DBTT curve. (c) Microhardness map Vickers HV0.2.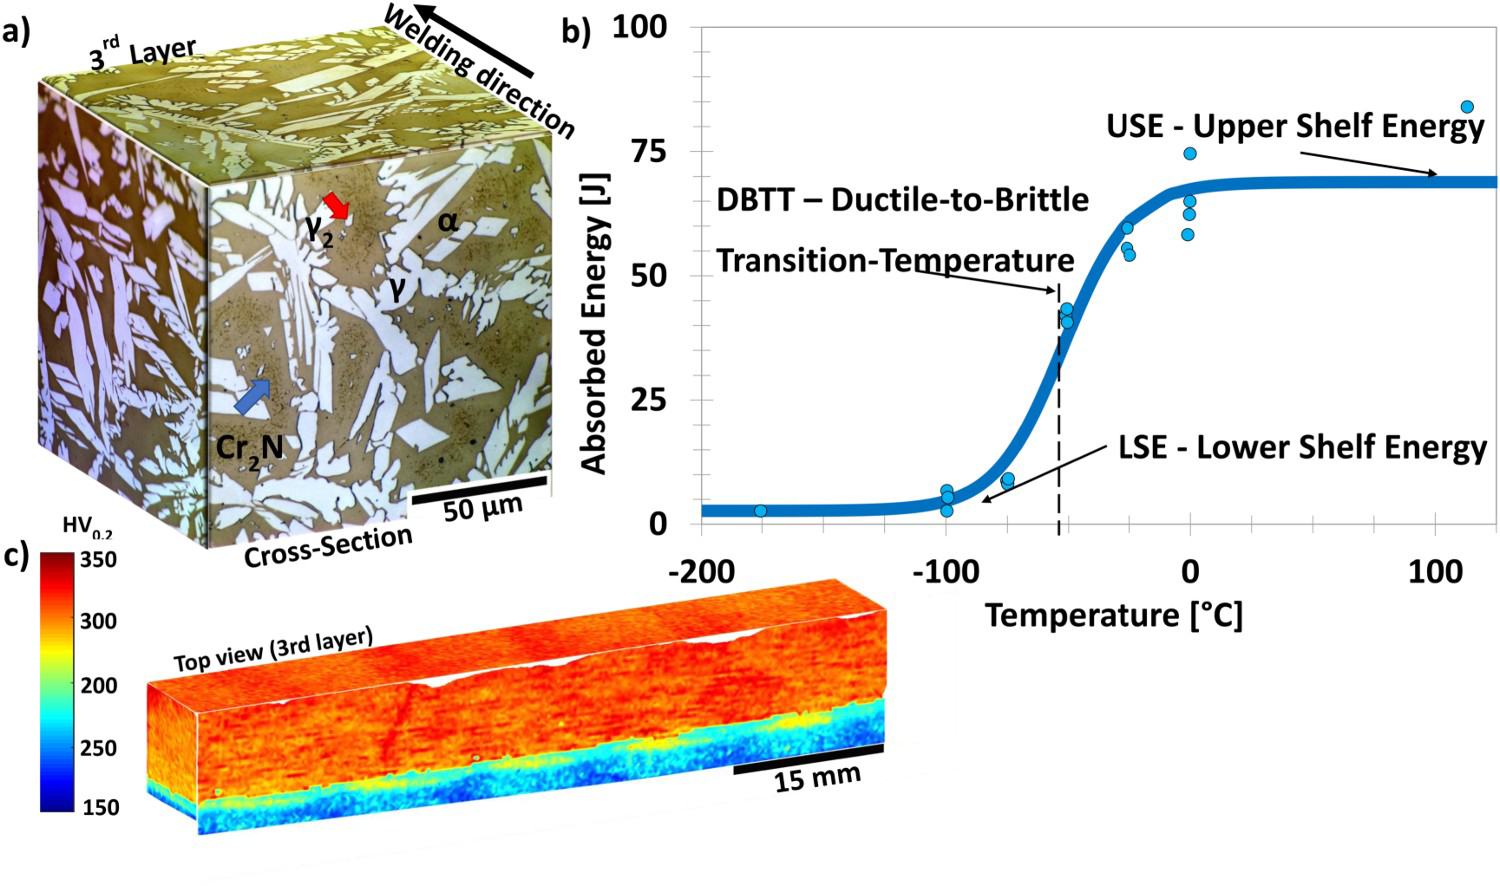
Within the ferrite matrix, significant Cr2N precipitation is observed, forming clusters along previous ferrite grain boundaries (blue arrow), mainly in the third and some in the second layer, but none were found in the first layer. These nitrides form during cooling across all layers, but due to reheating from subsequent layers, they were mostly dissolved, except for the last layer [36].
Due to the total thickness of the deposited layers, only a subsize impact toughness specimen could be machined. Figure 6(b) presents a newly developed HDSS deposited wire ductile-to-brittle-transition-temperature (DBTT) curve. This data, not available in the literature, establishes the DBTT value and illustrates the transition features as a function of temperature. The upper shelf energy (USE) value of 68J is defined until 0°C, with the toughness transition ranging from 0°C to −100°C, defining a DBTT value of −52.8°C. Although no established sub-size to full-size correlation exist for the entire DBTT curve, specific correlations for the DBTT and USE values have been suggested in the literature. Thus, the full-size corresponding DBTT of −34.8°C was calculated based on Towers [37], with a USE value of 169.85J calculated according to Lucon et al. [38].
Figure 6(c) shows a microhardness map across five beads of the deposited HDSS, with an average of 305.88 ± 0.322 HV0.2. Subtle changes are observed between beads, and no significant difference is found between the layers, regardless of their varied thermal history. An ASTM G68 testing yielded a critical pitting temperature (CPT) of 60°C. The measured hardness and CPT values do not indicate the presence of sigma phase in the welded mockup.
Based on the derived experimental data, the validated kinetics model efficiently predicts sigma phase formation, making it critical for predicting and controlling the occurrence of sigma phase during welding. By combining kinetics with FEA, we can not only determine a threshold cooling rate but also optimise the welding process by adjusting parameters to achieve maximum productivity without forming the sigma phase.
Conclusions
The sigma phase precipitation was modelled based on experimental data and validated through weld-clad experiments, making the kinetics results directly applicable to welding and joining processes. The developed kinetics model significantly enhanced our understanding of sigma phase precipitation kinetics in hyper duplex stainless steel, leading to the following conclusions:
Thermodynamic calculations indicated that in the equilibrium state, the HDSS wire's chemical composition allows for a high volumetric percentage of the sigma phase formation. Additionally, nitrogen's presence in thermodynamic equilibrium reduces the sigma phase and Cr content in the ferritic matrix. Considering kinetics is crucial for understanding sigma phase formation in HDSS, as even brief exposure to its precipitation temperature range (as little as 62 s) can lead to sigma phase formation. By combining experimental data, computational kinetics, the additive rule, and FEA thermal history, it becomes possible to predict the cooling rate limit necessary to prevent sigma phase formation in an HDSS welded mockup. The calculated sigma phase volume percentages from cooling rates of 4°C/s, 2.5°C/s, and 1°C/s exhibited excellent agreement with the physical simulator experimental results using these cooling rates. Notably, in the three-layered weld cladding configuration for this HDSS alloy, a threshold cooling rate of 4°C/s was obtained, indicating the critical cooling rate to avoid sigma phase formation. Counterintuitively, the higher Cr content of the HDSS did not decrease sigma phase kinetics time. Nevertheless, the kinetics model was validated through overlay welding procedures, confirming its accuracy. The thermal history analysis indicated a minimal cooling rate of 20°C/s, which is faster than the calculated 4°C/s threshold. Microscopy, mechanical, and corrosion testing conducted on the welded mockup specimens did not indicate the presence of sigma phase, further confirming the effectiveness of the developed kinetics model. The established CCT kinetics model allows for the prediction of sigma phase formation based solely on thermal history, negating the need for welding experimental data. Therefore, sigma phase formation in HDSS can be accurately evaluated using only thermal history, whether experimental or calculated.
Footnotes
Acknowledgements
The authors thank the Manufacturing and Materials Joining Innovation Center (Ma2JIC) and NSF (IUCRC program, awards 1539992, 1822144, and 2052747). OSU Center for Electron Microscopy and Analysis (CEMAS) for its support in microscopy. ESAB mentors R. Menon, M. Denault, P. Björnstedt, and V. Hosseini for providing the material and fruitful technical discussions. N. Daubenmier for the support for Python coding. R. Vandergriff for the manuscript revision.
Disclosure statement
No potential conflict of interest was reported by the author(s).
Data availability statement
The participants of this study did not give written consent for their data to be shared publicly, so due to the sensitive nature of the research, supporting data is not available.