
Abstract
An astigmatic electron beam with an ellipticity ratio of approximately 2:1 was examined using the Enhanced Modified Faraday Cup (EMFC) diagnostic to measure its properties and show how the power density distribution varies near the beam waist. Results show that the beam has two power density peaks, one on either side of the beam crossover point, resulting from different focal distances of the major and minor axes of the elliptical beam shape. Quantification of the beam properties was used to establish a depth-of-field where the beam diameter and peak power densities are relatively constant. For the 1 kW beam studied here, the depth-of-field measured approximately ±5 mm from the beam crossover point, illustrating how electron beam diagnostics can be used to identify process control limits for repeatable and reliable welds under non-ideal electron beam power density distribution conditions.
Keywords
Introduction
Electron beams used for welding are commonly formed using a high voltage triode assembly that contains a negatively charged cathode that generates the electrons, a beam focusing bias cup of the same electrical charge, and an anode of positive electrical charge to accelerate the electrons to high voltages, typically between 50 and 150 kV [1–3]. Although the basics of electron guns are the same, electron beam welding machines have different designs and cathodes, and can be used over wide power ranges where the beam's power distribution varies considerably for different conditions. Being able to measure the variations in power distributions for such beams is important in order to produce reliable and repeatable welds and for transferring parameters between different machines [4–6].
Within a given machine the beam may also vary over time and with cathode filament changes. Such variations can be attributed to cathode position within the electron beam gun, wear of the limited-life cathodes, and alignment of the gun components and focusing optics of the assembly, which can all contribute to non-perfect electron beam distributions in the final focused beam. Analysis of electron beams shows that the current density distributions tends to be Gaussian shaped with some astigmatism that makes them non-circular [7]. The most common non-circular shape tends to be an astigmatic ellipse that rotates its orientation 90° as it passes through the sharp focal position. Figure 1 illustrates this effect as adapted from the ISO standard for laser beams [8], which can be considered analogous to electron beams for the purpose of defining astigmatic beam propagation. In this figure, x, y, and z represent orthogonal axes of a beam propagating in the z-direction, Θ is the full divergence angle, and σ is the standard deviation of the beam's power density distribution.
Simple astigmatic beam propagation, as adapted from the ISO standard for laser beams [8].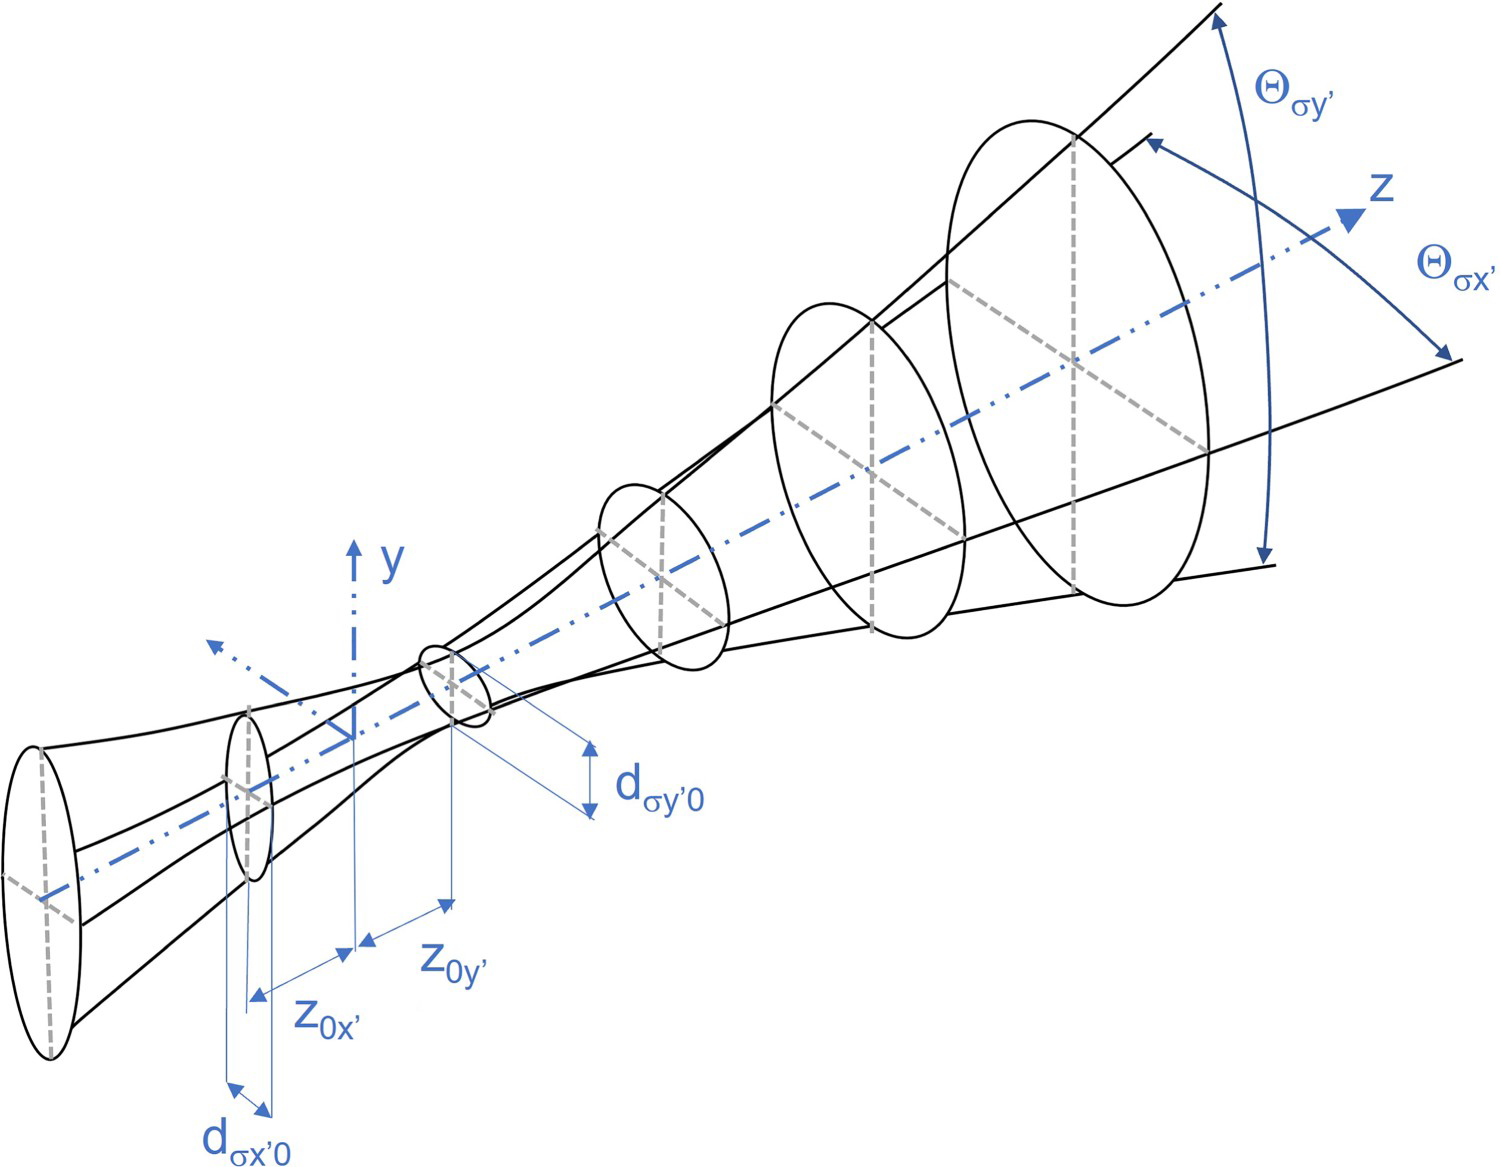
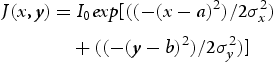
For the elliptical astigmatic beam shown in Figure 1, the x-axis comes into its sharpest focus at a location Z0x′ and the y-axis comes into its sharpest focus further downstream at Zoy′ as will be shown later. The current density distribution in this beam can be mathematically defined at any point along the propagation axis by a relatively simple analytic expression related to the major and minor axes of an elliptical shape [8].
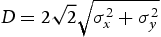
When the beam cannot be described by a simple Gaussian relationship or other expressions, a second-moment calculation of the power density distribution can be performed to estimate the beam diameter [8]. This method is described in detail elsewhere [7,8], where the beam diameter is defined by a calculation of the first and second moments of the power density distribution to find the standard deviations of the beam, and then, the overall averaged diameter of the distribution, D, can be calculated from the following expression:
In this paper, the EMFC diagnostic is used to measure the power density distribution of the electron beam. This method quantifies the beam's power distribution using radial slits to capture profiles of the beam and computed tomography to reconstruct the beam profiles into a 3-D shape [9], as opposed to pinhole apertures that are commonly used in other devices when the beam can be scanned over the pinhole at high very high rates [4]. The EMFC measures and reports the beam's power density distribution at its full width at half maximum power density, FWHM*, and at its full width at 1/e2 of the maximum power density, FWe2* [7,9]. The FWe2* is considered to be the beam diameter and is calculated by taking the area of the power density distribution of the beam at 1/e2 of the peak power, which corresponds to 86.5% of the total beam power and equates this area to a circle of diameter D. The FWe2* is identical to D4σ for a perfect circular Gaussian beam, but calculates to a smaller value than D4σ for non-circular beams [7] due to the nature of the second-moment calculation of D4σ as briefly discussed above. Applications of the EMFC diagnostic method can be found in the following references for transferring parameters between machines [5], electron beam weld process control [6], electron beam power density distribution comparison with laser beams [10], and how an astigmatic beam shape can produce a non-symmetric weld pool shape[11].
By measuring the power density distribution of the beam as a function of distance along the beam's propagation axis, an optimum work distance for a given beam and the beam's sensitivity to changes to the lens-to-work distance can be determined. Furthermore, the results shown here will point out the effects that astigmatic beams have on the power density as it propagates, demonstrating a method for establishing an optimum focal length range for welding, which has not been openly discussed or employed using previous studies that employ electron beam diagnostics.
Experimental methods
Electron beam diagnostics and beam measurements
The electron beam welder used here is Hamilton Standard SN 605 with an R-40 gun, assembled with a W-Re ribbon cathode (CL-167-R) with a ∼1 × 1.3 mm emitting surface, and maximum power capability of 7.5 kW (50 mA at 150 kV). For the experiments performed here, the beam's power was controlled at 1 kW (100 kV and 10 mA), and its focus was set at a fixed distance below the focusing lens for all of the conditions studied. The Enhanced Modified Faraday Cup diagnostic [12,13] was used to measure the current density distribution of the electron beam along its propagation axis using a z-axis stage to move the EMFC up and down parallel to the beam's path. This allowed the beam to be sampled in a systematic way to measure the beam's dimensions and power density distribution above, though, and below the crossover region of the beam. The 1 kW beam studied here is used for making many electron beam welds that are up to about 10 mm deep. However, higher powers are used when deeper penetration welds are required [1,4]. In a previous study [13], the effects of beam power on beam shape were investigated on this same machine, showing that the electron beam power density distribution shape for a ribbon filament was maintained up to the maximum of 30 mA in that investigation, so only one power level was studied here as a representative power for the beam analysis studies that follow.
The EMFC diagnostic operates by deflecting the beam at full power over a radially oriented slit disk in a circular pattern to create profiles of the beam at different angles. The individual profiles are reconstructed using a computed tomographic method (CT) to analyze the beam's power density distribution [9,12,13]. In this study, the EMFC was set up with a standard 17-slit disk to create 17 profiles of the beam, acquired by a fast-acting data acquisition system and laptop computer as the beam was rotated rapidly in a circle at 85 Hz over the diagnostic. The data acquisition system captured data at 500k samples/s to provide high-resolution CT-reconstructed profiles of the beam at different distances from the beam's crossover location in order to measure changes in the beam properties.
Results and discussion
All of the electron beam diagnostic data were taken on a fixed focal length beam by initially finding the point where the beam reaches a minimum size and has the highest peak power density, which occurred at a working distance of 190.5 mm below the top of the vacuum chamber. Since the focusing lens sits 64 mm above the top of the chamber, this position corresponds to Z = 254.5 mm distance from the lens, and the rest of the results will be reported in the lens-to-work distance. The EMFC diagnostic stage had a z-axis range of about 76 mm of travel and was placed at a starting position of Z = 297.7 mm below the lens, where the beam was overfocused by about 43 mm of travel from the peak power density location. The diagnostic was then moved up in 2.54 mm increments to reach its highest position of Z = 221.5 mm below the focusing lens where it was underfocused approximately 33.2 mm, for a total z-axis range of 76.2 mm. Some of the data points were repeated to give average values of the readings.
All of the EMFC data are summarized in Table A1 in the Appendix, showing the FWHM*, FWe2* beam diameter, and the peak power density measured at each location. The overall beam diameters ranged from 0.36 mm at the sharpest focus location to about 1 mm at the furthest points from crossover, representing approximately 3× increase in beam diameter for this z-axis range. Plotting these data versus distance from the focusing lens creates the envelope of beam diameters, often referred to as the beam caustic. The FWe2* beam diameter and the FWHM* are shown in Figure 2 for the 76 mm of total distance measured. The beam converges at the beam waist located at Z0 = 260 mm, by extending the far field asymptotes of the envelope to a central point. Surrounding this point is a region approximately ±10 mm wide where both the measured FWe2* and FWHM* are relatively constant in size as the beam passes through this crossover region.
Results of the EMFC diagnostic measurements of the beam, showing the beam caustic based on FWHM* and FWe2* near the crossover region of the beam.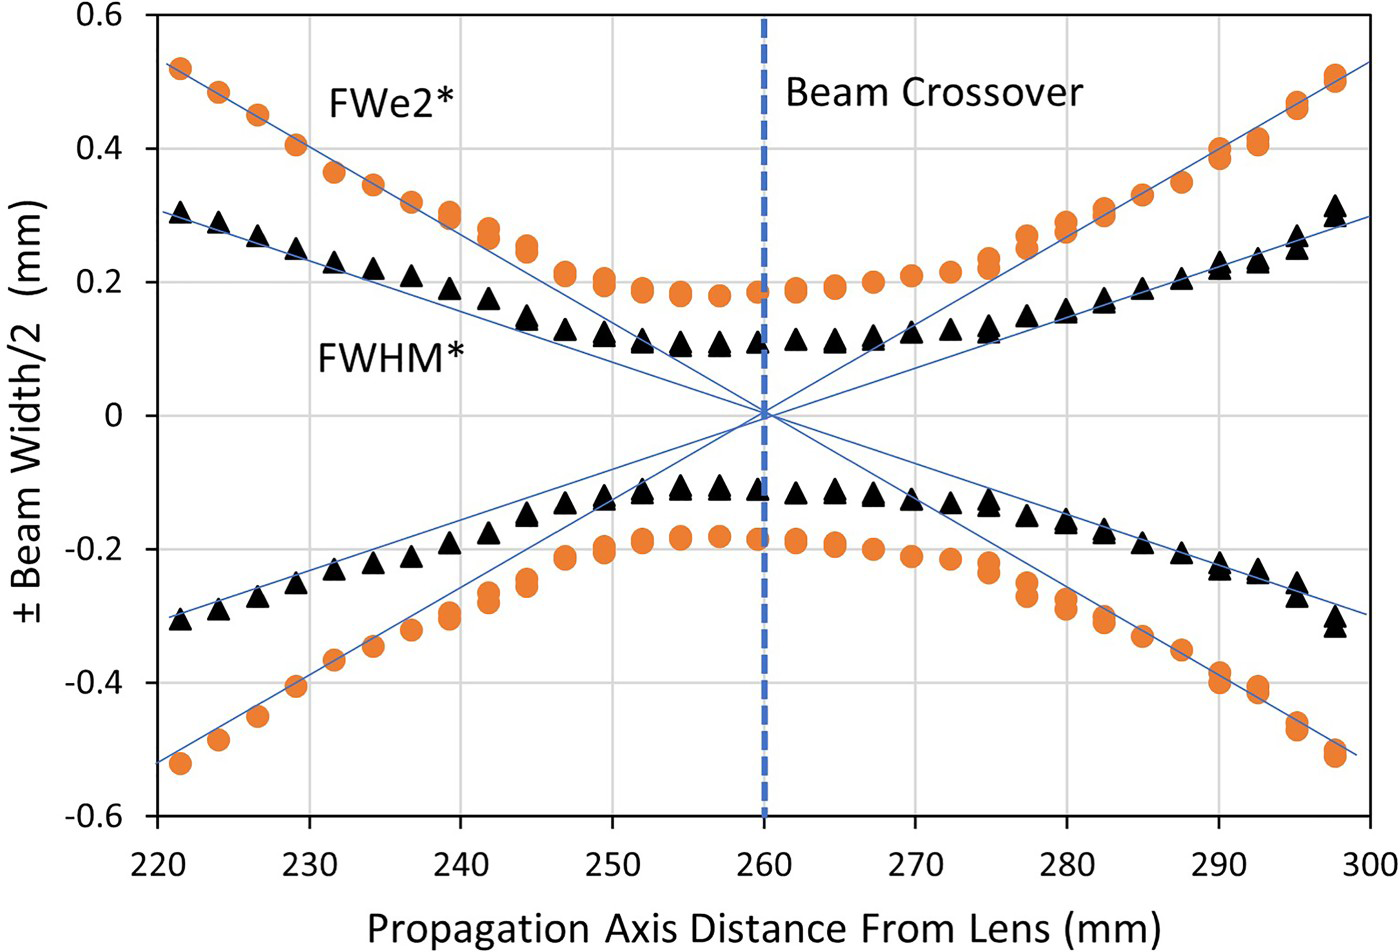
Analysis of the beam caustic is presented in Figure 3 and summarized in Table 1, for the diverging part of the beam from the crossover point at Z0 = 260 mm downstream. From these data, the beam divergence angle is measured to be 26 mrad, with a Rayleigh length of 20.5 mm where the beam doubles in area. Taking the beam waist diameter, do = 0.37 mm and full divergence angle θ = 26 mrad results in a beam parameter product of 2.41 mm-mrad (BPP = do Θ/4), which is comparable to high-power multi-mode lasers used for welding [10]. Note that if D4σ had been used instead of FWe2*, then the BPP would be approximately 1.5 times larger for this welder [7].
Beam divergence measurements based on the beam diameter, FWe2*, showing that the beam has a divergence angle of 26 mrad, a Rayleigh length of 20.5 mm, a minimum beam diameter of 0.37 mm, and a beam parameter product of 2.41 mm-mrad. Electron beam caustic analysis based on FWe2*.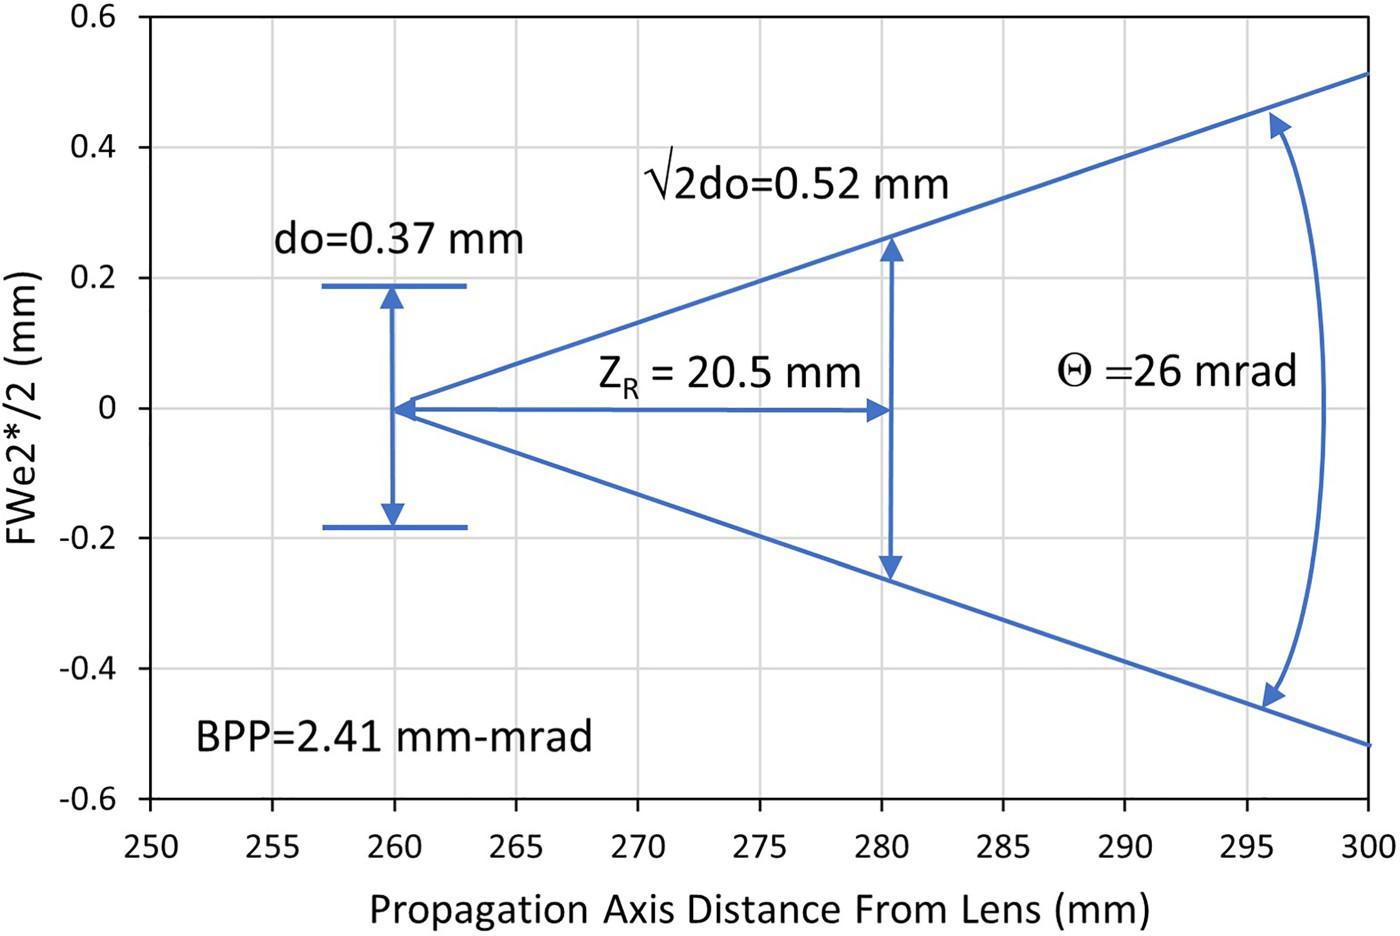
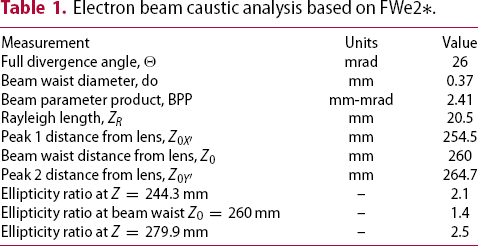
The power density distribution plots from the EMFC data show that this beam is astigmatic. Figure 4 summarizes several of the power density distributions near and through the crossover region of the beam, indicating that it has a vertically oriented elliptical shape (101.4°) above the crossover location that rotates to a horizontally oriented elliptical shape (6.6°) after it passes through the crossover. The ellipticity ratio of a distribution, ϵ(z), is defined as the ratio of the length of the major elliptical axis to its minor axis and is summarized in Table 1 for several key locations bounding the beam waist. The ellipticity ratio is ϵ = 2.1 for the underfocused beam at Z = 254.5 mm; ϵ = 1.4 for the beam crossover point at Z0 = 260 mm; and ϵ = 2.5 for the overfocused beam at Z = 279.9 mm. Any beam ellipticity greater than ϵ = 1.15 is considered to be non-circular [8], which corresponds to all of the distributions measured, even at the beam waist where ϵ = 1.40 is at its minimum as the major and minor axes are crossing. Outside of the beam waist ϵ is 2.3 on average for this elliptical-shaped beam which is large enough to affect the weld penetration depending on the beam orientation relative to the welding direction.
EMFC Contour plots of the power density distributions at different distances from the lens for (a) Z = 244.3 mm, (b) Z0X′ = 254.5 mm, (c) Z0 = 259.6 mm, (d) Z0Y′ = 264.7 mm, (e) Z = 269.7 mm, and (f) Z = 279.9 mm. Rotation of the elliptical beam shape and changes in the peak power density are illustrated as the beam passes through the crossover region. The color contour power density legends are shown in units of W/mm2.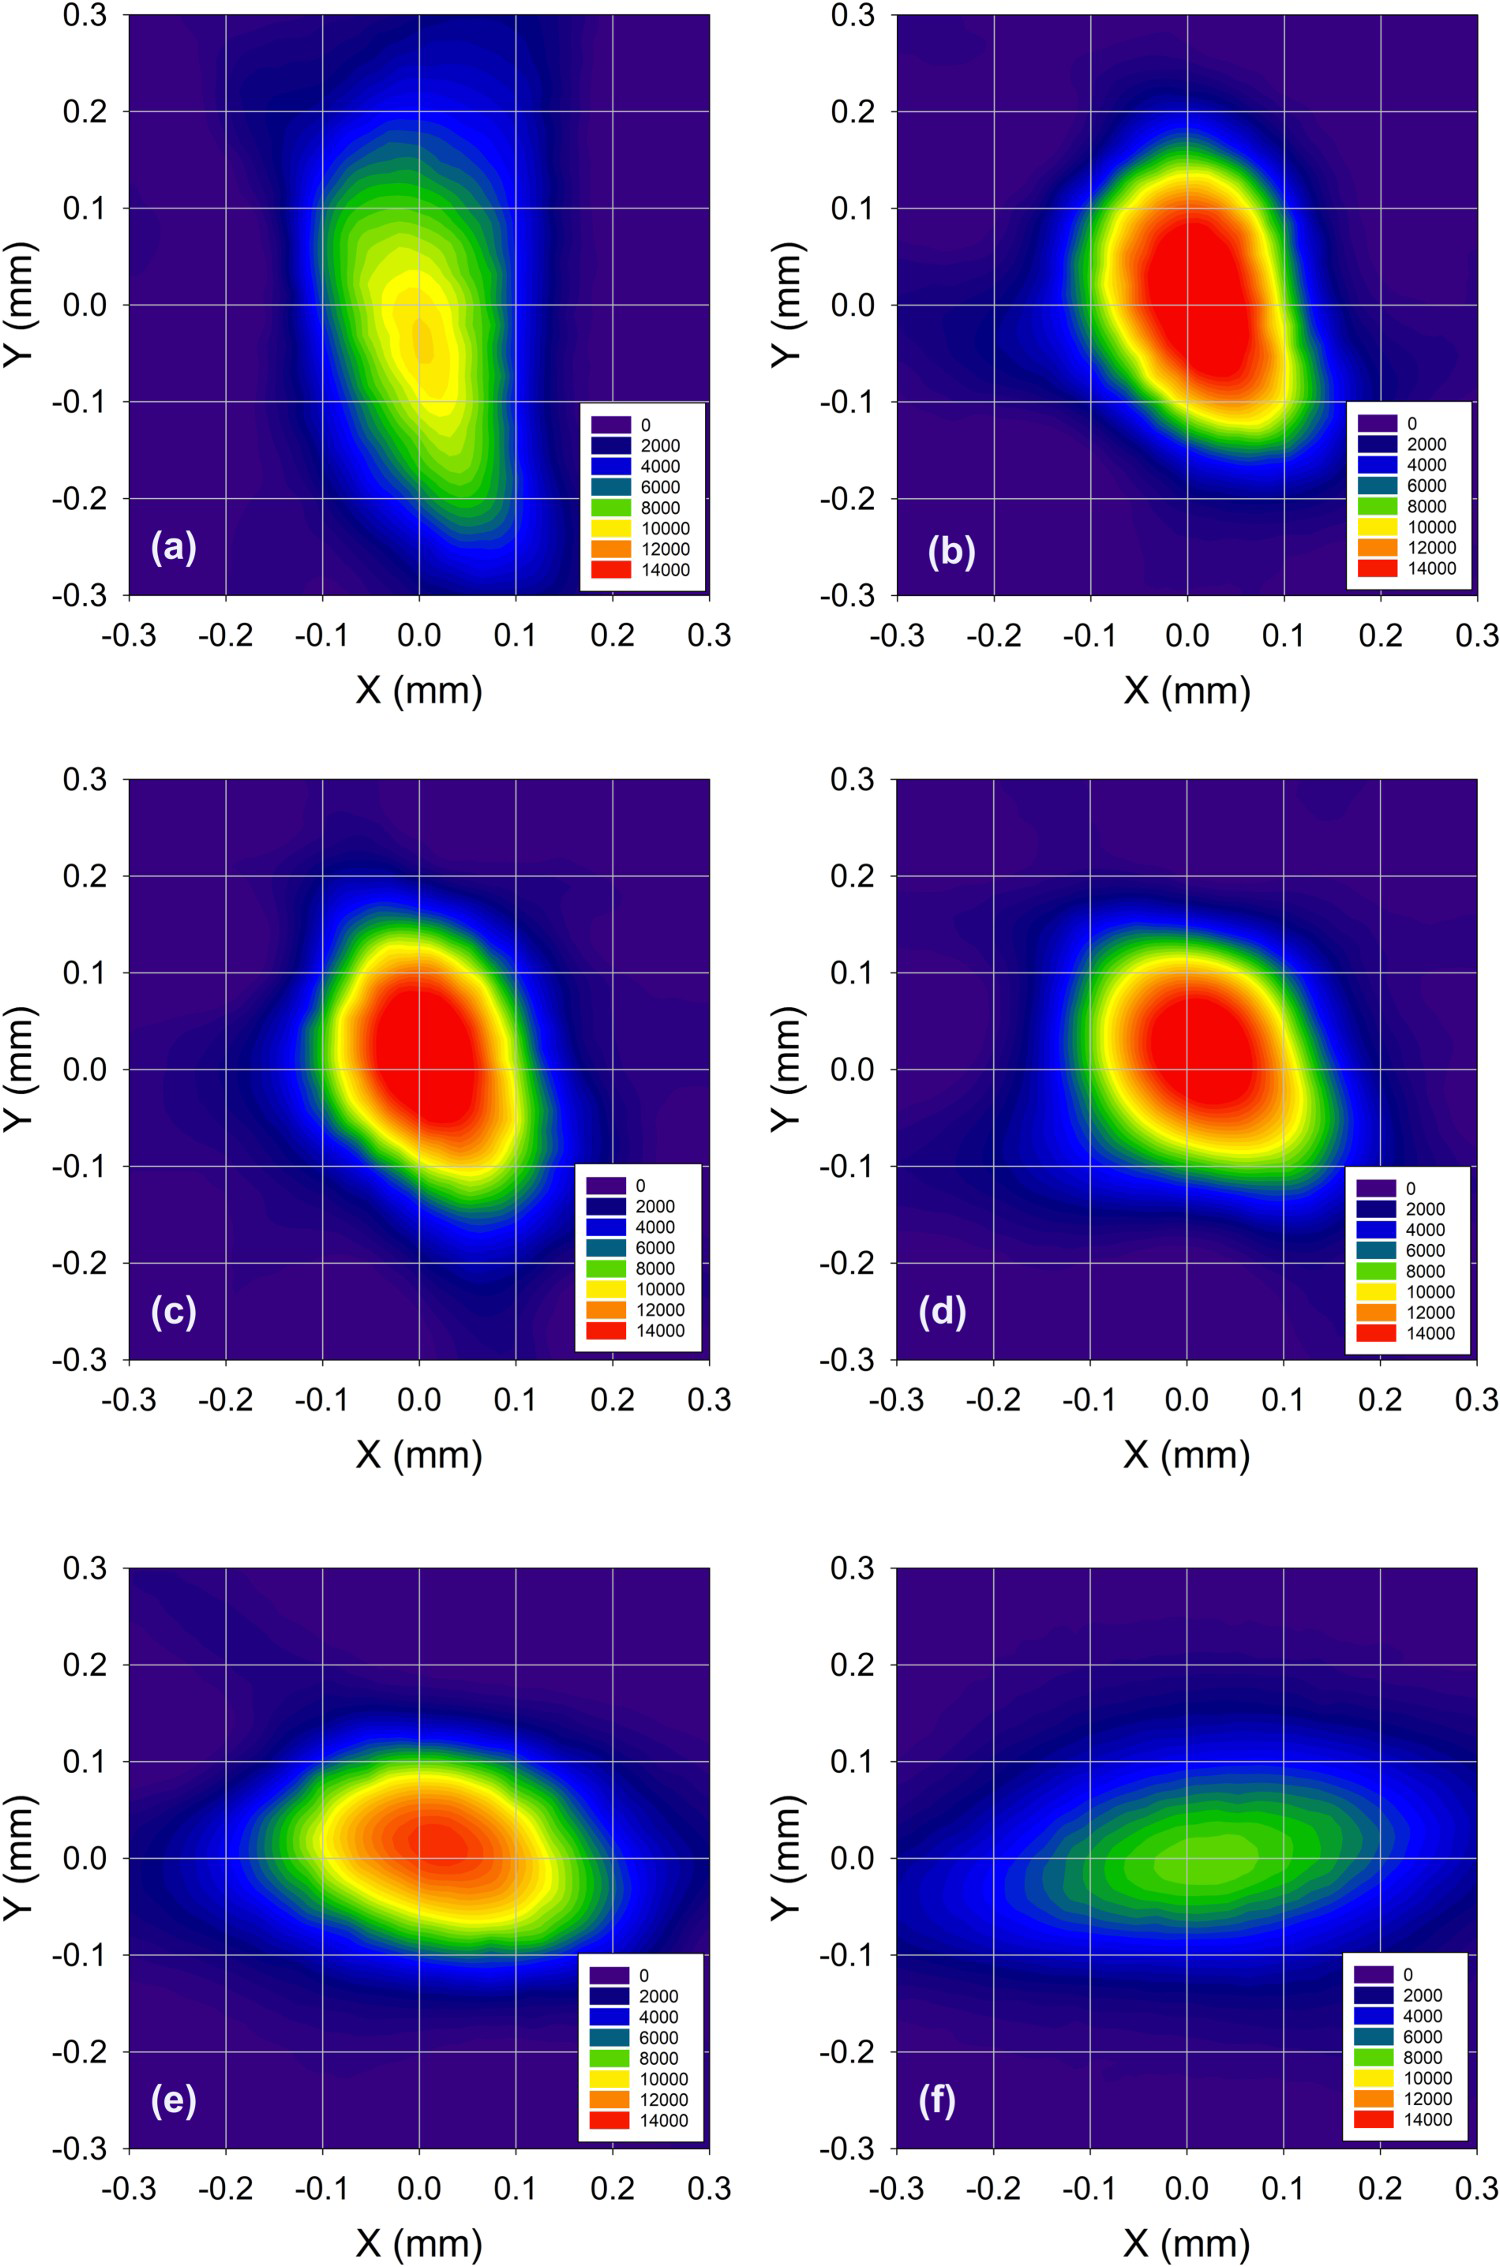
Color shading in the beam profiles shown in Figure 4 correlates to the power density, and all are plotted on the same color scale for comparison. The most defocused beams shown in Figure 4 have peak power densities on the order of 8,000 W/mm2, whereas the more focused beams have peak power densities in excess of 14,000 W/mm2, reaching a maximum of 18,300 W/mm2 as summarized in Table A1. Within the central portion of the crossover region, the beam has a more circular shape as the x and y major axes of the ellipse are coming together at the beam waist region surrounding the central crossover point at Z0 = 260 mm as indicated in Figure 2.
The peak power densities for all of the data are plotted in Figure 5 versus distance from the focusing lens. This plot gives a better understanding of the beam's intensity as it propagates in the electron beam chamber than the beam diameter alone. The crossover point at Z0 = 260 mm has a peak power density of ∼16,800 W/mm2, but does not correspond to the highest power density, which occurs at Z0X′ = 254.5 mm where it has a value of ∼18,300 W/mm2. Analysis of the shape of the peak power curve indicates that there is a second minor peak at Z0Y′ = 264.7 mm with a power density of ∼16,300 W/mm2. These two peaks bound the central crossover point and define the region where the power density gradually increases with distance from the lens. This region can be considered to be the depth of field for this beam since the peak power density is relatively constant. Outside of the two peaks, the power density drops off more rapidly, where small variations in the z-axis setting would lead to larger changes in the peak power density and correspondingly larger variations in the depth of weld penetration. Although not shown in this study, for a more circular beam with less astigmatism, one would expect the two peaks to approach each other and merge into one peak for a perfectly circular Gaussian beam.
Peak power density measurements potted as a function of distance from the focusing lens. Two peaks are indicated, one on either side of the beam crossover point, corresponding to the sharpest focus of the major and minor axes of the elliptical shape of the astigmatic beam.
Based on the results of the peak power density measurements, some recommendations can be made to set optimum focusing conditions for welding and to help understand how defocusing affects the peak power density of astigmatic electron beams. These are summarized in the conclusions below along with other observations made in this study.
Conclusions
The astigmatic 1 kW electron beam studied in this investigation propagated with an elongated shape having an ellipticity ratio of ϵ = 2.3 outside of the beam waist region, and a smaller ratio at the beam waist of ϵ = 1.4. The major beam axis was shown to rotate 90° over the ∼±10 mm wide crossover region centered on the beam crossover point. The EMFC diagnostic was used to quantify the beam caustic and power density distribution along the propagation axis, showing that the beam had a minimum diameter of 0.365 mm, a full divergence angle of 26 mrad, a Rayleigh length of 20.5 mm, and a beam parameter product of 2.41 mm-mrad, based on the FWe2* beam diameter measurements. These data are comparable to those for high-power multi-mode lasers with long focal length lenses used for welding. The crossover point of the beam at Z0 = 260 mm was bounded by two power density peaks, one at Z0X′ = 254.5 mm and a smaller peak at Z0Y′ = 264.7 mm, presumably corresponding to the sharpest focus points for the major and minor axes of the elliptical shape. Over this ∼±5 mm range, the beam diameter increases from 0.365 mm to 0.385 mm as the distance to the lens increases, while the peak power density decreases by about ∼10% from one peak to the other. This region can be considered to be equivalent to the depth of field for this astigmatic beam, where the beam properties are relatively constant. Outside of this region the peak power density varies more rapidly with work distance and would not be recommended for welding where repeatability is required.
Footnotes
Disclosure statement
No potential conflict of interest was reported by the author(s).