
Abstract
Consumer satisfaction with the services provided in a prosthetics and orthotics (P&O) facility has seldom been studied. The aim of this study was to analyze consumer satisfaction regarding the services provided by 15 P&O facilities in The Netherlands. Consumers (n = 1,364) of these P&O facilities who were fitted with a prosthesis, orthopaedic shoes, an orthosis, or another device, were asked to rate the overall services provided and whether they were satisfied with the device provided and its delivery time. Additionally, they filled in a modified SERVQUAL questionnaire (see Appendix). Consumers gave the service provided by P&O facilities a mean overall rating of 8.1. The highest ratings were given by consumers fitted with a prosthesis (mean overall rating of services: 8.4). In total, 78% of the consumers were satisfied with the device provided and 93% with the delivery time. The results of our study showed that, on the SERVQUAL, 50% of the statements fulfilled the criteria for a satisfactory quality of the services. The overall consumer rating of the service provided by P&O facilities is high and depends on the device provided. The outcomes on the SERVQUAL were moderate. In future, it is important to study consumer satisfaction more extensively in order to improve the quality of P&O services in daily practice. Additionally, specific questionnaires need to be developed to measure all aspects of prosthetic and orthotic care, with the aim to improve the services.
Keywords
Introduction
In healthcare, quality of care is playing an increasingly important role: Consumers are becoming more critical, they become better informed about care through the internet and the standard of care is developing rapidly. Additionally, insurance companies demand greater quality in the products they are paying for. To measure quality of care several instruments have been developed, but the exact construct of “quality of care” is not clear. As a result, there is a search for a theoretical concept to develop a (new) framework for measuring quality of care.1-5
In the case of limb amputees, different questionnaires6-9 have been used in order to assess the experiences of people wearing a prosthesis. These questionnaires focus on the quality of life or the satisfaction of the amputee with a certain prosthesis or with the quality of care. A better quality of care may result in a greater satisfaction with the prosthesis or a better use of the prosthesis. In this respect, quality of care includes: (i) The technically correct manufacturing of the prosthesis, as well as the prosthesis' cosmetic aspects and comfort during use; (ii) the service provided to consumers, such as a consumer oriented approach, delivery and waiting time; and (iii) the appearance of the prosthetics and orthotics (P&O) facility, its equipment, privacy, and parking places. Specific amputee satisfaction with the prosthesis is often assessed; however, specific satisfaction with the services provided in a P&O facility is seldom assessed. To the best of our knowledge only Heinemann7 developed an instrument in which consumer satisfaction about the services provided is measured as well. However, no results have been published so far.
In 2002 consumer satisfaction with the services of four P&O and orthopaedic shoes facilities in the north of The Netherlands was studied.10 The study analyzed the services of P&O facilities in general, as well as the consumers' impressions of the facilities' priorities in the services provided and consumer satisfaction with these services. As a result of the outcomes showcases with information brochures about the products of the facilities were installed. Waiting rooms were furnished with new chairs and reading tables. Additionally, complaint books were made available and a complaint committee was installed. These changes were made across the four facilities investigated, very soon after the results became available. In the course of time, changes were made across the other facilities, too.
Data were collected in 2002 using a modified version of the SERVQUAL instrument.11,12 This instrument measures both consumer perceptions and expectations of the quality of the service given. SERVQUAL has been used to assess patient satisfaction in different healthcare environments such as nursing care, dental healthcare, medical education and medical service.13-18 In 2005 the management team of 15 P&O facilities spread over The Netherlands, including the four facilities studied in 2002, decided to repeat the study. Their purpose was to evaluate whether the improvements made on the basis of the outcomes of 2002 in the different facilities had indeed changed the quality of service. This decision gave us the unique opportunity to set the outcomes of 2002 and 2005 side by side.
The aim of this replication study was to analyze consumer satisfaction regarding the services provided by P&O facilities, using a modified SERVQUAL questionnaire, and to compare the outcomes of 2005 with those of 2002.
Methods
Between September and October 2005, consecutive consumers, visiting one of the 15 P&O facilities of the OIM-group in The Netherlands, in order to be fitted with a prosthesis, an orthosis, orthopaedic shoes, shoe inlays, prefab shoes, a corset, or stockings were asked to participate in the study. As in 2002, patients were asked to fill in a questionnaire during their visit. In the case of young consumers, their caregivers were asked to fill in the questionnaire.
Prior to the study it was thought that, in order to obtain a sufficiently large sample, about 25 consumers per facility per device supplied in that facility should be asked to participate. It was estimated that the total number of 2,375 participants would be feasible. The inclusion criterion was that consumers or their caregivers were able to read and write Dutch.
Data were collected, using a modified version of the SERVQUAL instrument (questionnaire is available on request). Because there was a strong inter-item correlation in the SERVQUAL questionnaire used in 2002, the questionnaire was shortened from 30 to 16 statements.
Consumers were asked to comment twice on all 16 statements: once with regard to their rating of importance and once with regard to their actual experience. An example of such a statement is: “The P&O facility delivers as agreed”. On a five-point Likert scale the possible answers were “This statement is very important – important – hardly important – unimportant – totally unimportant to me”, and “My experience with the P&O facility is very good – good – indifferent – bad – very bad or I am unable to answer because I have no experience with this specific statement”.
The criterion for a satisfactory quality was fulfilled if ≥85% of the consumers rated their “experience” of a certain statement on the SERVQUAL equal to or higher than their rating of its “importance”.
Furthermore, consumers were asked to fill in their sex and age, the time (in years) they had been using an orthopaedic device, their satisfaction with its delivery time and with the device itself (yes or no). No other private information was asked for.
Finally, consumers were asked to give the P&O facility an overall rating regarding the services provided on a scale of 1 – 10, with ‘1’ being the poorest possible rating and ‘10’ being the highest possible rating.
The management of the OIM-group wanted to assess consumer satisfaction of their facilities as they intended to improve the quality of their services to consumers. Approval of an ethical committee was not needed and hence not asked for. The data base with anonymous results of the assessments was made available to the authors.
Statistics
Statistical analyses were carried out in SPSS 14.0 for Windows, using descriptive statistics. T-tests for independent samples and ANOVA were used to analyze differences between groups regarding interval data, and χ2 tests were used regarding categorical data. P values < 0.05 were considered to be statistically significant. All analyses concerned all consumers in 2005 (2005-all group) and these results were compared with the results of 2002 (2002-group). Additionally, analyses concerned consumers of the same four facilities as studied in 2002 (2005-4 group), and these outcomes were compared with the results of 2002 (2002-group).
Results
A total of 1,364 consumers (2005-all group) filled in the questionnaire. In 46% of the questionnaires all statements were filled in. The questions most frequently filled in (97%) were those about sex and age. The statement “Reachable by means of public transport” was filled in by 44% of all consumers.
Percentages and numbers of sex, age groups and devices provided in the different groups studied
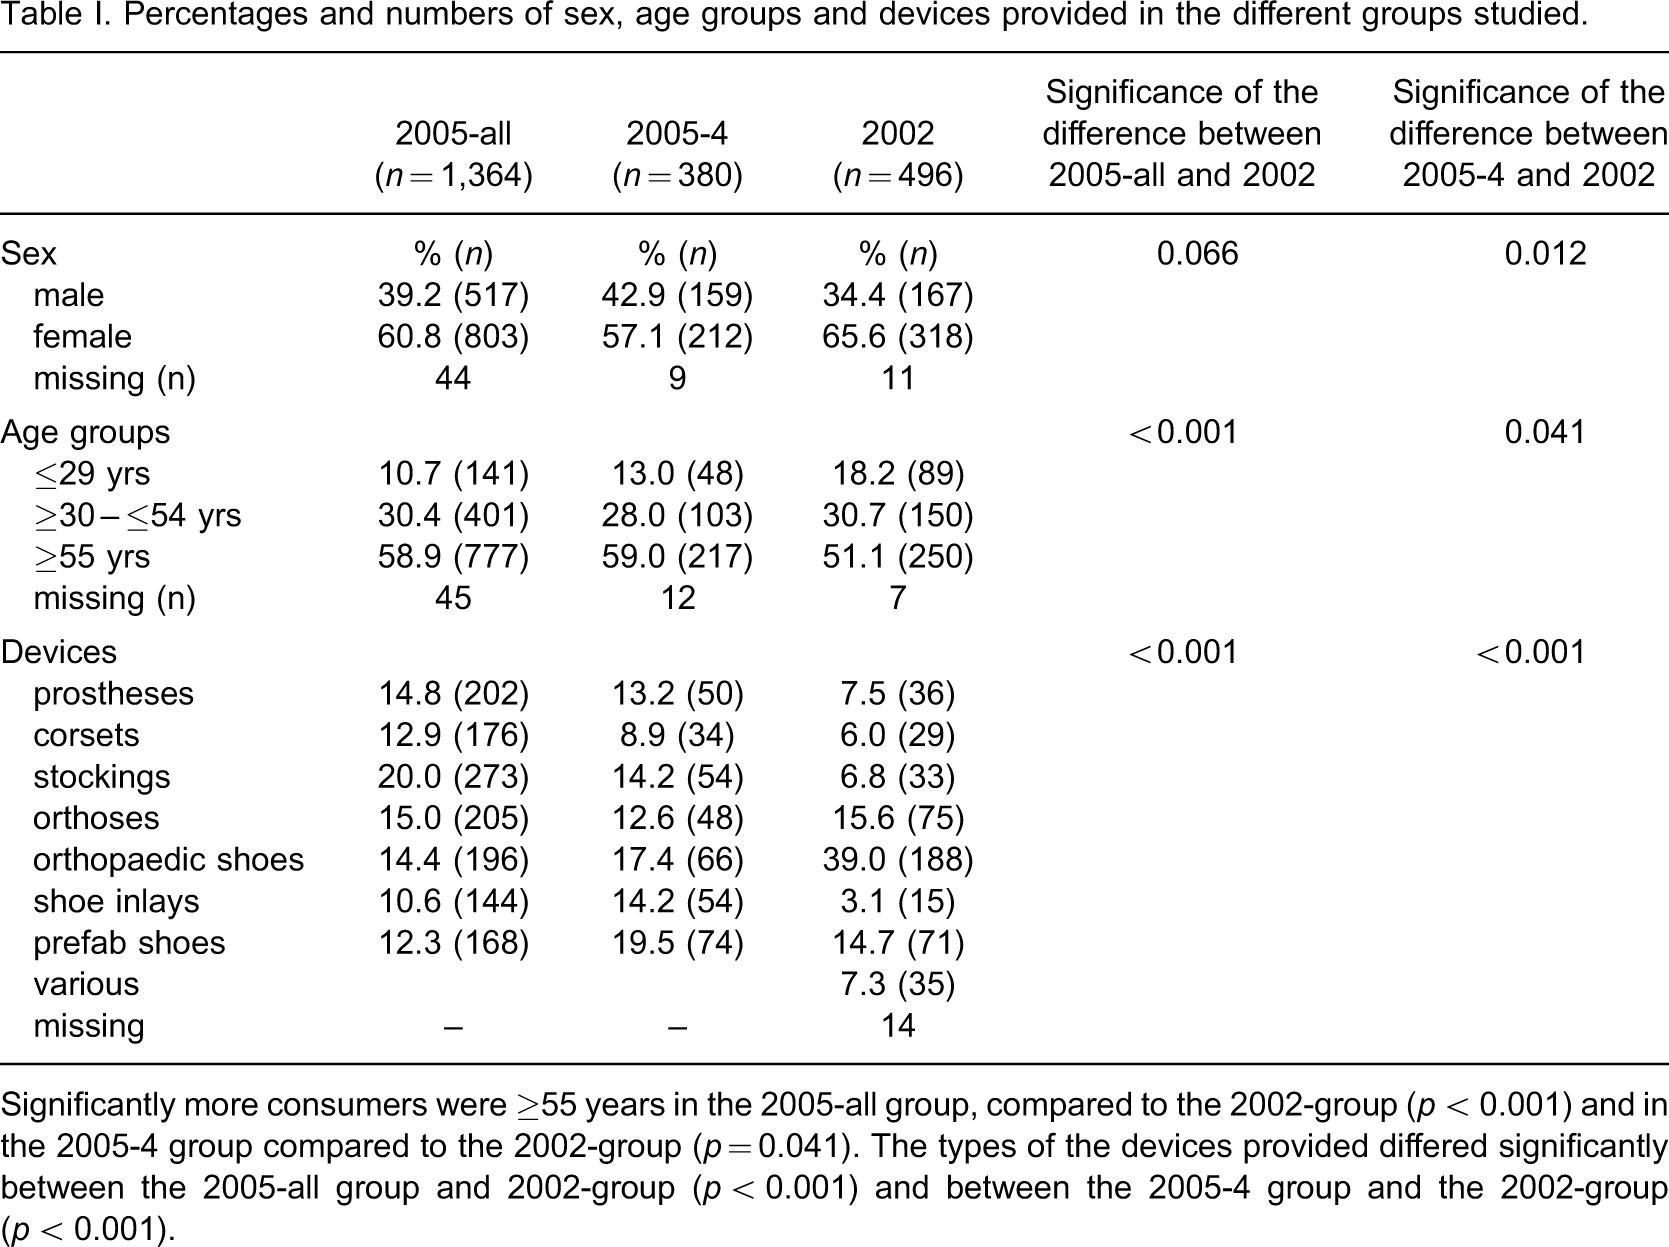
Significantly more consumers were ≥55 years in the 2005-all group, compared to the 2002-group (p < 0.001) and in the 2005-4 group compared to the 2002-group (p = 0.041). The types of the devices provided differed significantly between the 2005-all group and 2002-group (p < 0.001) and between the 2005-4 group and the 2002-group (p < 0.001).
Mean overall ratings, given to the P&O facilities by the consumers, divided into sex, age groups and devices provided
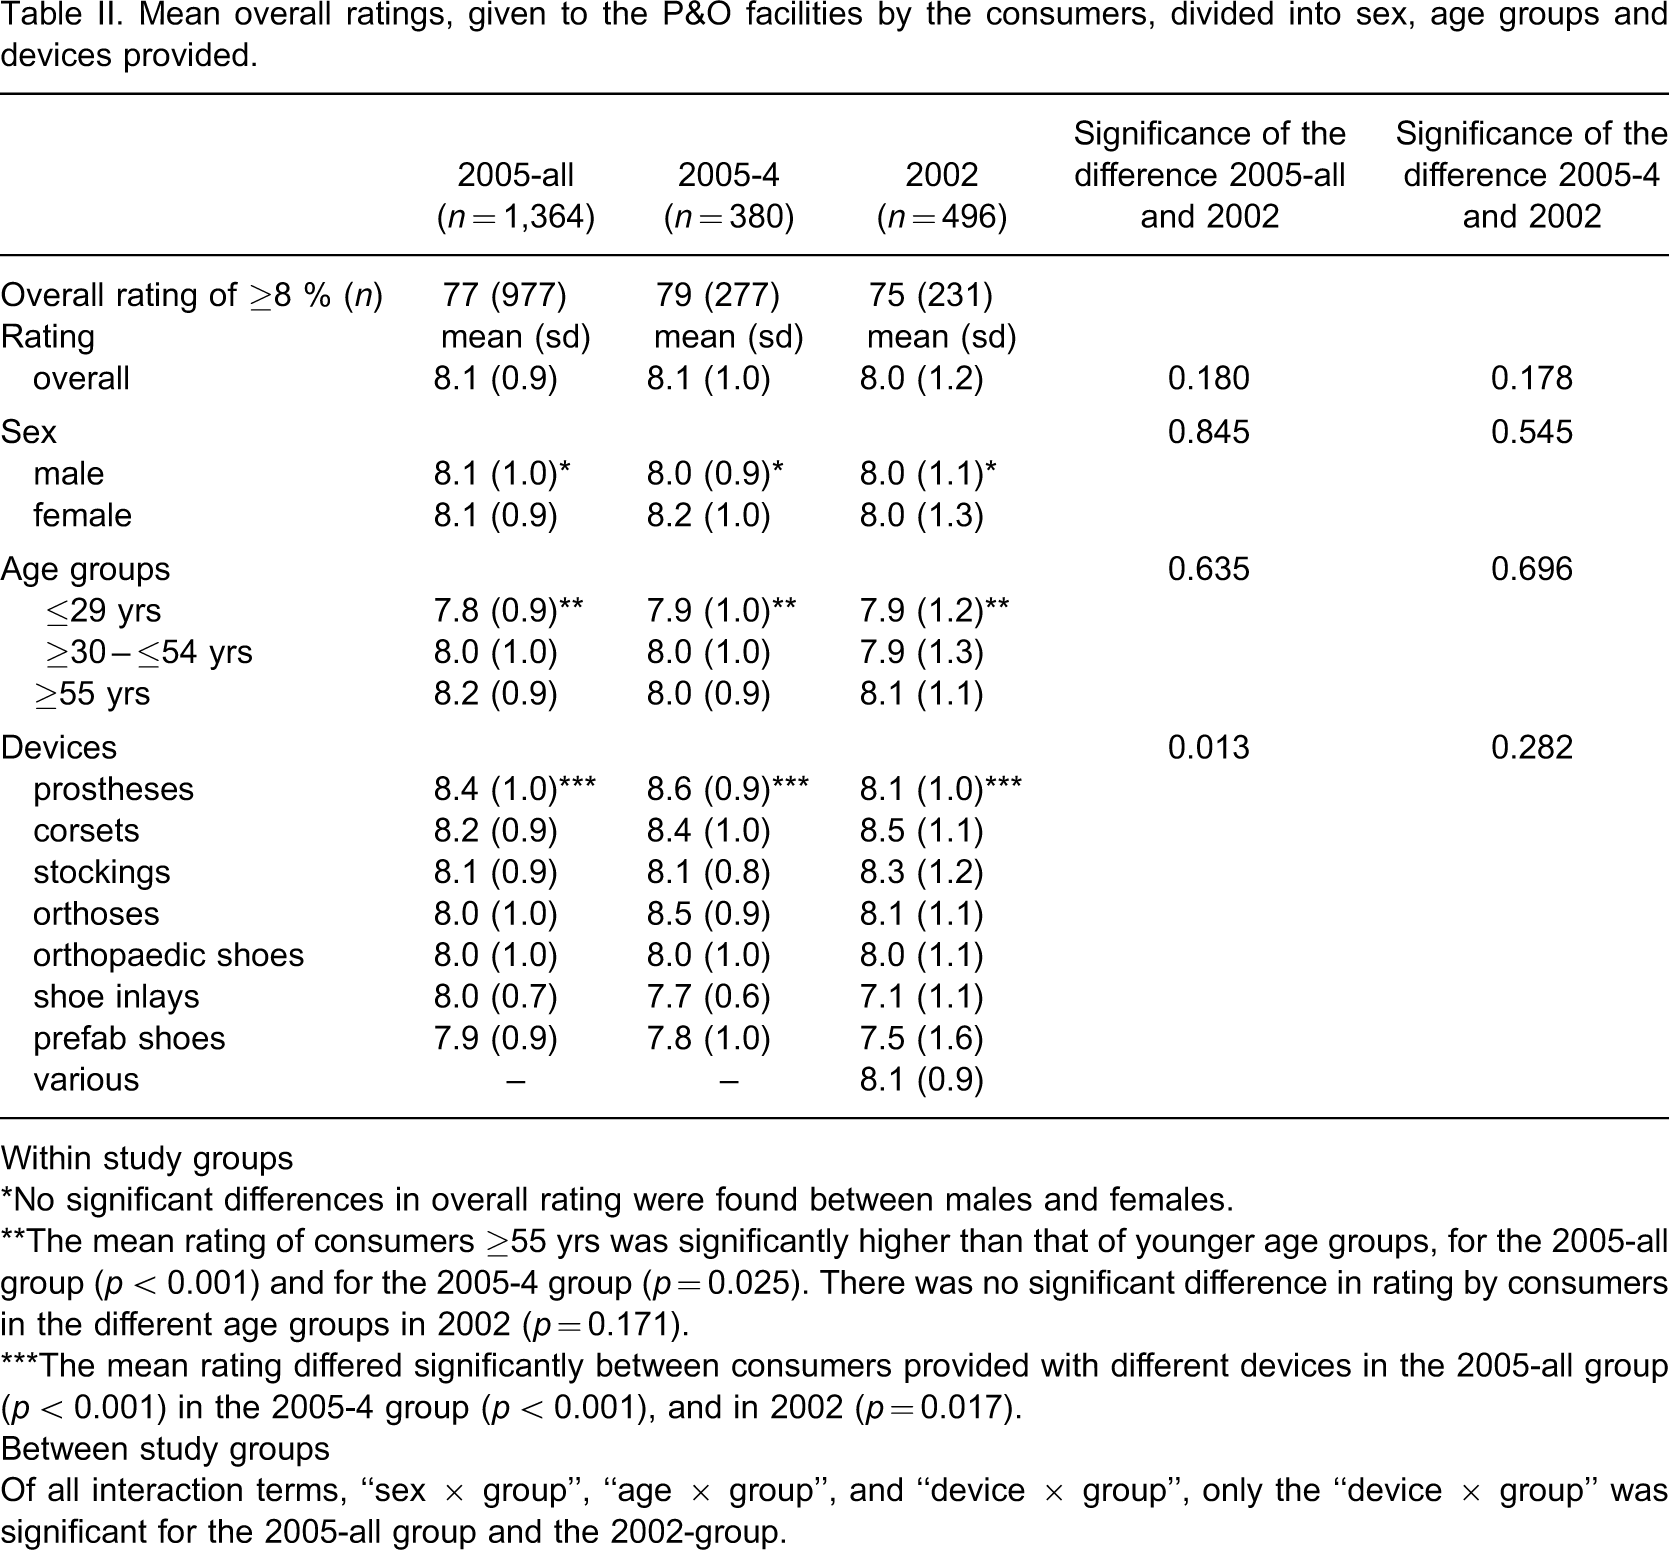
Within study groups
∗No significant differences in overall rating were found between males and females.
∗∗The mean rating of consumers ≥55 yrs was significantly higher than that of younger age groups, for the 2005-all group (p < 0.001) and for the 2005-4 group (p = 0.025). There was no significant difference in rating by consumers in the different age groups in 2002 (p = 0.171).
∗∗∗The mean rating differed significantly between consumers provided with different devices in the 2005-all group (p < 0.001) in the 2005-4 group (p < 0.001), and in 2002 (p = 0.017).
Between study groups
Of all interaction terms, “sex × group”, “age × group”, and “device × group”, only the “device × group” was significant for the 2005-all group and the 2002-group.
For the 2005-all group the mean time in years for using a device was 8.8 years (SD 11.8). A total of 93% of all consumers were satisfied with the delivery time, and 78% of all consumers were satisfied with their device, 3% were not satisfied and 19% did not know (yet) whether they were satisfied or not with their device. Of all these “not knowers” (n = 240) more than two-thirds gave a mean rating of ≥8, and 38% had been using their device less than a year.
The percentage of consumers who rated their “experience” of a certain statement equal to or higher than their rating of its “importance” is given for each of the 16 statements
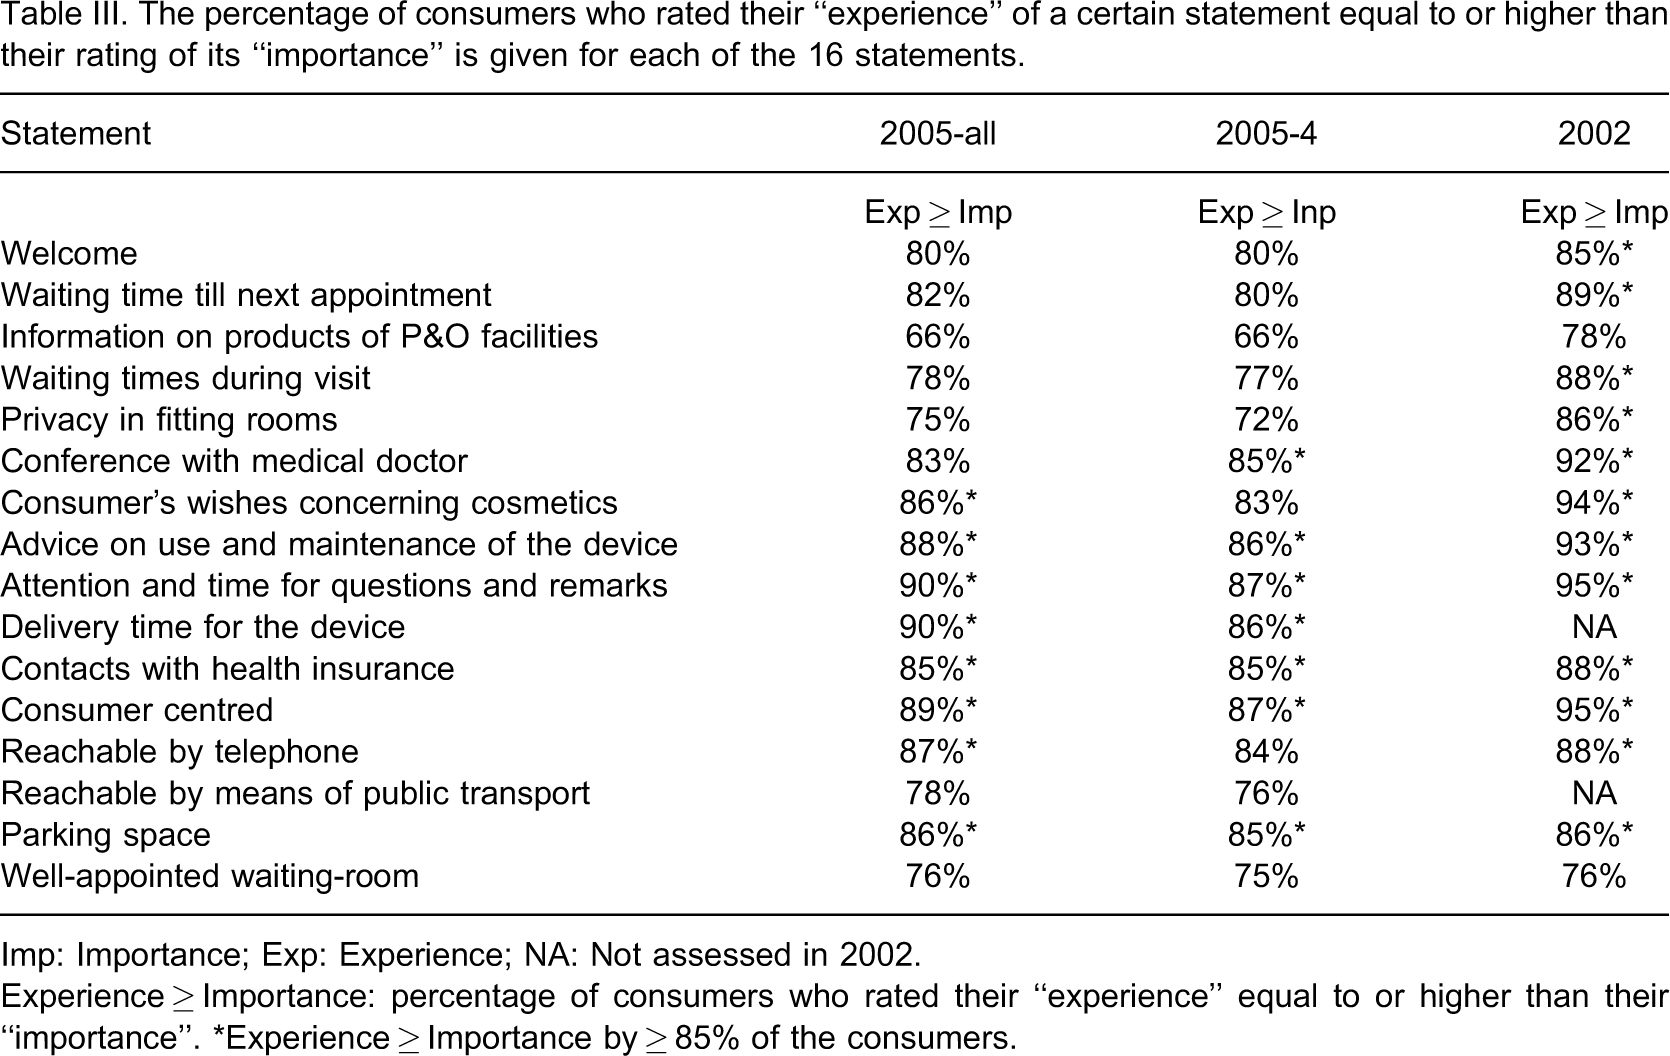
Imp: Importance; Exp: Experience; NA: Not assessed in 2002.
Experience ≥ Importance: percentage of consumers who rated their “experience” equal to or higher than their “importance”. ∗Experience ≥ Importance by ≥ 85% of the consumers.
Discussion
The results of our study show that consumers gave the service provided at P&O facilities a mean rating of 8.1, and that they were generally satisfied both with the product and its delivery time. On the basis of these outcomes, it was expected that more statements on the SERVQUAL would have fulfilled the quality criterion.
As mentioned earlier, no other research regarding consumers' satisfaction with the services of P&O facilities has been published until now. Therefore, the outcomes of this study could only be compared with those of the study of 2002.10 SERVQUAL outcomes were poorer in 2005 compared to those of 2002, while the criterion used for a satisfactory quality was similar to that of 2002. It may be that consumers are becoming more critical about the quality of service, that they are better informed through the internet, or that the quality of service has actually decreased since 2002.
Additionally, other factors not assessed (unknown confounders) may have influenced the differences in the results. Less than 75% of the consumers gave the statement about “Display of products at P&O facilities” a positive rating. This result was against all expectations because, as a result of the outcomes in 2002, the management team took measures to improve these displays.
The overall high ratings of consumers in this study may be attributed to their dependency on their P&O facility.10 However, discrepancies between moderate SERVQUAL outcomes and high consumer ratings have been published previously.19 Several studies evaluating home- and community-based services, found that clients often gave high ratings on survey questions but when specific comments about services were asked, clients also reported serious deficiencies in worker performance, which were not reflected in the overall satisfaction rating.19 It was hypothesized that longer relationship durations lead to changes in the nature of quality assessment because the level of experience and knowledge of the consumers grows, and the complexity of the relationship increases. Consumers have no choice but to accept the service, and also, different service experiences allow the consumers to focus more on the positive aspects of their experience.19 Users of P&O facilities are often long-term care users and they have no other choice of P&O providers. Various methods for overcoming or minimizing this effect mentioned above were recommended, very recently, by proposing modifications of the SERVQUAL to assess quality in a long-term care setting.19
In 2005 a mean overall rating of satisfaction of 8.1 was given by the consumers; this mean overall rating is slightly higher than in 2002. In 2005, consumers of ≥55 years gave a significantly higher rating than the other two age groups. Maybe younger consumers make higher demands on their devices, or are less easily pleased with the service of a P&O facility. The highest rating was given by consumers fitted with a prosthesis. To be able to function, these consumers are greatly dependent on a well fitted prosthesis and hence, highly dependent on their P&O facility, which could be an explanation for a high rating.
It was also striking that 7% (n = 85) of the consumers were not satisfied with the delivery time, while 30% of these dissatisfied consumers gave the facilities a rating of ≥8. The satisfaction with the delivered product shows the same pattern: 3% of the consumers were dissatisfied, while a third of them gave a rating of ≥8. In the 2005-all group 19% of the consumers answered that they did not yet know whether they were satisfied with the delivered product or not. From a management view, it is important to find out why this answer was given. Possibly, the consumers did not have an opinion yet, because they still had not had their device for a very long time, or perhaps they were unwilling or hesitant about giving their opinion, because of being dependent on the P&O facility where they were treated.
At the start of the study the number of participants had been estimated to be 2,375 consumers. A total of 57% of the estimated number of questionnaires was filled out. However, it was not recorded how many consumers visited the P&O facilities during the survey period, and how many questionnaires were ultimately distributed to consumers at each facility. In only 45% of the questionnaires all statements were filled in. If this study is repeated, specific attention needs to be paid to the above mentioned aspects. If, in future, consumers are asked to fill in the questionnaires on the spot, if they are assisted with the filling in, and if the questionnaires are supervised, the percentage of missing data would surely decrease. However, it may prove to be a disadvantage in cases where people do not feel free to give their opinion about the service provided.
From the point of view of the management of P&O facilities consumer satisfaction is economically important. It provides insight into topics that may improve the quality of the services provided.10 However, consumer satisfaction is not only dependent on the service of a P&O facility, but also on the use and the functioning of the device and on the satisfaction with the cosmetics of the device. The SERVQUAL lacks assessment of these issues, so we would recommend the use of a more extensive questionnaire in future. Several questionnaires have been developed with a focus on consumers with a prosthesis.6-8 The Prosthesis Evaluation Questionnaire (PEQ), was developed by Legro et al.,6 to be used for the evaluation of the effects of different types of prostheses or different methods of care. The Trinity Amputation and Prosthesis Experience Scales (TAPES) were developed by Gallagher and MacLachlan,8 to be used in the context of a multidimensional assessment of adjustment to a prosthetic limb. The Orthotics and Prosthetics Users' Survey (OPUS) was developed by Heinemann et al.,7 to evaluate the quality and effectiveness of the services provided by orthotics and prosthetics practices. Unfortunately, the results acquired from these questionnaires cannot easily be compared to our results, because different questions were asked, and different scales were used to weigh the answers to similar questions.
In future, it is important to continue to focus on consumer satisfaction by keeping in touch with the experiences and interests of consumers, in order to improve the quality of P&O services in daily practice. Additionally, more national and international collaboration with other research groups is required in order to develop a specific questionnaire to measure all aspects of prosthetic and orthotic care with the aim to improve the quality of the services.
Conclusion
The outcomes on the SERVQUAL are moderate. The overall consumer rating of the service provided by P&O facilities is high and people are satisfied with the product delivered and with the delivery time. To improve the services, development of a questionnaire to measure all aspects of prosthetic and orthotic care is recommended.
Footnotes
Acknowledgements
We thank the consumers of the OIM-group for their active participation in this survey.
Appendix: Questionnaire
1. The P&O facility staff give me the feeling that I am always welcome.
2. The prosthesist/orthotist/orthopaedic shoe technician is always willing to see me at short notice.
3. At the P&O facility there is a display in the hall or waiting room giving information on its products and services.
4. Waiting times during my visit to a P&O facility are short.
5. The fitting rooms and the training space offer good privacy.
6. The prosthesist/orthotist/orthopaedic shoe technician regularly confers with my medical doctor.
7. The prosthesist/orthotist/orthopaedic shoe technician respects my wishes concerning the appearance of the device.
8. The prosthesist/orthotist/orthopaedic shoe technician gives me clear advice on the use and maintenance of the device.
9. The P&O facility staff take my questions and remarks seriously.
10. The P&O facility delivers as agreed.
11. The P&O facility takes care of the contacts with my health insurance.
12. The P&O facility staff put my interests first.
13. The P&O facility is easy to reach by telephone.
14. The P&O facility is easy to reach by means of public transport.
15. The P&O facility offers enough parking space.
16. The P&O facility features a well-appointed waiting-room.
Finally, we should like to obtain some extra information from you.
How long have you already used an orthopaedic device? … . . years
Are you satisfied with our delivery time? Yes/no
Are you satisfied with the delivered product? Yes/no/don't know
What is your sex? Male/female
What is your age? … . years old
Which rating do you give the service of the P&O facility on the whole, on a scale from 1 to 10?
Please circle the number you think appropriate.
1 2 3 4 5 6 7 8 9 10
Should you have any suggestions or remarks that might improve our service, you may enter these here below.
Thank you very much for your cooperation.