
Abstract
Foot orthotic treatment is one of the major conservative methods used to handle foot problems. Total plantar contact foot orthoses are used to reduce and redistribute peak pressures. For the fabrication of a total plantar contact foot orthosis, the computer-aided design and computer-aided manufacturing (CAD-CAM) method has been applied. In this study, the plantar foot-orthosis interface pressure data during walking were collected by the Novel Pedar-mobile in-shoe plantar pressure measuring system. The data were collected under three conditions: (i) Flat insole, (ii) foot orthosis provided by the CAD-CAM method, and (iii) foot orthosis provided by the foam impression method. The Swiss Comfort CAD-CAM foot orthotics system was used in this study. For conditions (ii) and (iii), foot shapes were collected in partial weight bearing and subtalar neutral conditions. Thirty normal subjects were recruited for this study. The plantar foot surface was divided into eight plantar foot regions and then was investigated. These regions included the heel, the medial and lateral arches, the medial, mid and lateral forefoot, the hallux, and the lateral toes. The results showed that the orthoses provided by both the CAD-CAM and foam impression methods could decrease the peak pressure and the maximum force in the heel region, and increase the peak pressure and the maximum force in the medial arch region. Both orthoses redistributed the peak pressure and the maximum force from the heel to the medial arch region. The peak pressure in the mid forefoot region was different between the orthoses provided by the CAD-CAM and foam impression methods.
Introduction
Foot orthoses together with appropriate footwear are commonly used in the treatment of various foot and foot-related problems. There are different designs of foot orthoses which are made with materials of different densities. The functions of foot orthoses include the following: (i) Redirection of forces passing through the foot structure, (ii) increase of total contact area, and (iii) redistribution of the interface pressure between the foot and the orthoses. Foot orthoses can be divided into two basic categories: Corrective and accommodative. They can be used to relieve pain, increase heel cushion, correct flexible deformity, increase foot stability, or prevent skin breakdowns such as ulcerations. In clinical practice, plantar pressure measurement has been used to evaluate foot deformities such as flatfoot, clubfoot, hallux valgus, plantar fasciitis, callus formation, and foot ulcers, especially for those patients with diabetes mellitus. Atypical amount or pattern of loading may reflect systemic or localized lower-extremity pathology and may serve as an indicator or a predictor of further pathology or worsening of the existing pathology (Orlin and McPoil 2000).
Normative data are required to furnish a basis for comparison between normal and abnormal conditions. Investigators tried to measure the normal plantar pressure values of different age groups with different measuring systems (Soames 1985; Bennett and Duplock 1993; Chen et al. 2001; Liu et al. 2005). The data most often collected were those for barefoot walking. Bryant et al. (2000) used the EMED-SF measuring system and applied a two-step recording technique to measure the barefoot data in 30 healthy subjects. The normal ranges of peak pressure, mean pressure, and pressure-time integral were reported. They found that the pressure values at the heel and the second and third metatarsal heads have the smallest standard deviations, which thus suggested that the heel and the central forefoot regions were functionally the most stable areas of the foot during the stance. On the other hand, the mid foot, the fifth metatarsal, and the lesser toes demonstrated the greatest variations. The highest mean values were found under the heel, the second and third metatarsal heads, and the hallux.
Total plantar contact foot orthosis is one of the most commonly used orthoses for patients with structural foot deformities and neuropathic foot problems such as plantar fasciitis, hallux valgus, and diabetic feet. The orthosis is usually applied to redistribute and reduce plantar pressure under the heel and the metatarsal regions (McPoil and Cornwall 1992; Brown et al. 1996). Three types of foot shape collection methods are used for the provision of a custom-made foot orthosis. These include: (i) The digitizing or scanning approach of computer-aided design and computer-aided manufacturing (CAD-CAM) methods, (ii) partial weight bearing foam impression, and (iii) non-weight bearing impression or casting. Although the second and third approaches are still commonly used, the CAD-CAM method is increasingly gaining popularity. The first CAD-CAM system for the production of orthoses was the Orthocan system and was introduced in 1988 by the American Digital Technology. The second system was released by the Ammon Production system through Ammon Corporation and was manufactured by the Bergmann Orthotic Laboratory. Digitizing technology was used to capture and manipulate the contoured surface of the foot and the orthoses in both systems (Grumbine 1993).
The custom-molded shape rather than the material stiffness of insoles is more important in reducing peak pressure (Cheung and Zhang 2005). Effect of foot impression methods on mould shape and plantar pressure were compared (Laughton et al. 2002; Chen et al. 2003; Guldemond et al. 2006). However, there is no literature to support that CAD-CAM provides orthosis and offers better function to patients as compared to the traditional means. The aim of this study was to compare the plantar pressure distribution patterns between foot orthoses that were generated by the foam impression method and those by the CAD-CAM method. The results of the study can provide additional reference for the provision of appropriate orthotic intervention for different foot conditions.
Methodology
Subjects
Thirty subjects, five males and 25 females with no static foot deformity, no painful foot condition, and with an arch index (AI) (Cavanagh and Rodgers 1987) within the normal range (0.21 < AI < 0.26), were recruited from a local hospital. They were also required to give their informed consent before participating in this study, which was approved by the Research Ethics Committee of the Hong Kong Hospital Authority. The average age of the subjects was 36.1 years (age range 22–55, SD = 10.5). Their average height was 1.6 m (range 1.50–1.76 m, SD = 7.8), and their average weight was 56.4 kg (range 44.0–71.8 kg, SD = 10.1). The Body Mass Index of all subjects was normal.
Provision of orthoses
Foot shape of each subject was taken by the phenolic foam impression method and the CAD-CAM method in the partial weight bearing condition. The Swiss Comfort CAD-CAM Foot Orthotics System (Otto Bock Orthopedic Industry, Germany) consists of: An assessment stand with 24 spring-loaded sensor heads (Figure 1), a carver with a vacuum system and a computer with the ComfortSpline software. The 24 sensor heads (Figure 2) are used to digitize the contour of the plantar foot surface. The digitized image of the foot is limited to a length of 320 mm, width of 115 mm, and height of 30 mm.
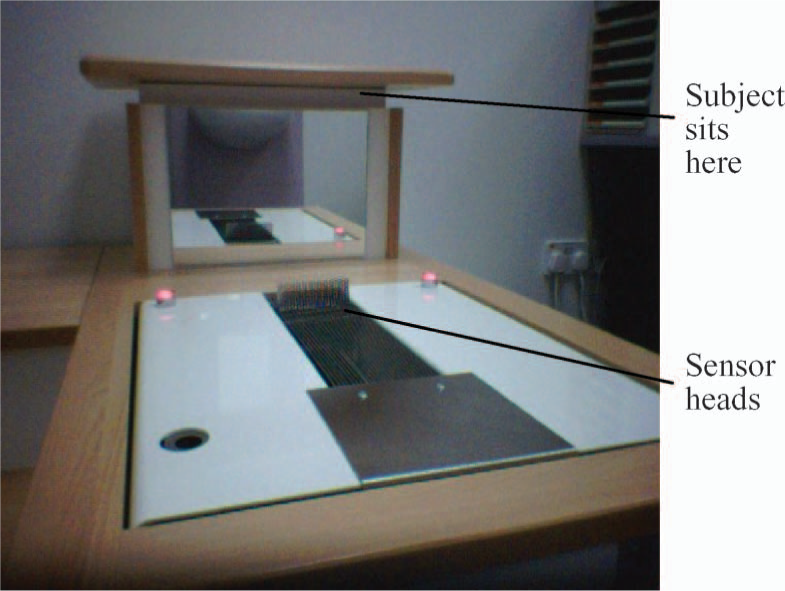
The assessment stand.
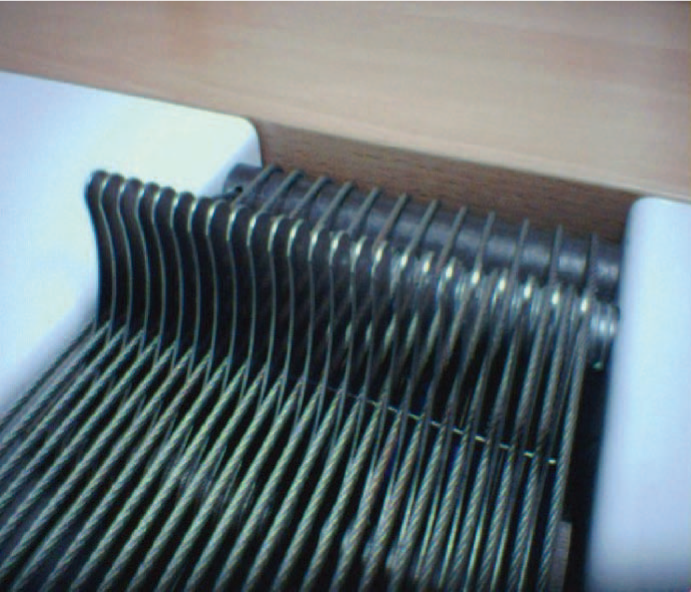
Close view of the sensor heads.
In the phenolic foam impression method, the subject was instructed to sit on a firm chair with hip, knee and ankle in 90° and the subtalar joint in its neutral position. The subject's foot was then pressed towards the foam until the most medial point of the medial longitudinal arch area immersed into the foam material. The foam impression was used for the vacuum forming of foot orthosis. In the CAD-CAM method, the subject was also instructed to sit on the assessment stand with the hip, knee and ankle in 90° and the subtalar joint in its neutral position. The foot was aligned to the direction of movement of the sensor heads. The sensor heads moved forward from the subject's heel to toes to capture the plantar foot contour. The digitized image was transferred to the computer system for the carving of the foot orthosis. All orthoses were made with 30° shore A foam plastics.
Plantar foot pressure measurement
The plantar foot pressure data were collected with the Novel PEDAR-mobile (Novel Gmbh, Munich, Germany) in-shoe plantar pressure measuring system. The system consists of: (i) Pressure sensing insoles, (ii) a Pedar insole cable, (iii) a Pedar-mobile box (175 × 104 × 44, 850 g), and (iv) a computer. There are four different sizes of insole sensors. Each insole is 2.6 mm thick and has 99 capacitance transducers. The sampling frequency was 50 Hz, and calibration was carried out following the procedures and methods recommended by the manufacturer before data collection. Foot orthoses in combination with standardized laced shoes with 1 cm heel height were fitted to the subjects. The Pedar-m online software was used for the online plantar pressure capture. The subject was then instructed to walk straight according to his or her own walking speed along a 10 m pathway, and the pressure data were captured and saved in the computer. Each trial contained more than 10 steps. Three successful trials were taken for each condition, and the sequence of the conditions for data collection was randomly designed. The plantar pressure distribution patterns among foot orthoses provided by the CAD-CAM approach, the foam impression approach, and the flat insole were compared. The foot was divided into eight regions. Peak pressure, maximum force, pressure-time integral, and contact area were studied.
Data analysis
In each trial, the first and the last step were disregarded. Then three steps of the right foot were selected and averaged to examine the effect of the orthoses. Data on maximum peak pressure, maximum force, pressure-time integral, and contact area were collected. The Pedar multi-mask evaluation software was used to divide the foot in eight regions: Heel, medial arch, lateral arch, medial forefoot, mid forefoot, lateral forefoot, big toe, and lateral toes. The data on the desired parameters of the three trials for each subject were averaged for analysis. SPSS statistical software (version 11.0; SPSS Science, Chicago, Illinois, USA) was used for data analysis. One-way ANOVA tests, followed by a post hoc Tukey test corrected for multiple comparisons, were performed to examine the effects of the three orthotic conditions on maximum peak pressure, maximum force, pressure-time integral, and contact area.
Results and discussion
The results showed that both the total plantar contact foot orthoses provided by the CAD-CAM and foam impression approaches could redistribute peak pressure (Figure 3) and maximum force (Figure 4) from the heel to the medial arch region.
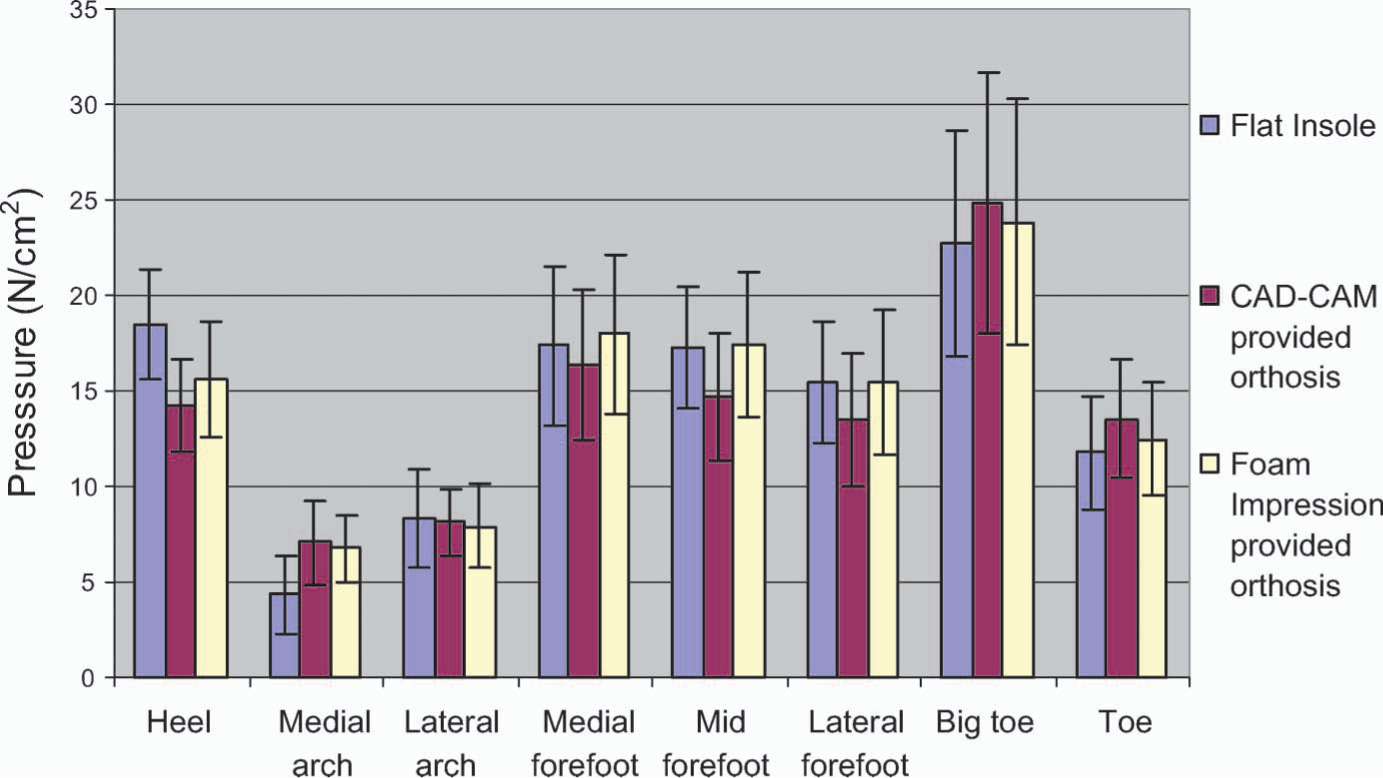
Peak pressure of the eight foot regions.
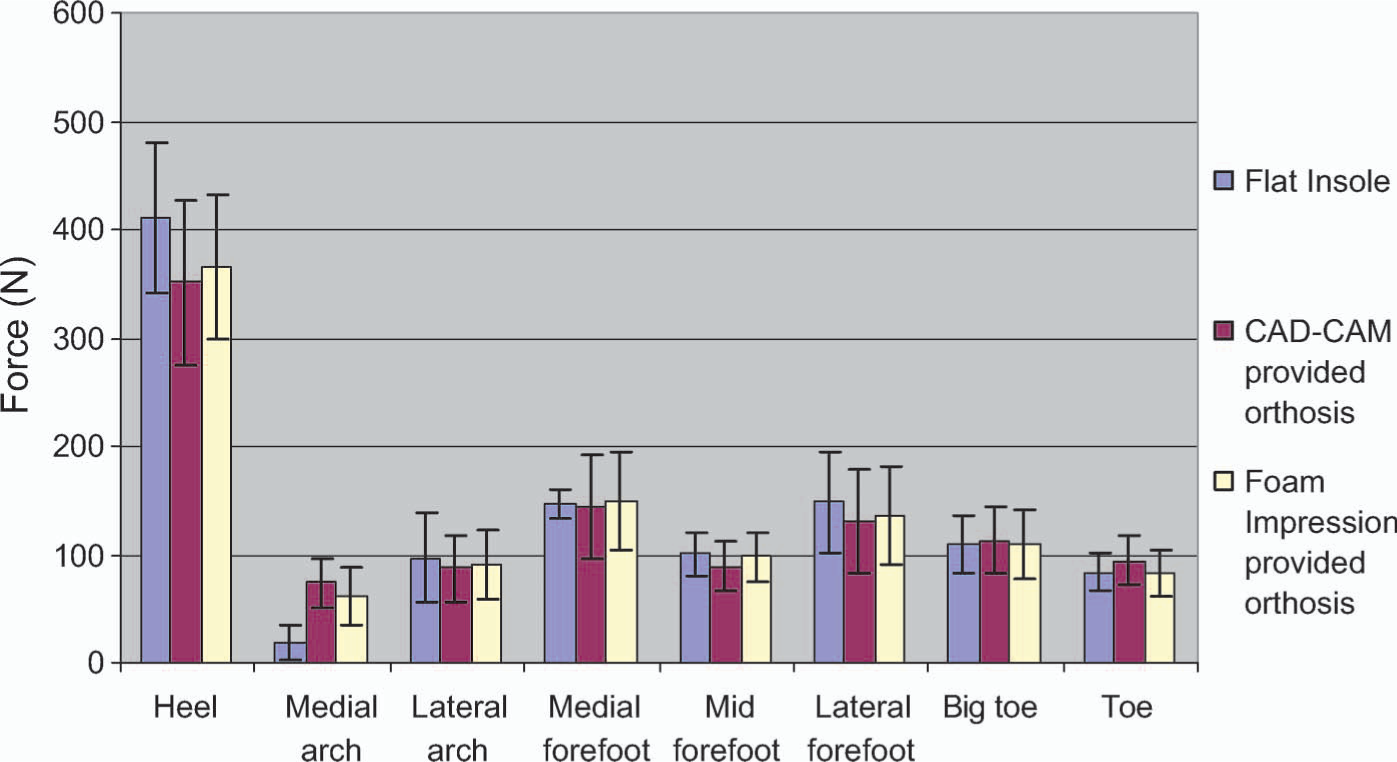
Maximum force of the eight foot regions.
The total plantar contact foot orthoses provided more even foot support and decreased heel pressure. Moreover, the results of the one-way ANOVA followed by the post hoc test corrected for multiple comparisons showed that as compared to the flat insole, the orthoses provided by the CAD-CAM and foam impression methods had a significant lower peak pressure (p = 0.000) and maximum force (p = 0.000) at the heel during heel strike to mid-stance in the walking gait cycle. The CAD-CAM and the foam impression-provided orthoses also had significant higher peak pressure (p = 0.004) and maximum force (p = 0.000) at the medial arch region. Particularly, the CAD-CAM provided orthosis supported the transverse arch and had the lowest pressure at the mid forefoot during the push-off phase of gait. In the mid forefoot region, the CAD-CAM-provided orthosis had a significant higher peak pressure (14.74 N/cm2 ± 3.33 N/cm2) (p = 0.010) than the foam impression provided orthosis (17.40 N/cm2 ± 3.76 N/cm2). During shape collection in the foam impression method, compression force was applied on the dorsum of the mid foot to prevent the supination of the mid-tarsal joint due to the reaction force by the foam box. On the other hand, the foot shape was digitized without compression force applied in the CAD-CAM process. In the partial weight bearing foam impression method, the transverse arches on the subjects' forefoot were collapsed while compression force was applied. A more natural metatarsal support was provided by the CAD-CAM-provided orthosis.
During the push-off phase, the CAD-CAM and the foam impression-provided orthoses had significantly larger pressure time integrals (p = 0.000) at the medial arch region than in the flat insole (Figure 5). The CAD-CAM provided orthosis had a significantly larger contact area in the medial arch region, than the foam impression-provided orthosis (Figure 6). The medial arch support of the total plantar contact foot orthoses contributed to the increase of the pressure-time integral. In the mid forefoot region, the CAD-CAM provided orthosis had the lowest pressure-time integral. In the studied CAD-CAM approach, the plantar foot contour was collected by the spring loaded sensor heads. However, there was no information about how much spring loading was applied. The captured foot image might be varied with various spring loading. Further study should include the effect of various loading conditions.
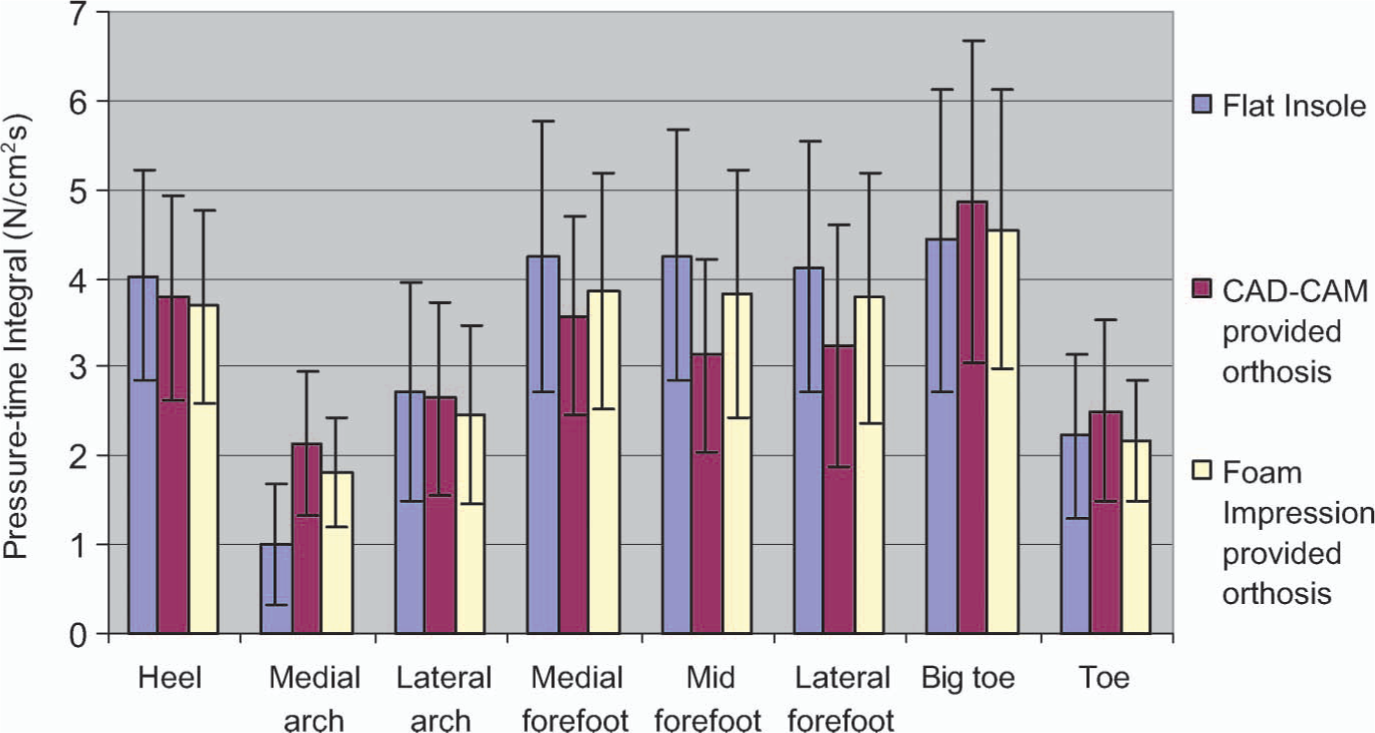
Pressure-time integral of the eight foot regions.
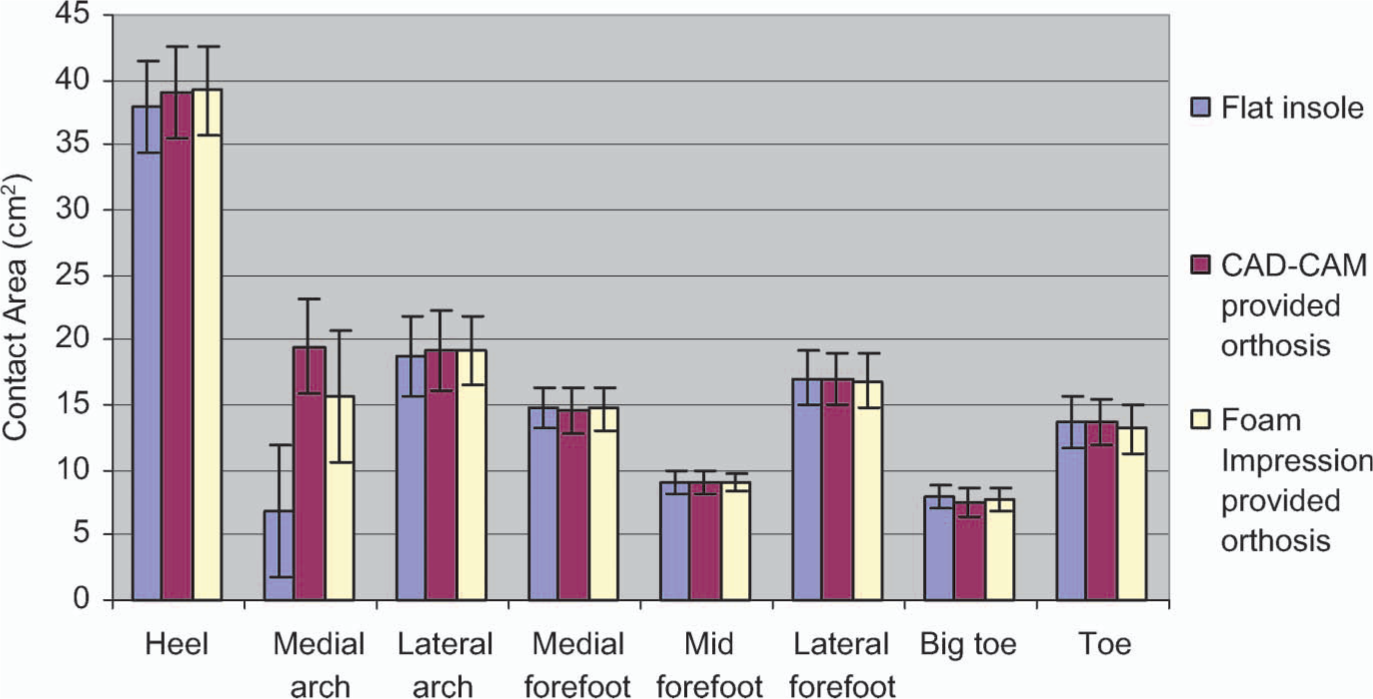
Contact area of the eight foot regions.
Conclusion
The plantar pressure distribution patterns among foot orthoses provided by CAD-CAM and foam impression methods, as well as the flat insole method, were compared in this study. The foot was divided into eight regions which include the heel, the medial and lateral mid-foot, the medial, mid and lateral forefoot, the hallux, and the lateral toes for analysis. Peak pressure, maximum force, pressure-time integral, and contact area were studied. The results showed that total plantar contact foot orthoses provided by both CAD-CAM and foam impression approaches redistributed the peak pressure and the maximum force from the heel to the medial mid-foot area from heel strike to mid-stance phase. The peak pressure and the pressure-time integral in the mid forefoot regions were lower in the CAD-CAM approach than in the foam impression approach. The CAD-CAM system provided a pressure distribution pattern, with the exception of the mid forefoot region, similar to the one provided by the foam impression method.