
Abstract
A cross-sectional study was conducted to investigate the foot arch function of Chinese children. A total of 2715 children, 1246 girls, and 1369 boys, 4–18 years of age were recruited from kindergartens, primary, and secondary schools. The dynamic footprints of the children were collected using a portable pressure-sensing mat. The Contact Force Ratio (CFR, i.e. the ratio of the mid-foot loading to the total loading of the contacted foot, with the toes ignored) of each age group was calculated. In general, the CFR decreased from 4 to 10 years and plateaued at 10–12 years and then increased until 15–16 years. An abnormal low arch foot was defined as the foot that had a CFR value larger than the corresponding age mean plus one standard deviation. The cut-off CFR values of each age group were calculated. With the exception of the 17 years age group, which consisted of a relatively small number of subjects, the percentage of low arch subjects of all the other age groups ranged from 15 to 20%.
Introduction and objective
Investigators have worked on inked static footprints to quantify arch height. Conflicting results have been reported on the reliability of these parameters for the prediction of arch height (Cobey and Sella 1981; Hamill et al. 1989; Hawes et al. 1992; McCrory et al. 1997). Dynamic footprints can be collected by pedobarographs and electronic pressure-sensing mats (Abboud and Rowley 1996). The footprint parameters incorporating plantar pressure information have been reported as highly reliable and correlated with arch height (Chu et al. 1995; Shiang et al. 1998).
Footprint parameters were used to investigate the development of the foot arch. Staheli et al. (1987) studied Staheli's Arch Index, the ratio of the width of the foot in the area of the arch to the width of the heel, of 186 males and 255 females aged 1–80 years. The normal value during infancy ranged from 0.70 to 1.35. After the middle child, the normal range was 0.3–1.0. Forriol and Pascual (1990) analysed the footprints of 1676 schoolchildren (1013 girls and 663 boys) aged 3–17 years. The Arch Angle (Clarke 1933), which is formed between the line connecting the most medial point of the heel and the metatarsal regions and the slope of the inner segment of the longitudinal arch, and the Chippaux – Smirak Index, which is the ratio of the maximum width of the metatarsal region to the minimal width of the arch region, were examined. The Arch Angle significantly increased, and the Chippaux – Smirak Index significantly decreased from age 3–4 years to age 5–8 years and then to 9–11 years in both sexes and both feet. In general, there was a tendency in both sexes in early childhood to present with flat foot morphology until the age of 5 and 6 years. Volpon (1994) also suggested that the major development in the medial arch occurred between 2 and 6 years of age.
Craxford et al. (1984) recorded the plantar pressures of 100 children between the ages of 15 months and 13 years. They reported that the overall percentage of flat feet decreased with increase in age. Hennig et al. (1994) investigated the plantar pressure distribution patterns of young schoolchildren in comparison with adults. With increasing age, a medial load shift in the forefoot was observed. There was no reduction in pressures under the longitudinal arch with an increase in age. The group suggested that foot-arch development was almost completed before the age of 6 years.
The calcaneal valgus deviation in early children is often associated with a generalized increase in ligamentous laxity (Carter and Wilkinson 1964). In Edinburgh, 50% of children were lax at age 3 years, 5% at age 6 years, and 1% at age 12 years (Walker 1994). For the Chinese children, 100% were lax at age 3 years, whereas at age 6 years and 12 years, the percentage decreased to 67% and 28%, respectively (Cheng et al. 1991). It is therefore reasonable to expect the appearance of flexible flat foot as a more common condition in the Chinese population.
The footprint analyses mentioned above were all based on the accumulated plantar images during a complete step or in static standing. These footprints displayed the peak pressure values recorded by individual sensors. A new parameter, Contact Force Ratio (CFR), was derived from dynamic footprint to reflect foot arch function rather than appearance only (Leung et al. 2004b). The parameter is based on the normalization of mid-foot loading to the total loading of the foot contact area, with toes ignored, just before the heel off instant. The higher the CFR value, the higher the mid-foot loading and the lower the arch. The CFR had a good correlation (r = 0.785) to the navicular drop. Results of Intraclass Correlation Coefficient (ICC) tests showed that the CFR had good intratester (0.918) and intertester (0.909) reliability.
Orthotic interventions for a flexible flat foot have also been reported in both positive (Basta et al. 1977; Bleck and Berzin 1977; Bordelon 1980, 1983; Kuhn et al. 1999; Leung et al. 1998; Mereday et al. 1972; Theologis et al. 1994) and negative (Coll et al. 2001; Gould et al. 1989; Kanatli et al. 2001; Penneau et al. 1982; Wenger et al. 1989) results. The controversy may be due to the variations in the definition and selection of parameters for comparison and lack of control in the provision of the orthotic management. The authors have suggested the appropriate orthotic design to control foot alignment (Leung et al. 2004a). The information generated from this study will be useful to conduct further studies to differentiate the abnormal group from the normal variance and to evaluate the effect of orthotic intervention on foot arch function.
The objective of this study was to conduct a cross-sectional study on the development of foot arch function of the Chinese children. The specific tasks included: (1) measuring body weight and foot length; (2) collecting dynamic footprint; (3) calculating the CFR; and (4) analysing the data and suggesting cut-off CFR values for the classification of an abnormally low arch foot for each age group.
Methodology
Subjects
A total of 2715 Chinese schoolchildren, 1346 girls and 1369 boys, 4–18 years of age were recruited from different kindergartens, primary, and secondary schools. Children with any physical abnormalities or known medical or orthopaedic diseases were excluded from the study. Signed consent forms were collected from the parents.
Equipment and methods
Body weight was measured without shoes with the subject standing on the platform of the Harpenden Stadiometer (Holtain Ltd, Crosswell, Crymmych, UK). A digital foot-measurement device (Figure 1) was used to measure the foot length along the long axis of the foot (Cheng et al. 1997). The subject was asked to stand up and bear weight evenly on both feet. All readings were taken to the nearest 0.1 cm.
The Tekscan High Resolution pressure-sensing mat was used to collect dynamic footprints for the calculation of CFR (Leung et al. 2004b). The pressure-sensing mat was placed at the middle of a 10-m-long walk path (Figure 2) temporarily set up in the schools, which participated in the study. The mid-gait footprint collection method (Wearing et al. 1999) was applied. Each subject was asked to walk barefoot at their normal speed and to land their foot on the pressure mat naturally. When the subject's foot failed to land completely on the mat, the data-collection trial was repeated. Data were collected at a frequency of 50 Hz. A noise threshold was set to 2 (a value between 0 and 255 raw units, which is the recording range of the system) to reduce the presence of noise on the recordings. Digital output values that were equal to or below the threshold were set to zero by the software, thereby filtering out any unwanted low-level force readings (noise).
Statistical analysis
All measurements were summarized as means and standard deviations and then grouped by subjects' gender and age. Two-way ANOVA tests were performed to evaluate the effects of gender and age on the measured variables. Post hoc multiple-comparison tests were performed to determine whether the change with age was statistically significant or not. The significance level was set at P < 0.05.
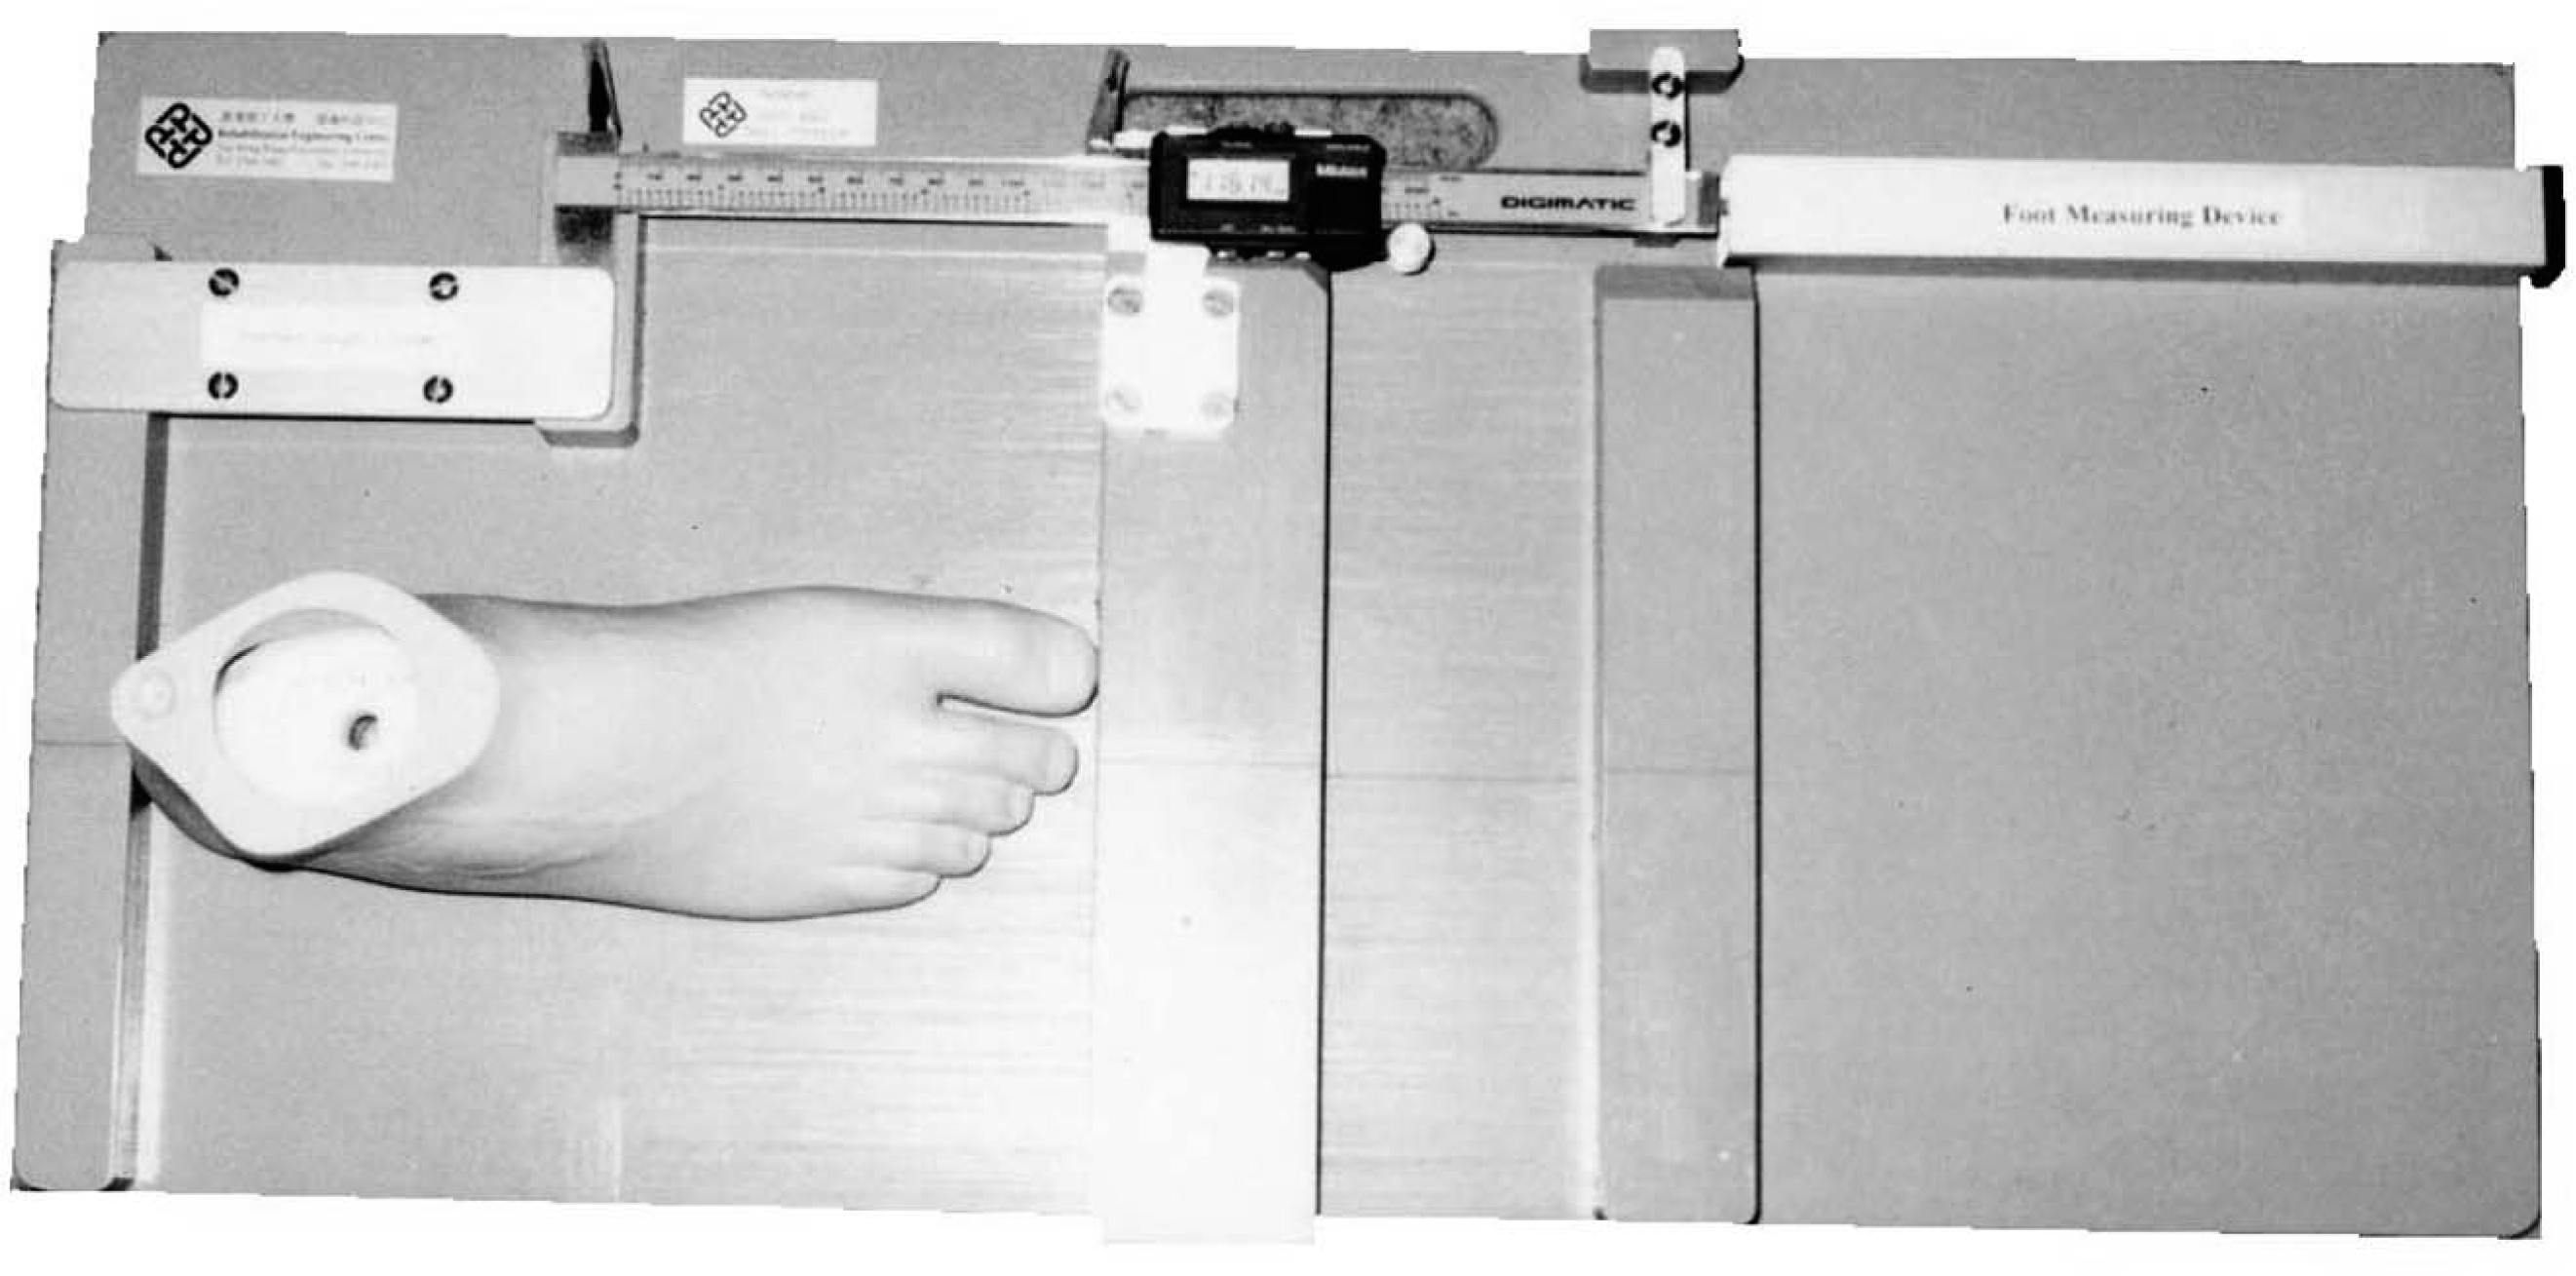
Digital foot-measurement device.

Subject preparing to walk towards the pedobarograph.
Results and discussions
There were 2715 schoolchildren, 1369 boys and 1346 girls, 4–18 years of age. The numbers of subjects in relation to age and sex are summarized in Figure 3.
Body weight
The mean body weight of all subjects is shown in Figure 4. The body weight in girls increased from a mean value of 16.1 kg at the age of 4 years to 50.2 kg at the age of 18 years. The changes when plotted in graphic format showed an increase in body weight from 4 years until age 15 years and then a gradual increase to age 16 years, where it plateaued. In boys, the mean body weight increased from 16.3 kg at the age of 4 years to 64.3 kg at the age of 18 years. There was an increase in body weight from 4 years until age 16 years and then a gradual increase to age 17 years where it plateaued. Results of two-way ANOVA showed a significant effect of age on body weight in both sexes (P < 0.0001). There was also a significant difference in weight between girls and boys (P < 0.0001). The results of Bonferroni post-tests showed that there was significant difference between matched age groups of girls and boys at 16 and 18 years (P < 0.05).
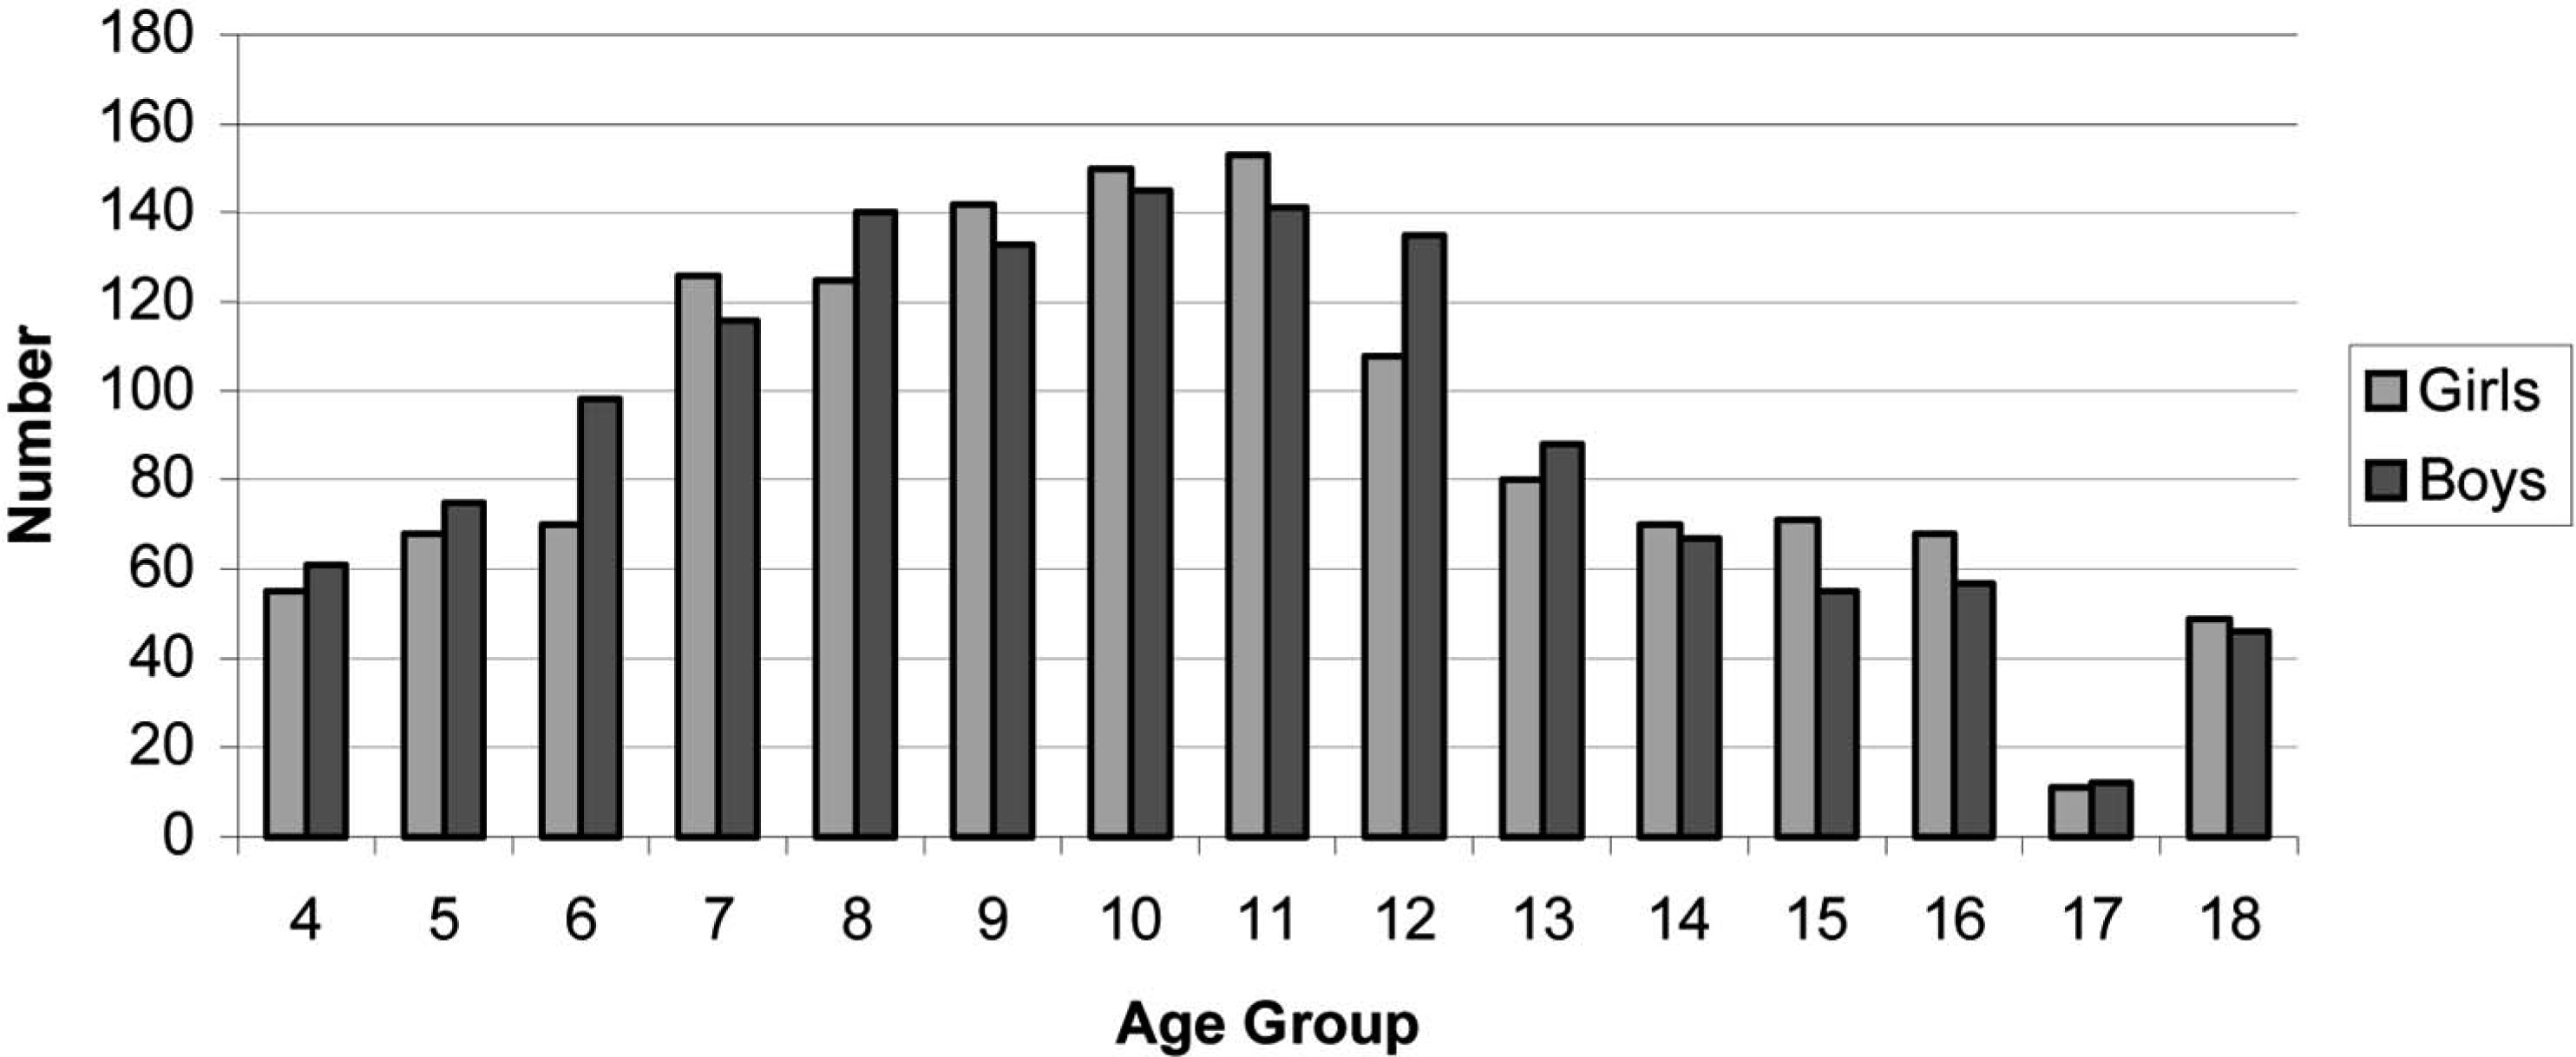
Number of subjects.
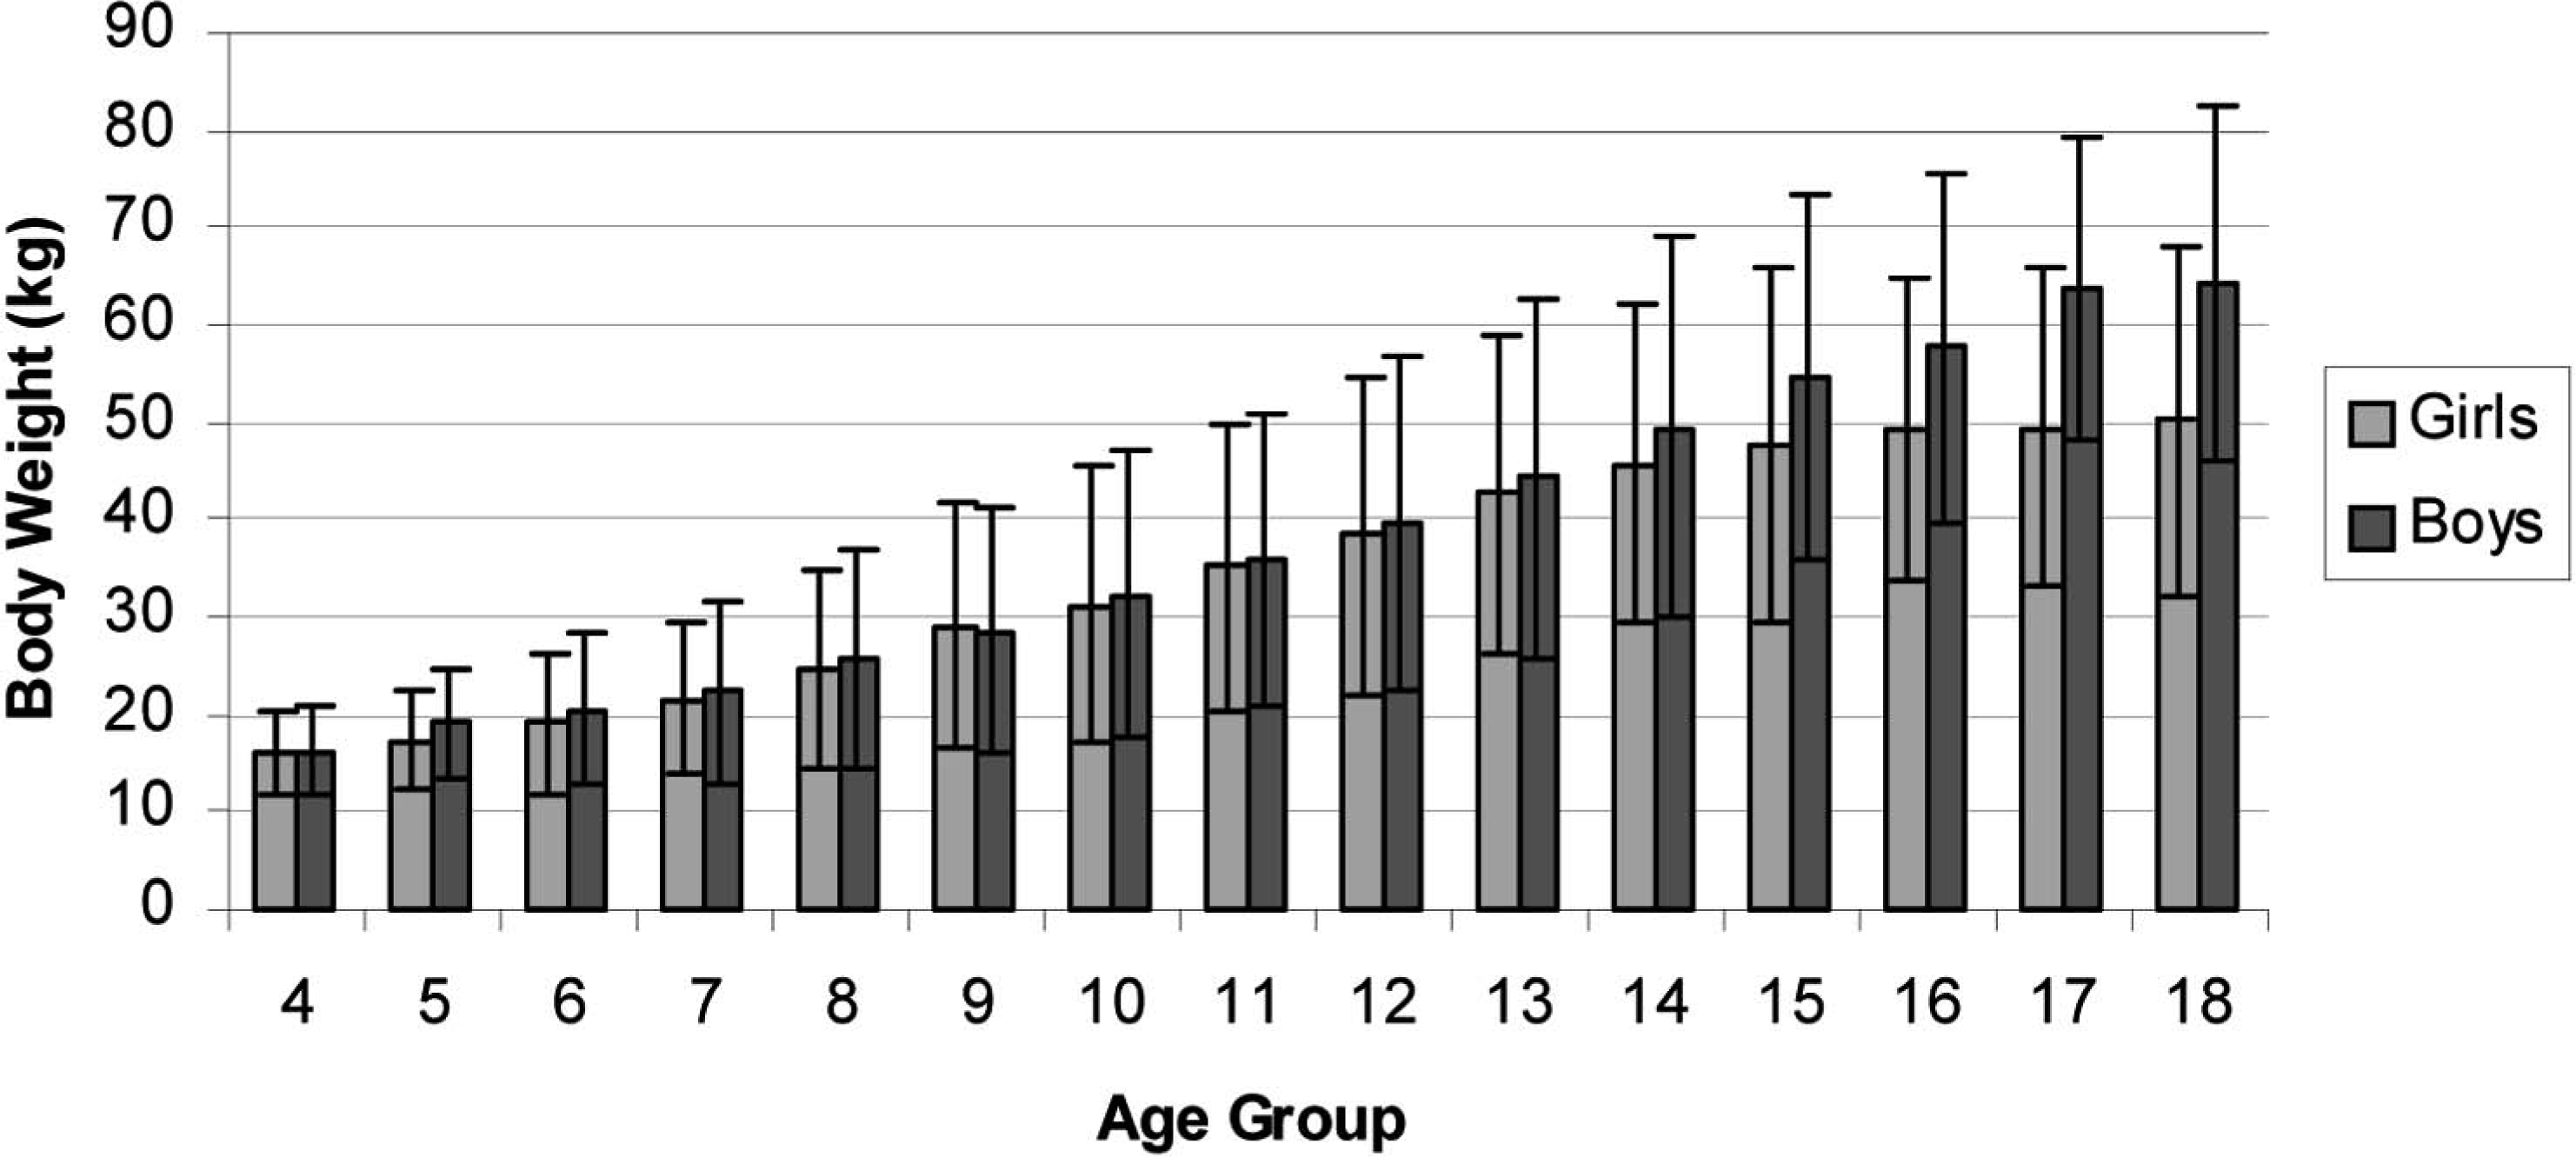
Mean body weight of all age groups.
Weight-bearing foot length
The measurements of the weight-bearing foot length of the left foot and right foot in girls are summarized in Figure 5. The difference ranged from 0.5 to 3.8 mm. The left foot length increased from a mean value of 156.31 mm at the age of 4 years to approximately 230.2 mm at the age of 18 years. The right foot length increased from a mean value of 160.05 mm at the age of 4 years to approximately 230.7 mm at the age of 18 years. The results of a two-way ANOVA did not show any significant difference between the left and right feet in girls (P = 0.5888). The effect of age on foot length was significant in girls (P < 0.0001). The results of Bonferroni post-tests showed no significant difference (P > 0.05) between matched age groups.
In boys, the measurements of weight-bearing foot length of the left foot and right foot are summarized in Figure 6. The difference ranged from 1.3 to 3.9 mm. The left foot length increased from a mean value of 163.77 mm at the age of 4 years to approximately 257.81 mm at the age of 18 years. The right foot length increased from a mean value of 167.63 mm at the age of 4 years to approximately 259.1 mm at the age of 18 years. The results of a two-way ANOVA did not show any significant difference between the left and right feet in boys (P = 0.9863). The effect of age on foot length was significant in boys (P < 0.0001). The results of Bonferroni post-tests showed no significant difference (P 4 0.05) between matched age groups.
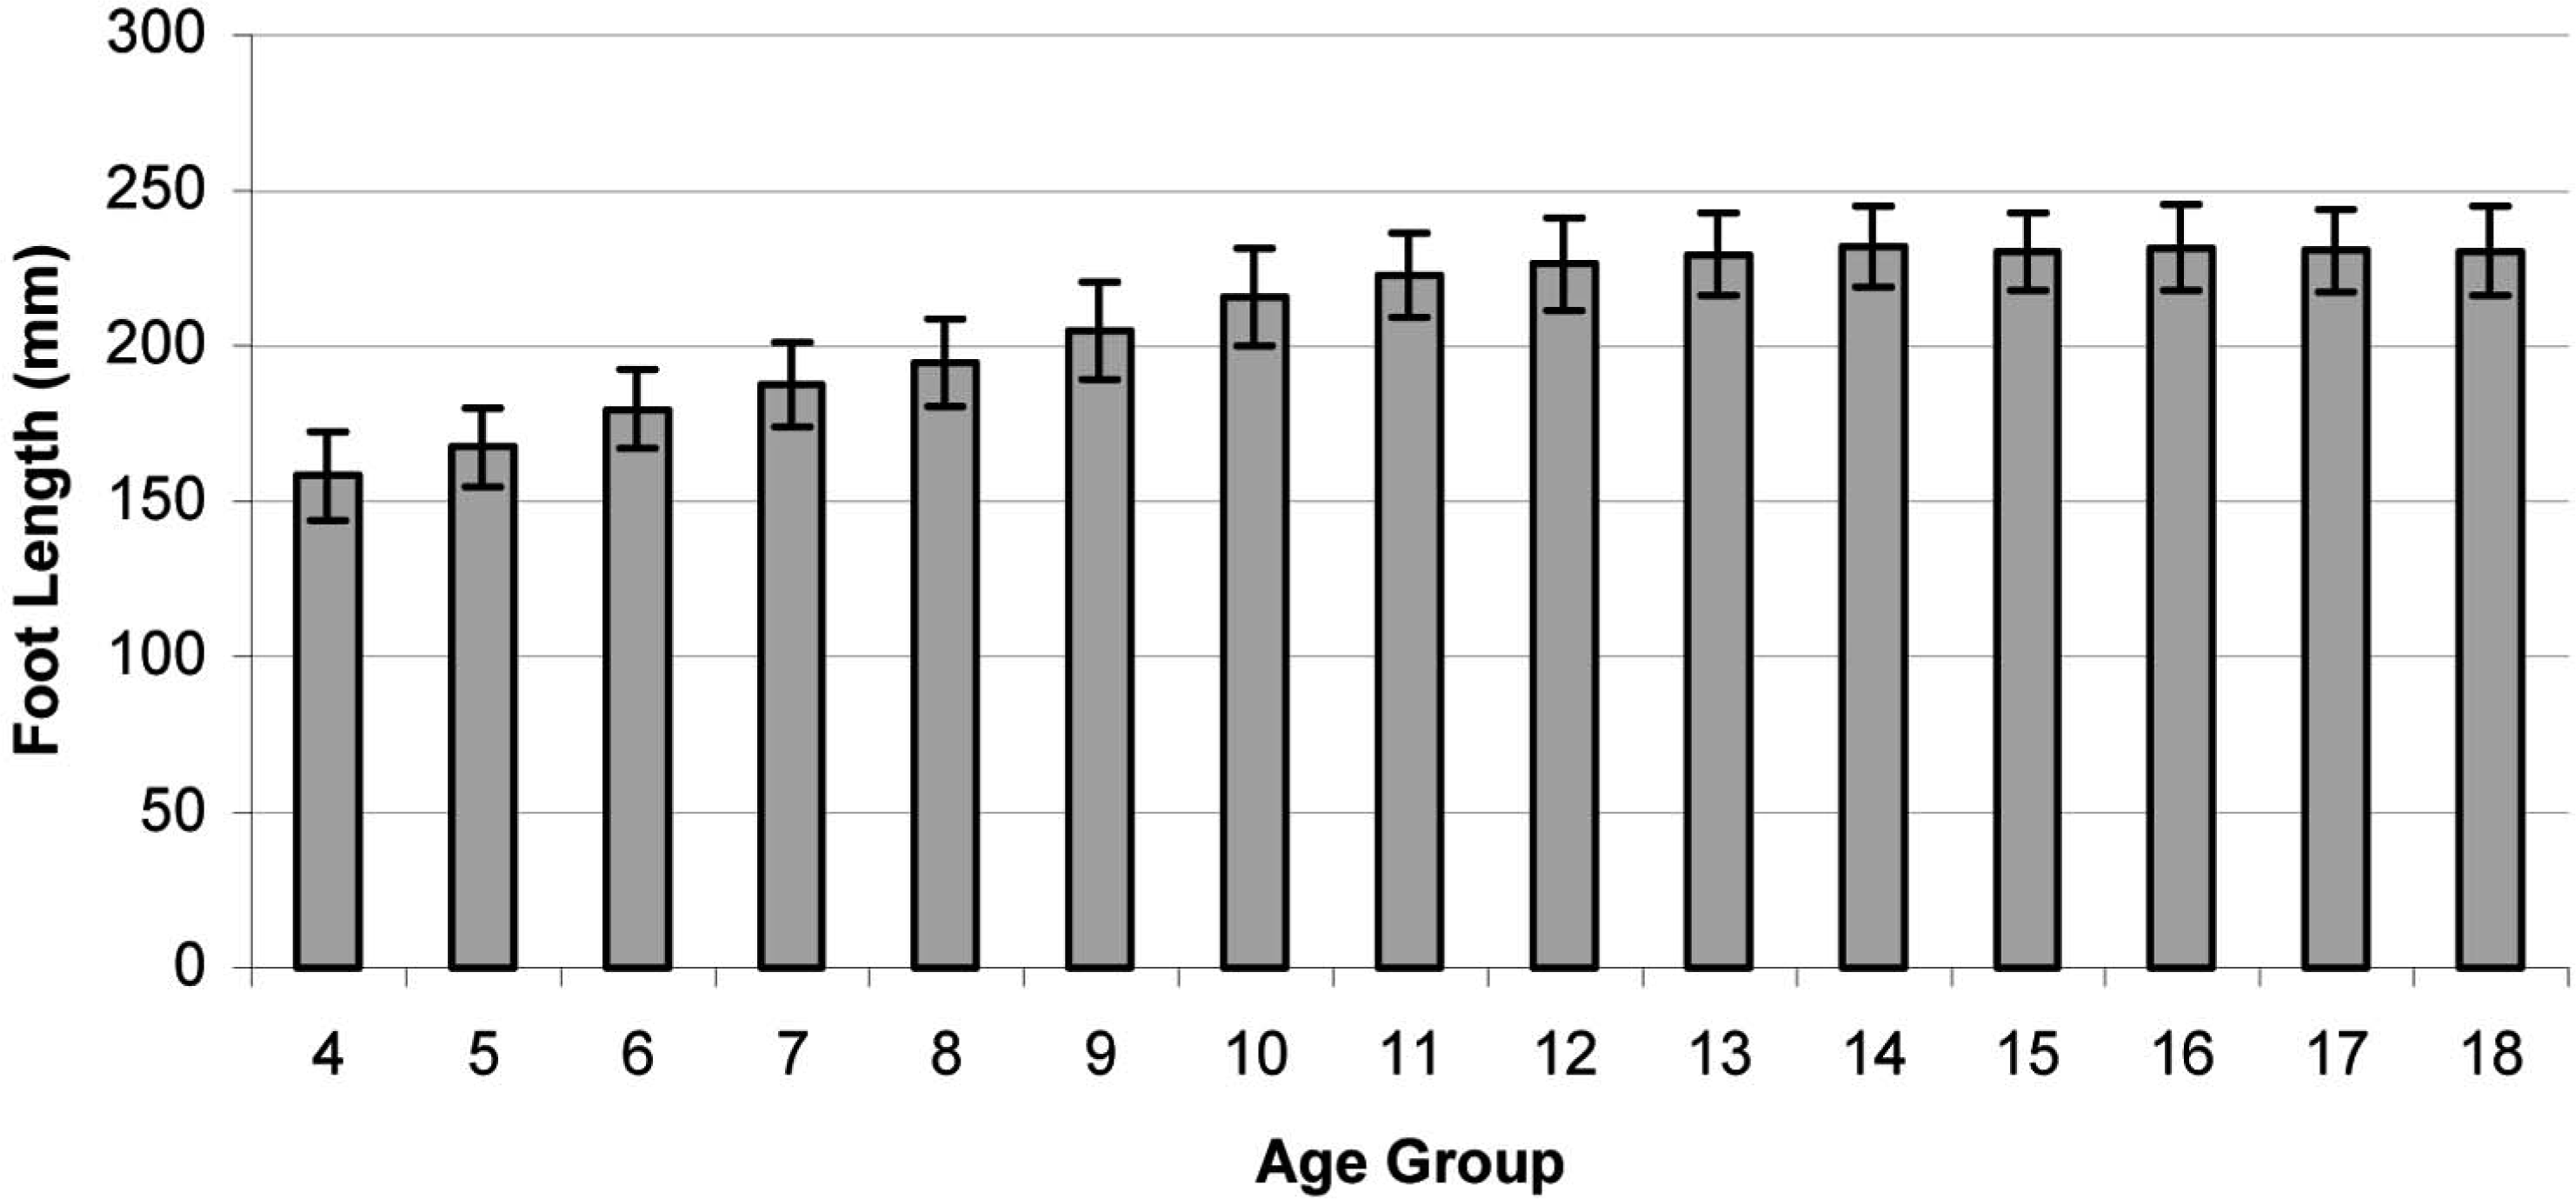
Mean weight-bearing foot length of girls.
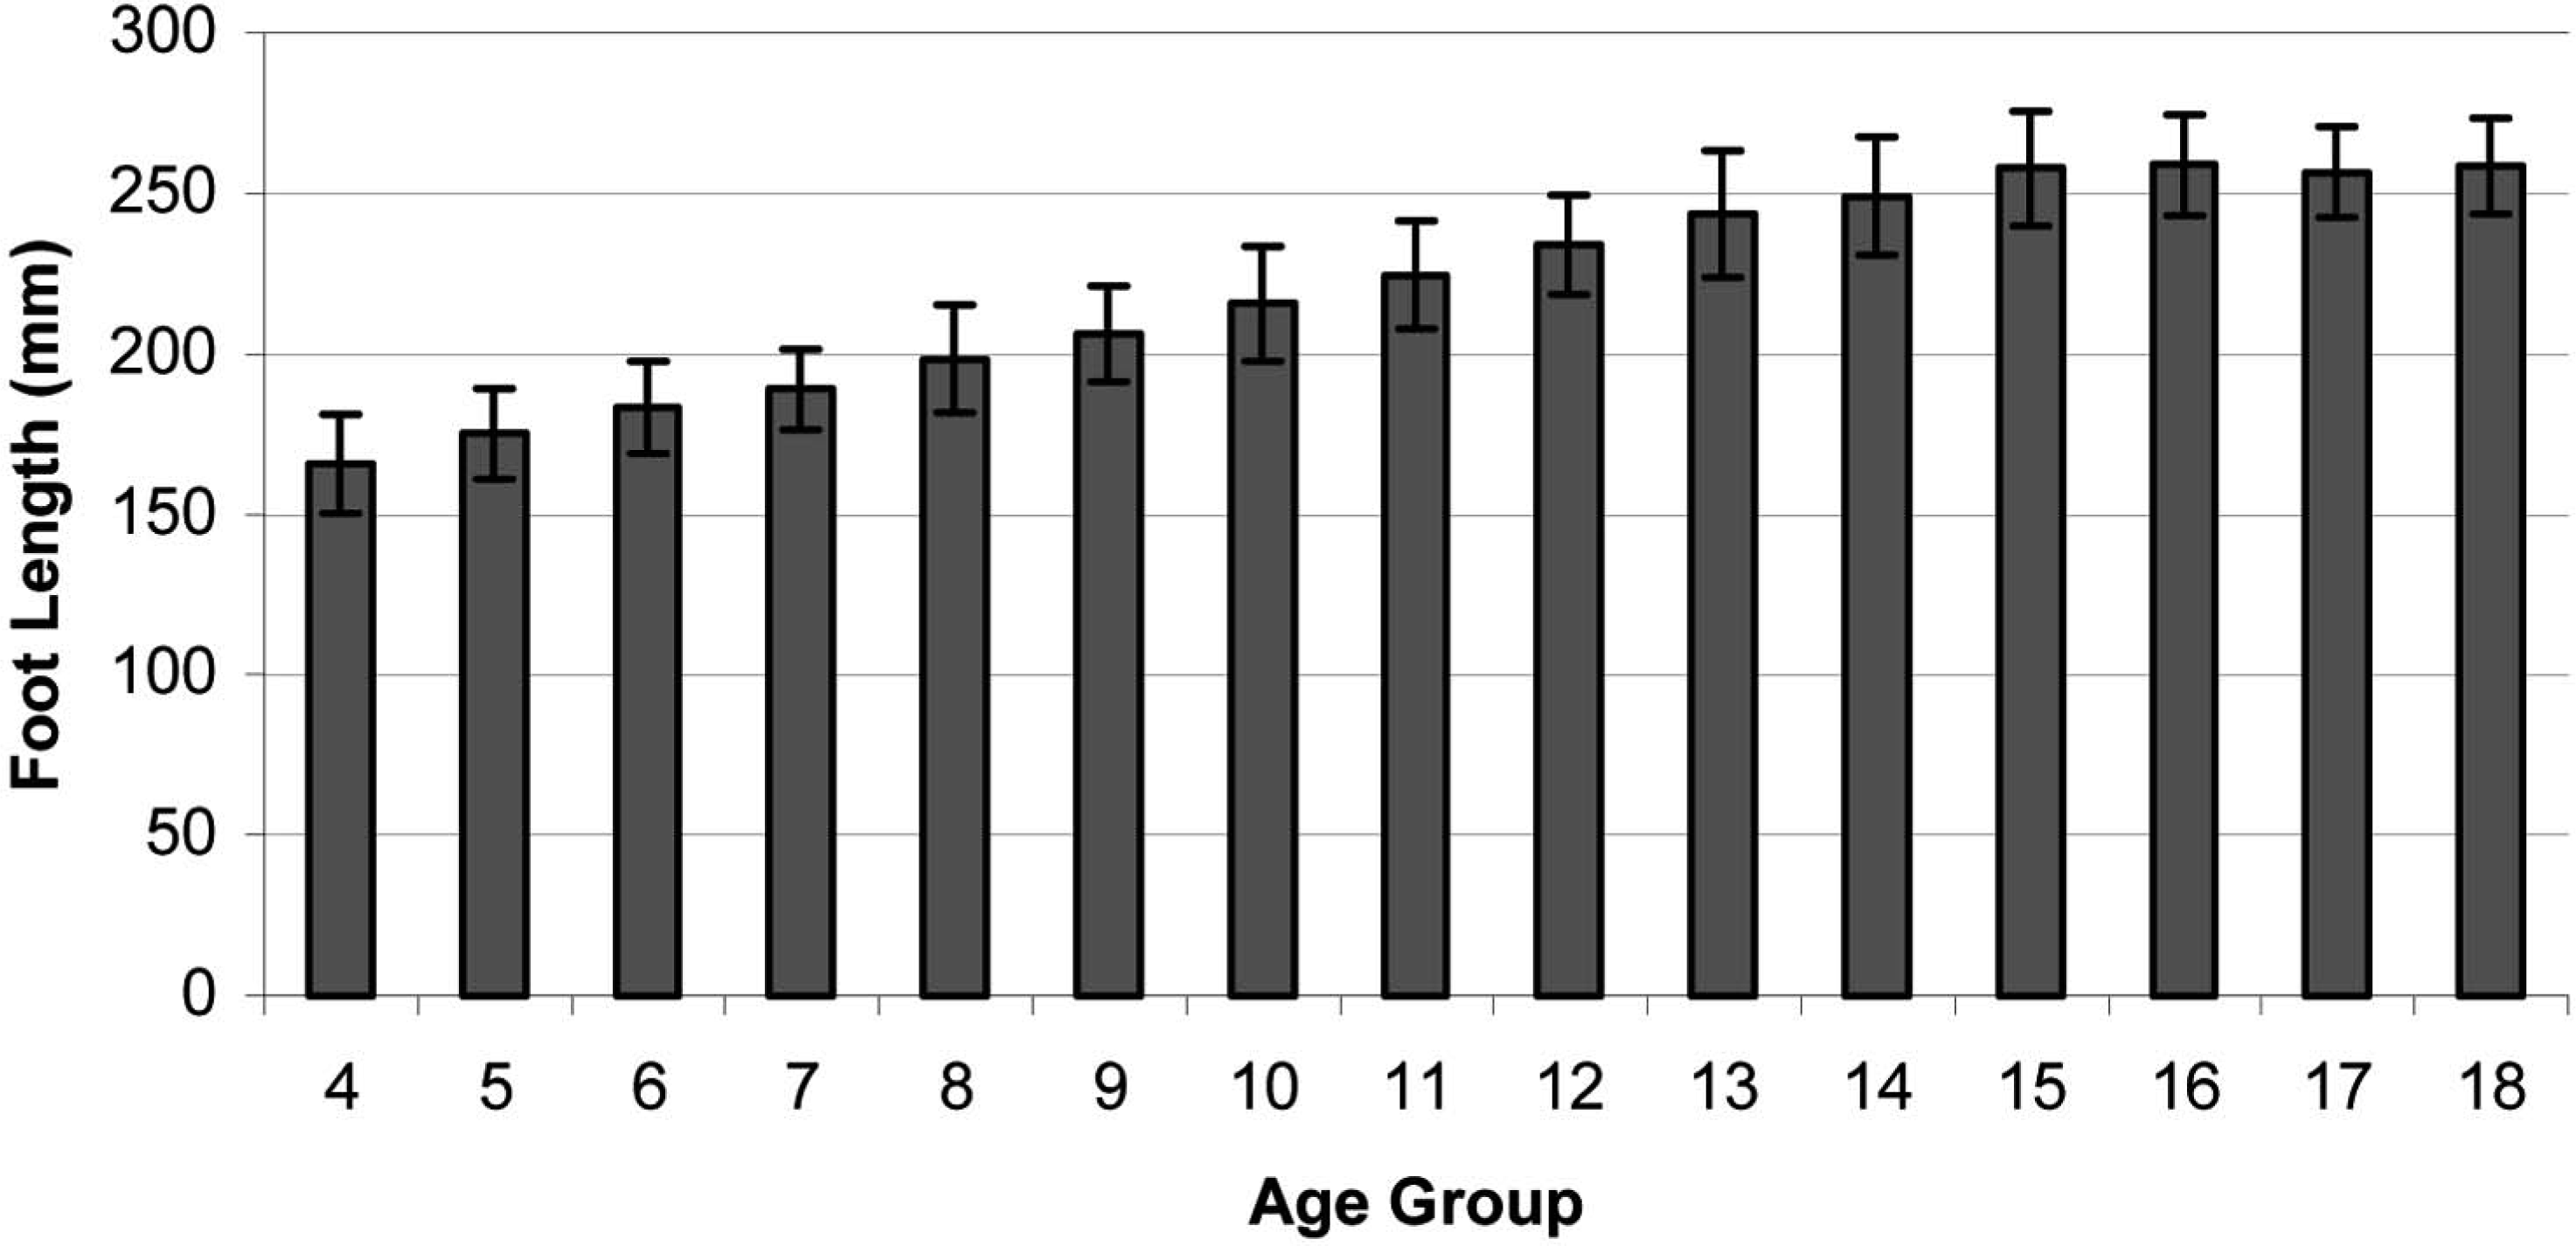
Mean weight-bearing foot length of boys.
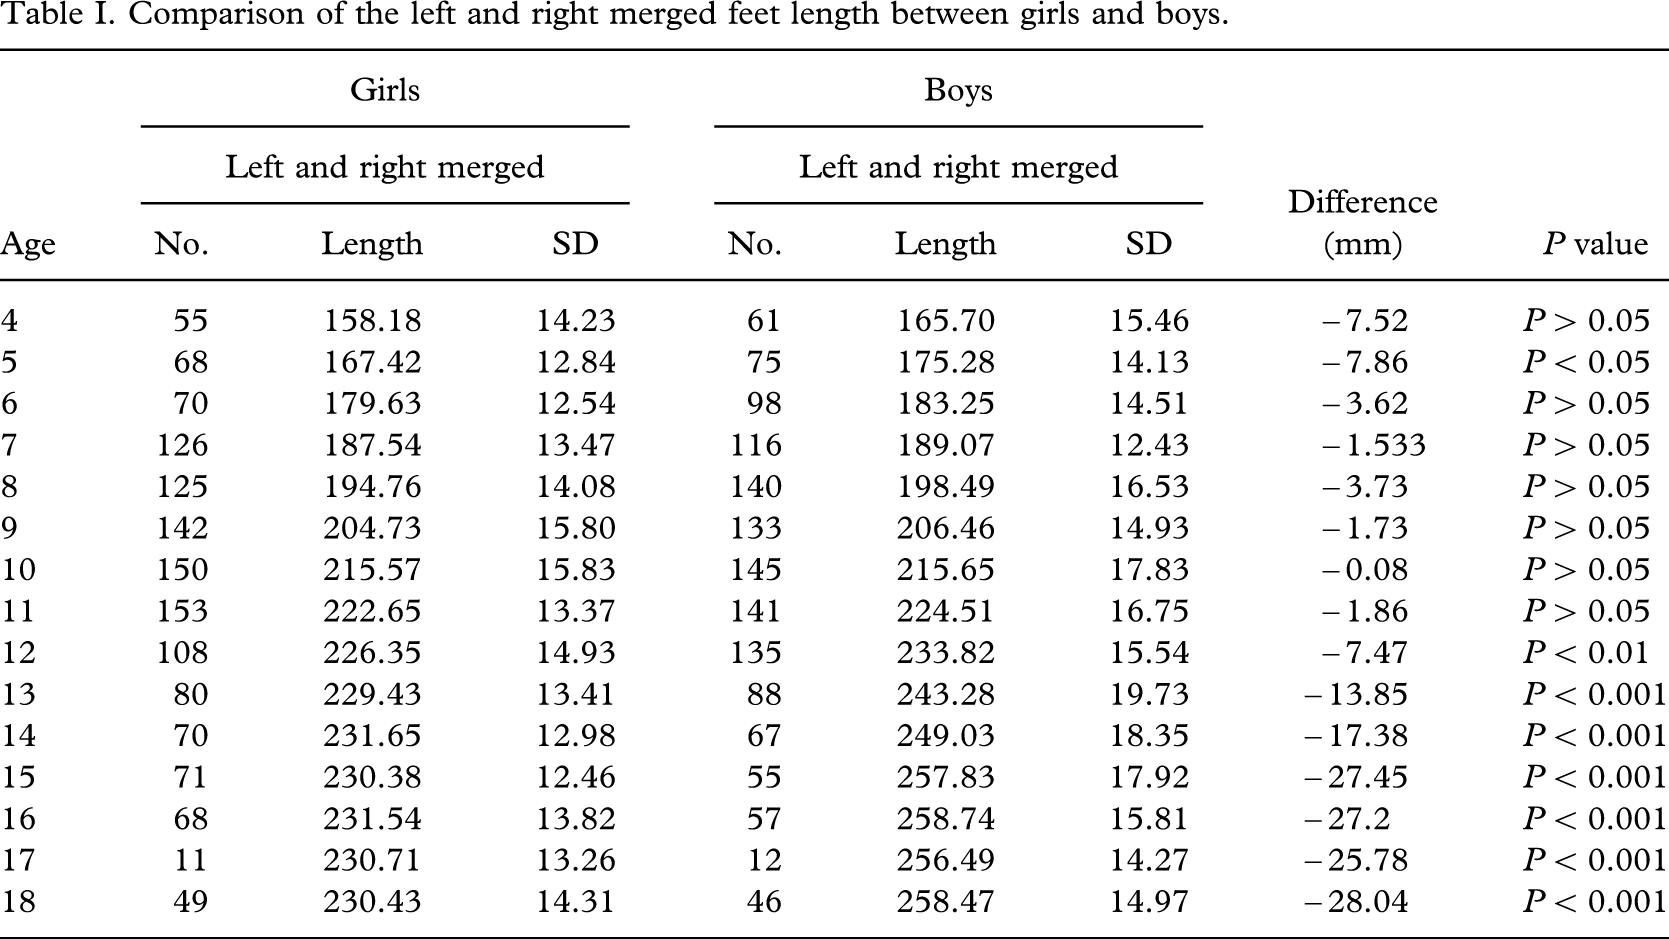
The results of a two-way ANOVA show that the left or right side did not show any significant effect on foot length in both sexes (P < 0.0001). The left and right merged foot length of girls and boys are shown in Table I. There was a significant difference between girls and boys (P < 0.0001). The results of Bonferroni post tests showed a significant difference between girls and boys at 5 years of age, and from 12 years upward.
Contact force ratio (CFR)
The mean CFR for different age groups of girls is shown in Figure 7. The CFR in girls decreased from 0.183 at 4 years of age to 0.134 at 11 years of age. Then, it increased to 0.158 at 16 years of age and became steady with small fluctuation from 17 years of age and thereafter. The results of a two-way ANOVA showed a significant effect of age on CFR in both the left and right sides (P < 0.0001). There was no significant difference in CFR between the left and right sides (P = 0.5702). The results of Bonferroni post-tests did not show any significant difference between the left and right sides of the matched age groups.
The mean CFRs for different age groups of boys are shown in Figure 8. In boys, the CFR decreased from 0.175 at 4 years of age to 0.130 at 10 years of age. Then, it increased to 0.161 at 16 years of age and became steady at 17 years of age. The results of a two-way ANOVA showed that age has a significant effect of age on CFR in both the left and right sides (P < 0.0001). There was no significant difference in CFR between the left and right sides (P = 0.2442). The results of Bonferroni post-tests did not show any significant difference between the left and right sides of the matched age groups.
Comparison of the left and right merged feet length between girls and boys.
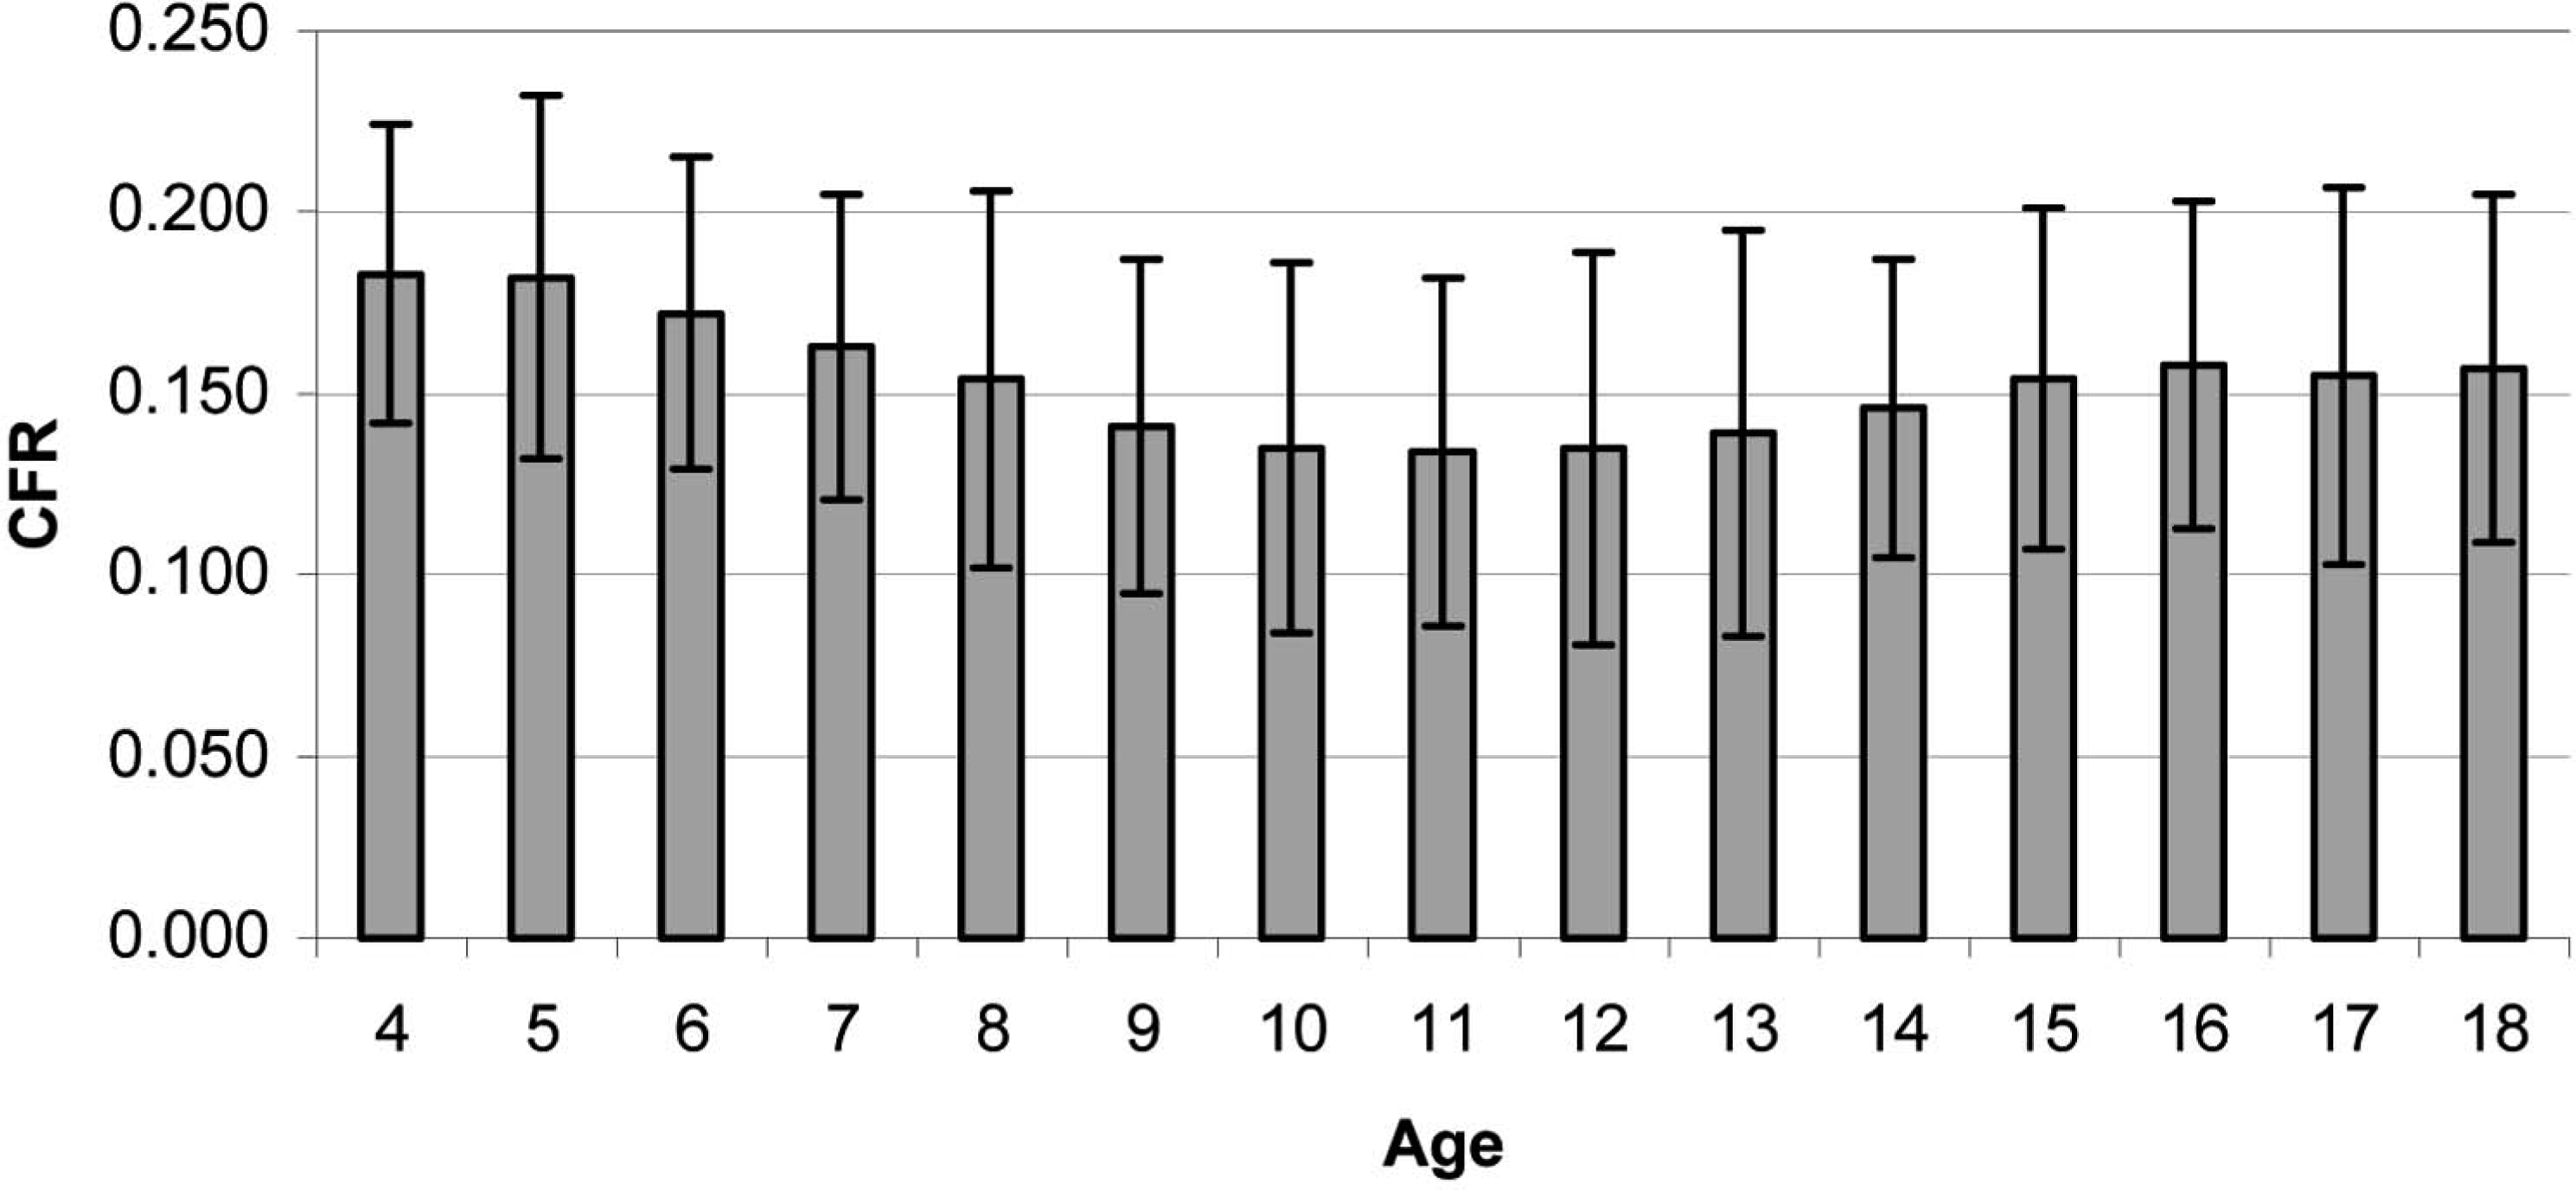
Mean contact force ratio (CFR) of girls.
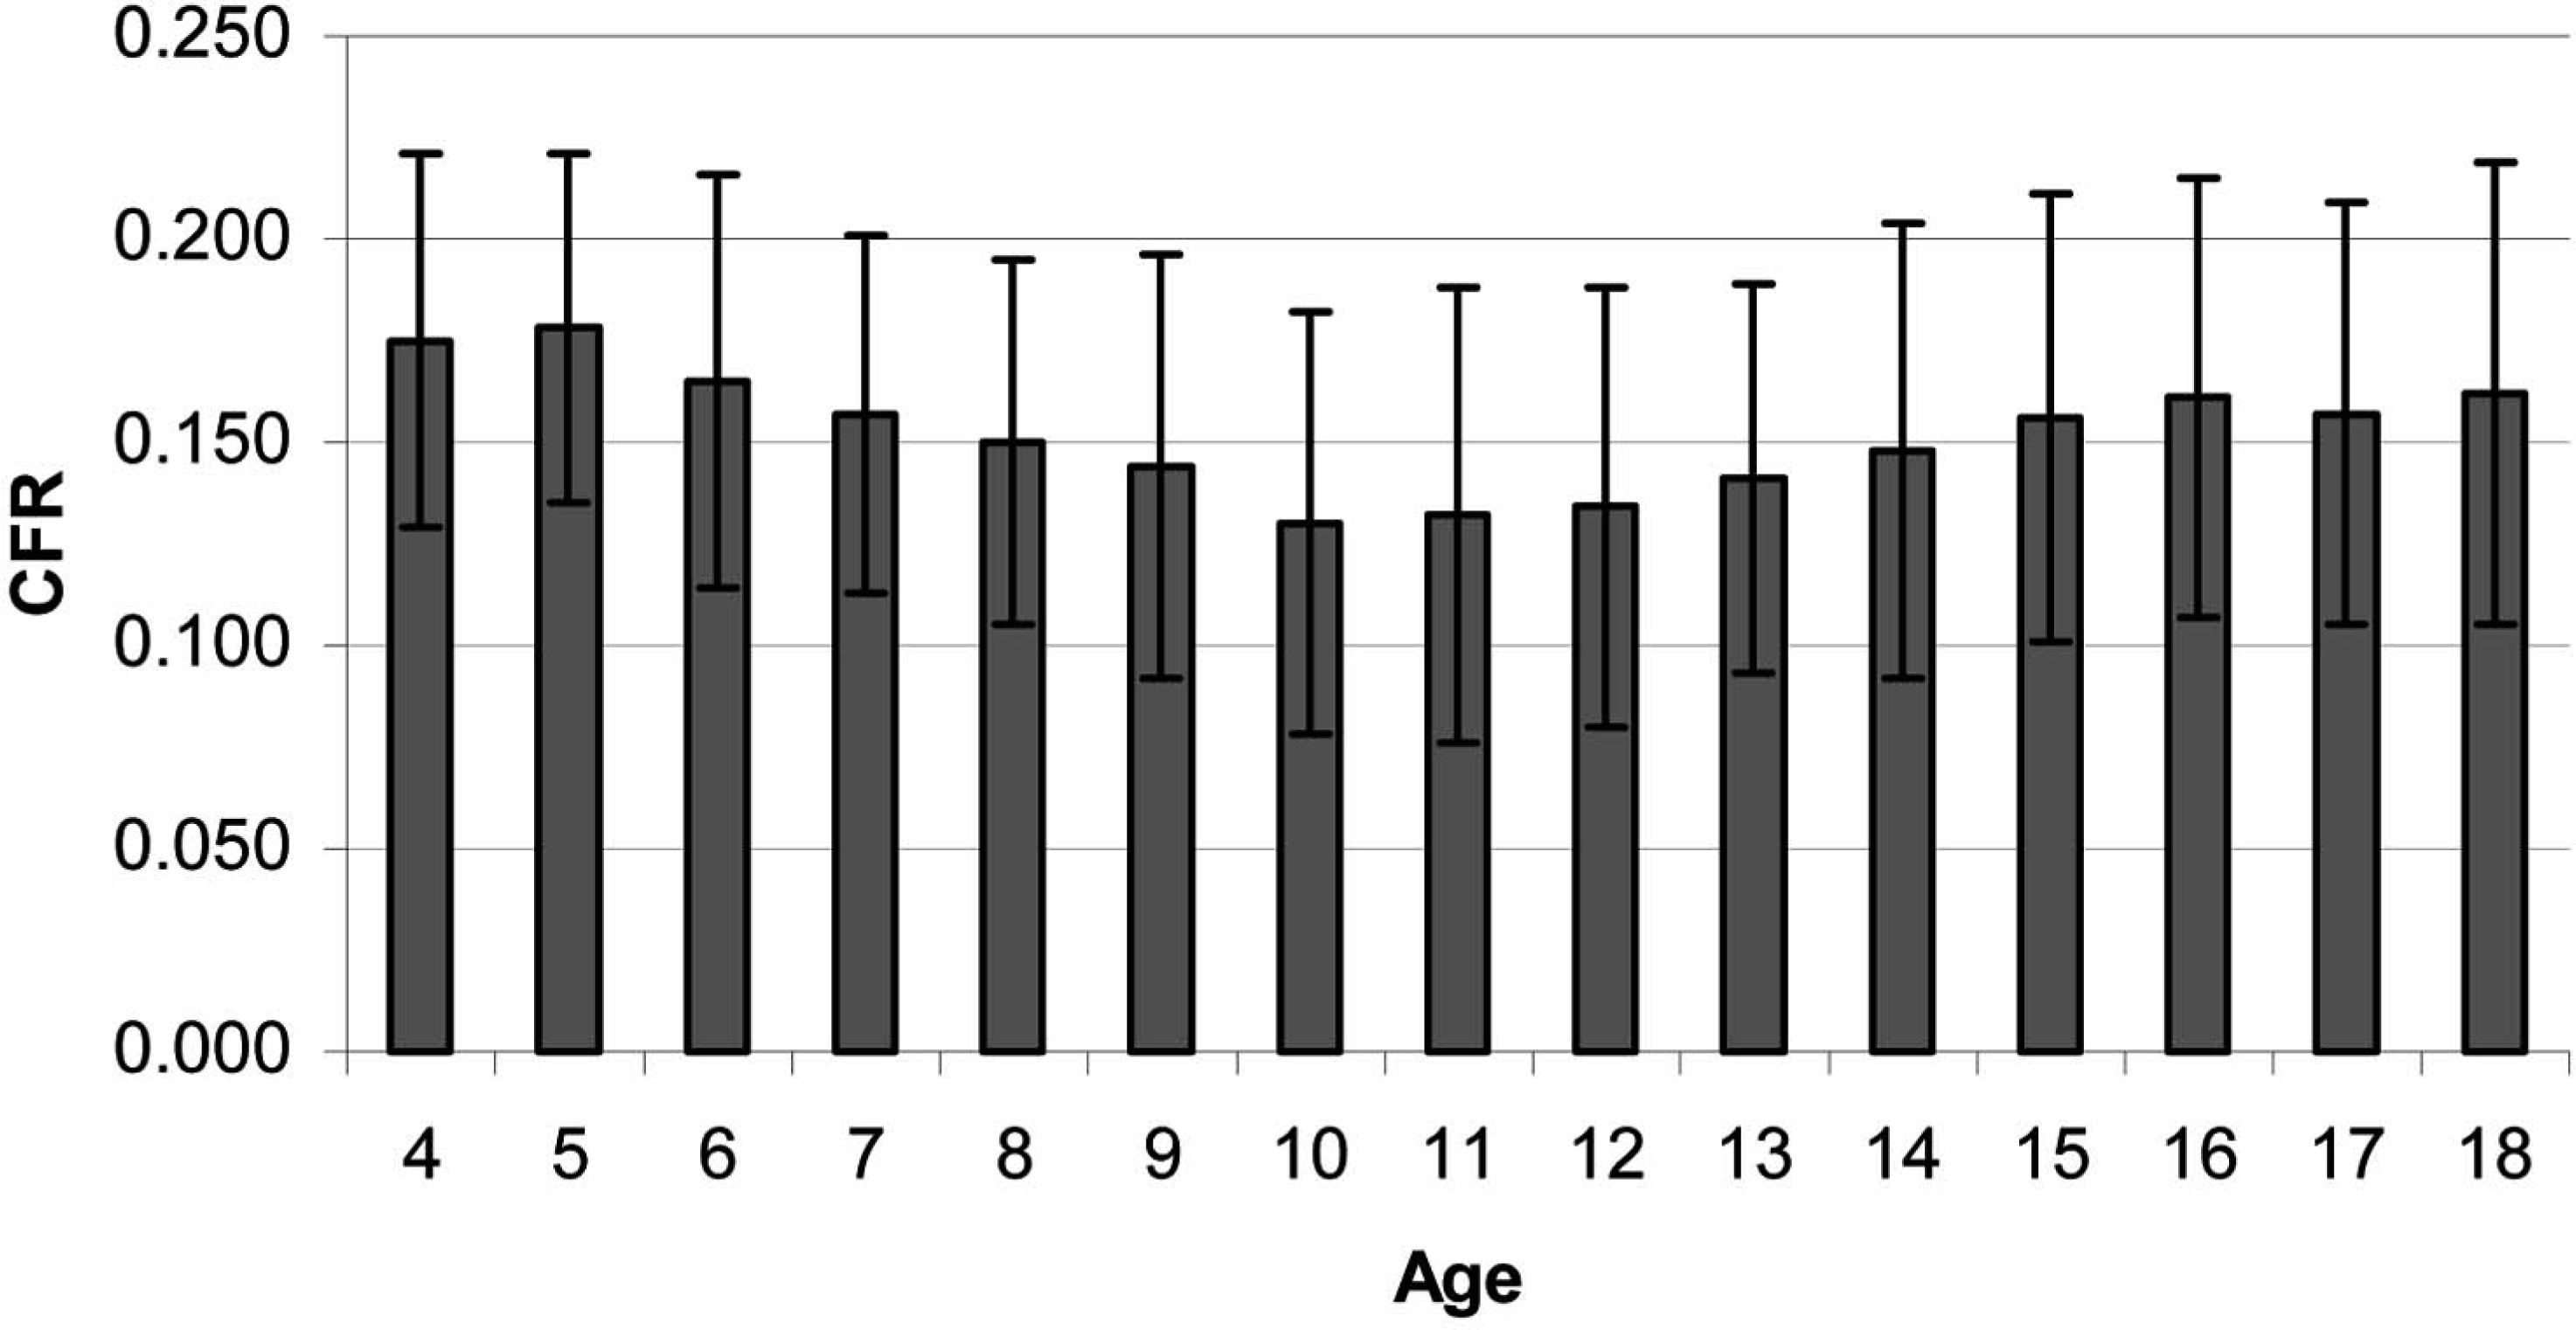
Mean contact force ratio (CFR) of boys.
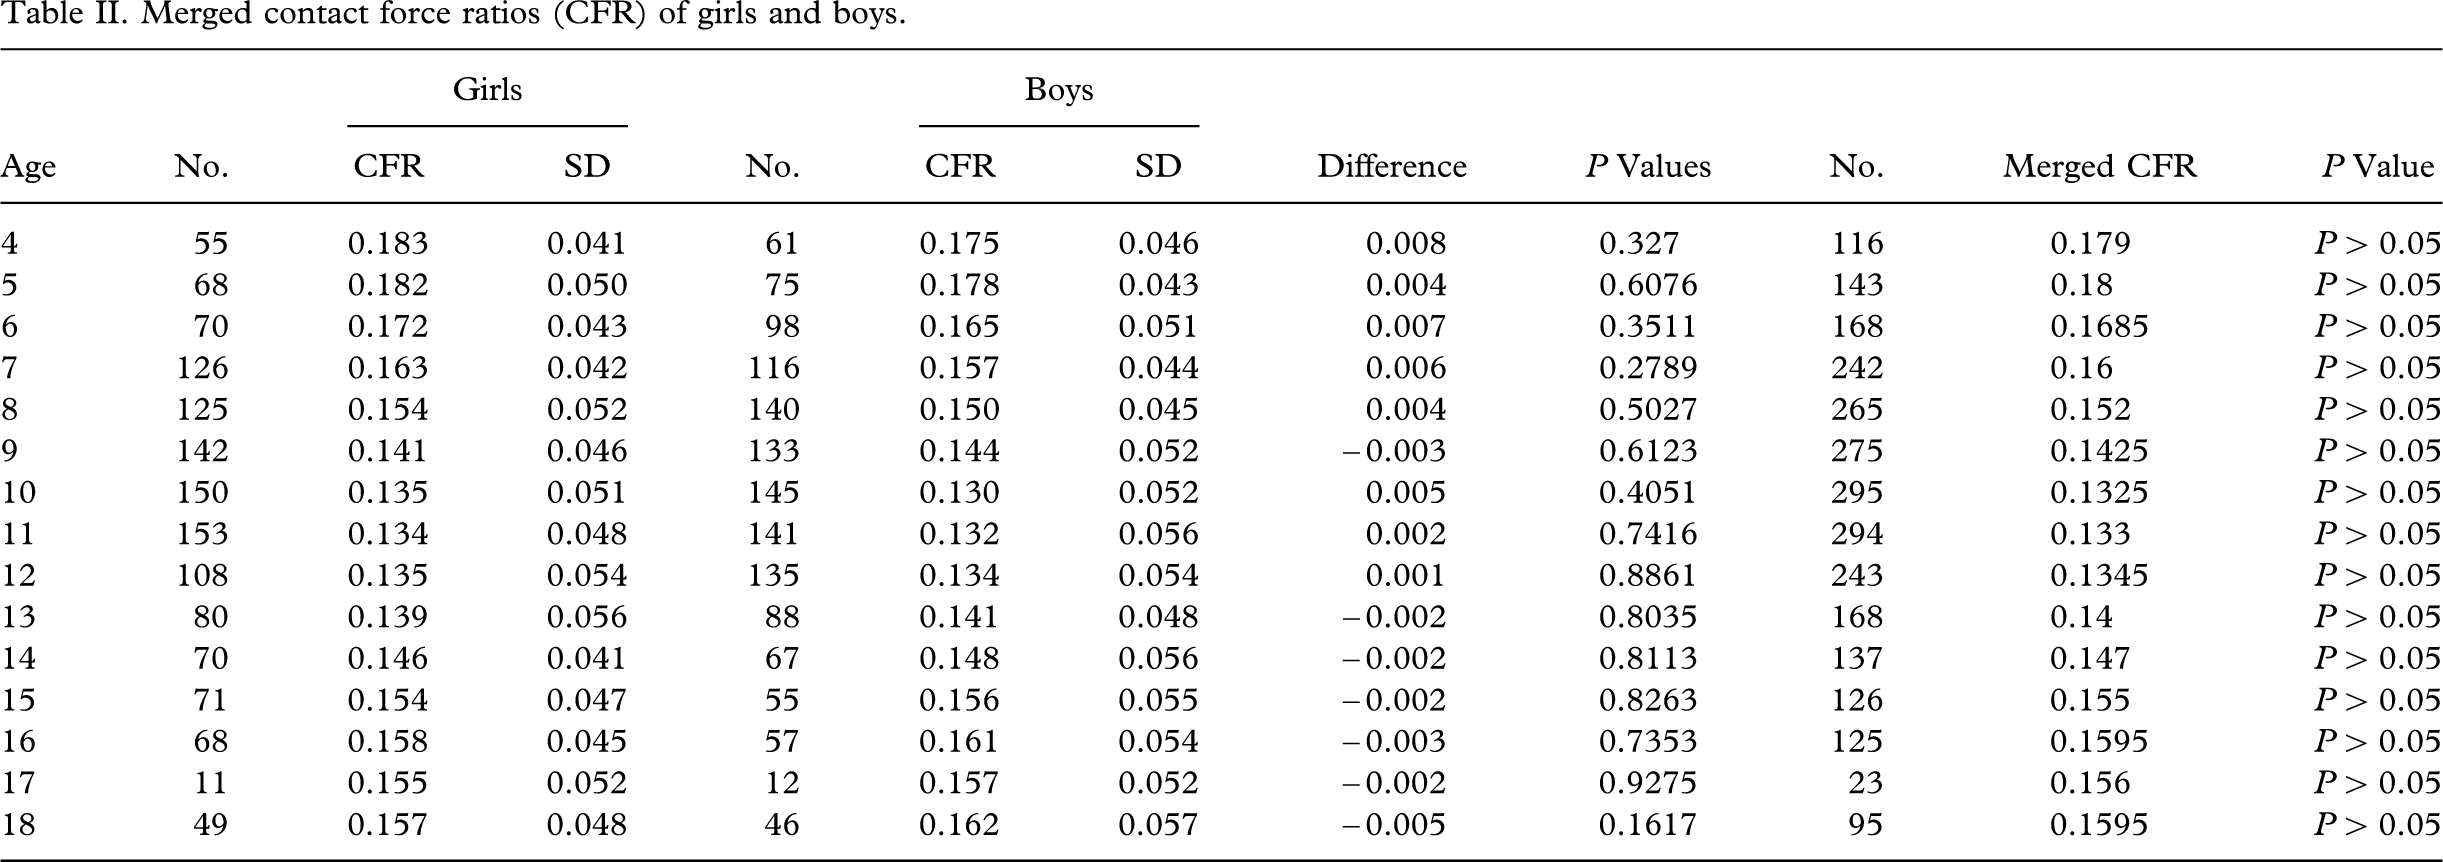
The merged CFRs between girls and boys are shown in Table II and Figure 9. The values were similar at 4 and 5 years of age. They decreased from 6 to 10 years and then plateaued from 10 to 12 years. Then, they increased until 16 years of age and plateaued again. Although the CFR was found to be negatively correlated to body mass index (BMI) for all ages, the correlation was relatively low (r = −0.58). The results of a two-way ANOVA showed that age has a significant effect on CFR in both sexes (P < 0.0001). There was no significant difference in CFR between girls and boys (P = 0.8213). The results of Bonferroni post-tests did not show any significant difference (P 4 0.05) between the left and right sides of the matched age groups. The change in CFR with age (P = 0.9761) is not statistically significant in both sexes.
Merged contact force ratios (CFR) of girls and boys.
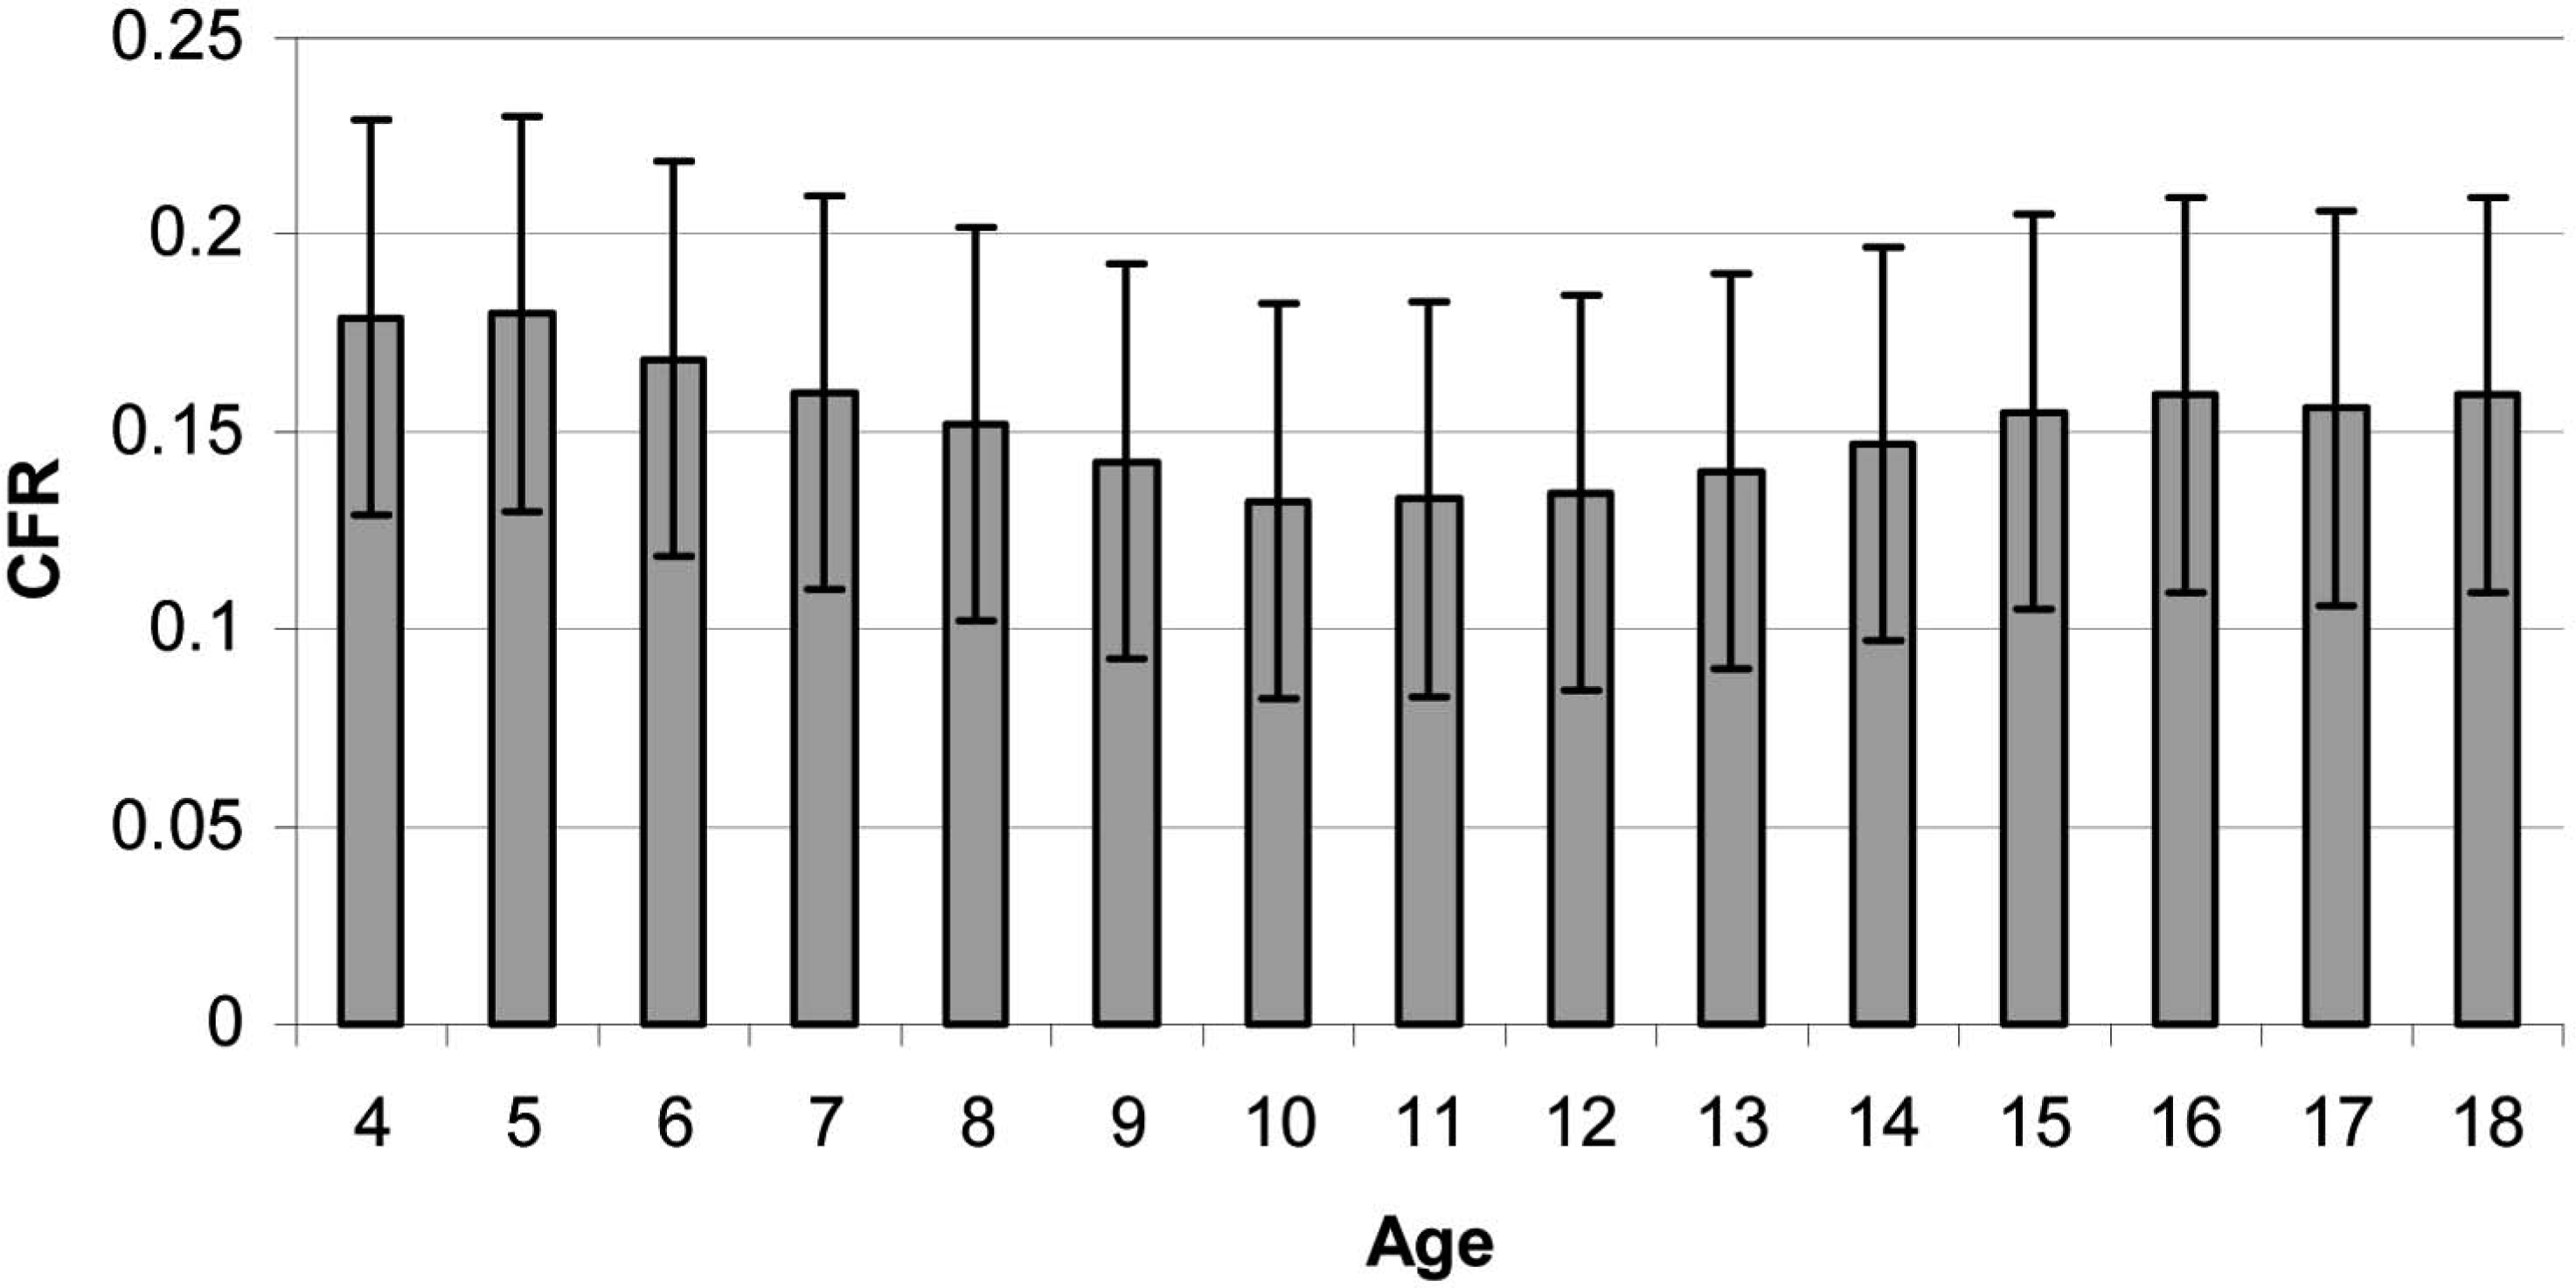
Merged contact force ratio (CFR) of girls and boys.
The cross-sectional study provided information about body weight, weight-bearing foot length, and the newly introduced CFR for estimating the foot-arch function development pattern of the Chinese growing age population. Footprint analysis has been applied to study the morphology of the growing foot arch. The range of normal values was usually defined as being within one standard deviation (Didia et al. 1987) or two standard deviations (Staheli et al. 1987) from the mean. The normal medial longitudinal arch should have developed with the correction of the physiological genu valgum by the age of 5 or 6 years (Forriol and Pascual 1990). The major modifications in the medial arch contour occurred between 2 and 6 years of age, when the spontaneous resolution of a flat foot can be expected to occur (Volpon 1994). Plantar pressure studies (Craxford et al. 1984; Hennig et al. 1994) also suggested that foot-arch development was almost completed before the age of 6 years, and the overall percentage of flat feet decreased as age increased.
In this study, the foot length of girls increased linearly from the age of 4 to 13 years. At the same time, the rate of change in body weight of the same group of subjects only started to slow down at the age of 15 years. The foot was still under progressive loading after it had developed close to its full length. This might explain the increase in CFR from the age of 13 to 15 years in girls, after which it became steady. In boys, the foot took slightly longer to develop close to its full length, with the foot length increasing linearly from the age of 4 years until 14 years. The increase in body weight slows down at the age 16 years. The CFR became plateaued at that time, too. This might also explain the increase in the CFR between 14 and 16 years of age and then the plateauing in boys.
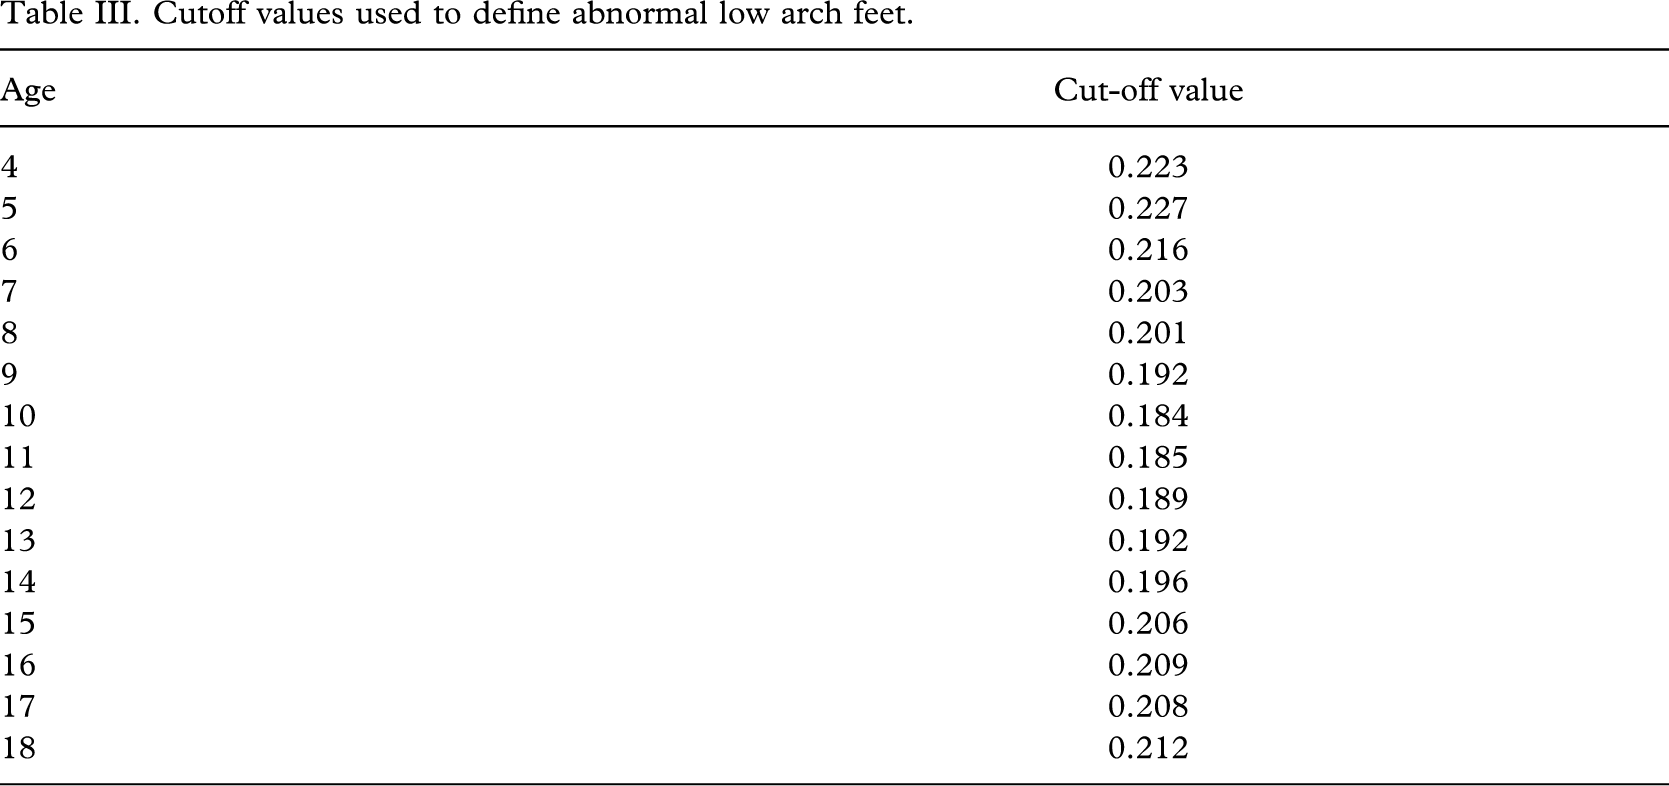
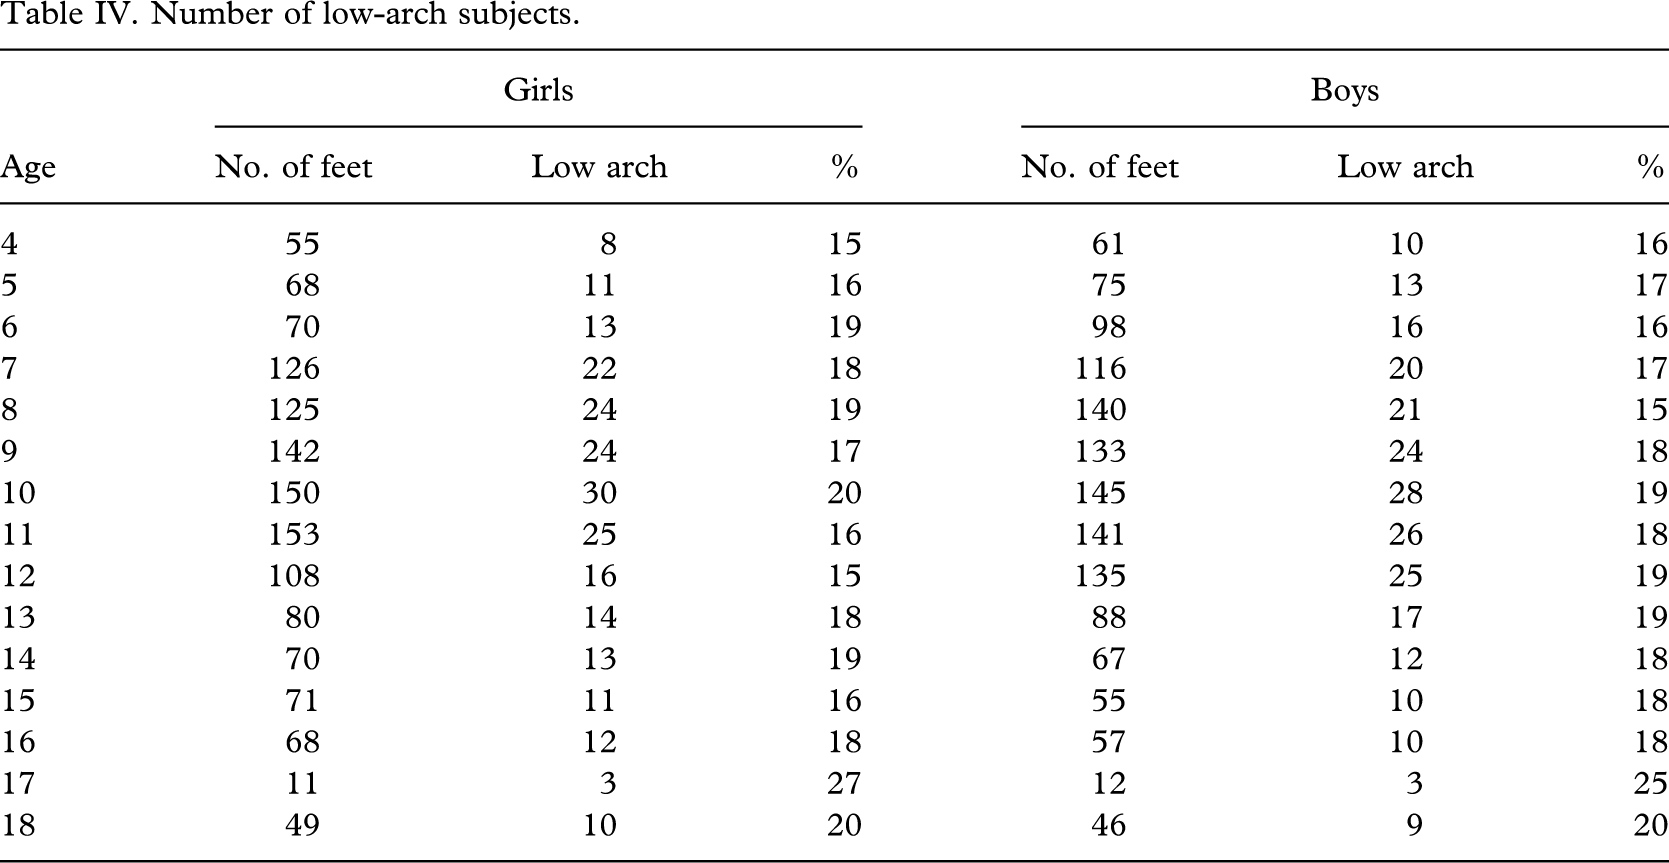
The mean CFR established for each age group is suggested as an indicator to identify the abnormal low arch. Those feet with a CFR value greater than the age mean plus one standard deviation are classified as having an abnormally low arch. The cut-off CFR values of each age group were suggested (Table III). According to these cut-off values, the number of low-arch subjects of each age group is shown in Table IV. With the exception of the 17-year-old age group, which consisted of a relatively small number of subjects, the percentage of low-arch subjects of all the other age groups ranged from 15 to 20%.
Cutoff values used to define abnormal low arch feet.
Number of low-arch subjects.
Conclusion
A total of 2715 schoolchildren, 1369 boys and 1346 girls, aged 4–18 years, participated in the cross-sectional survey. Data on weight-bearing foot length, body weight, and dynamic footprints during gait were collected. The weight-bearing foot lengths for girls and boys showed significant differences at 4–5 years, and from 12 years and upward. There were no significant differences in body weight between girls and boys until 15 years of age.
The Contact Force Ratio (CFR) was derived from the dynamic footprint as a measure of mid-foot loading to reflect foot function and classify foot types. A cross-sectional study was carried out to set references to estimate the development pattern of the foot arch function of the growing age group. The mean CFR, with standard deviations, of the growing age groups was formulated. In general, the CFR decreased from 4 to 10 years of age, plateaued at 10–12 years, and then increased until 15–16 years.
The mean CFR found for each age group was suggested as a reference to identify the abnormal low-arch foot. Those feet with a CFR value greater than the age mean plus one standard deviation were classified as abnormal. The cut-off values used to define an abnormal low arch were suggested.