
Abstract
Background:
The transverse arch (TA) has recently been shown to significantly increase the intrinsic stiffness of the midfoot when coupled with the medial longitudinal arch (MLA). Progressive collapsing foot deformity (PCFD) is a complex deformity that ultimately results in a loss of stiffness and collapse of the MLA. The role of the TA has not been investigated in patients diagnosed with this disorder using weightbearing CT (WBCT). Therefore, this study aims to answer the following questions: (1) Is the curvature of the TA decreased in PCFD? (2) Where within the midfoot does TA curvature flattening happen in PCFD?
Methods
A retrospective review of weightbearing CT images was conducted for 32 PCFD and 32 control feet. The TA curvature was assessed both indirectly using previously described methods and directly using a novel measurement termed the transverse arch plantar (TAP) angle that assesses the angle formed between the first, second, and fifth metatarsals in the coronal plane. Location of TA collapse was also assessed in the coronal plane.
Results:
The TAP angle was significantly higher in PCFD (mean 115.2 degrees, SD 10.7) than in the control group (mean 100.8 degrees, SD 7.9) (P < .001). No difference was found using the calculated normalized TA curvature between PCFD (mean 17.1, SD 4.8) and controls (mean 18.3, SD 4.0) (P = .266). Location of collapse along the TA in PCFD was most significant at the second metatarsal and medial cuneiform.
Conclusion:
The TA is more collapsed in PCFD compared to controls. This collapse was most substantial between the plantar medial cuneiform and the plantar second metatarsal. This may represent a location of uncoupling of the TA and MLA.
Level of Evidence:
Level III, retrospective case control.
Introduction
The medial longitudinal arch (MLA) is unique to the human foot and is not found in other human-like species.16,24 This extensively studied arch has been described as the principal evolutionary adaption differentiating human and primate feet, as this arch is thought to provide the midfoot stiffness required for human bipedalism.12,15,29 Beyond its importance in foot evolution, the MLA plays a central role in a number of foot deformities including pes planovalgus 14 and cavovarus. 23 Nevertheless, the MLA is not the only arch in the foot. The transverse arch (TA), also referred to as the transverse tarsal arch (TTA), is orthogonal to the MLA and may also play a role in these processes.
A recent study by Venkadesan et al 30 has shown that the TA plays a critical role in foot stiffness. Using curved elastic shells, and then cadaveric feet, they demonstrated that a transverse curvature (corresponding to the TA) amplified the stiffness intrinsic to a longitudinal curvature (corresponding to the MLA). The authors noted that a basic application of this concept is how a floppy sheet of paper noticeably stiffens when curved in the transverse direction.
With the newfound understanding of the importance of the TA in the stiffness of the foot, Venkadesan and colleagues used a previously described technique of measuring the fourth metatarsal (MT4)27,31 in a series of extinct hominins to calculate a normalized, torsion-based estimation of the curvature of the TA and to plot its evolutionary development. MT4 torsion is used because the proximal MT4 base is part of a curved arch while the distal head lies flat on the ground. In this manner, the greater the intrinsic torsion of the MT4, the greater the curvature of the arch. Their results showed that the hominins with the greatest TA curvature, and therefore the greatest midfoot stiffness, were those who lived most recently and were most evolutionary related to modern day humans (from the species Homo). Because the ability to walk on 2 feet is thought to be dependent on the stiffness of the midfoot,12,15,29 when you take into consideration the apparent evolutionary coemergence of the TA and the MLA along with the increase in stiffness provided by coupling of the 2 arches, the importance of the TA in the evolutionary emergence of bipedalism becomes apparent. Applying these novel findings in the context of modern-day foot deformities may have a wide-reaching effect on the overall foot and ankle specialty.
Adult-acquired flatfoot deformity, recently renamed progressive collapsing foot deformity (PCFD), 3 is a common and sometimes disabling disorder. Although the TA has been studied previously using conventional radiographs,11,32 to the best of the authors’ knowledge, there has been no evaluation of the TA in PCFD, as well as no assessment using WBCT.8,25 Considering the findings of Venkadesan et al, 30 the TA may play a crucial role in the pathogenesis of this deformity. Given that the combination of the MLA and the TA provides increased foot stiffness, the question arises whether PCFD, which represents a progressive and painful collapse of the MLA, might be a consequence of an insufficient curvature of the TA, resulting in an overall loss of foot stiffness.
Furthermore, PCFD appears to be more complex than an isolated collapse of the MLA. Initially, the deformity was described as dysfunction of the posterior tibial tendon and was thought to follow a sequential set of steps, ultimately leading to MLA collapse.13,21 But several inconsistencies are present in this concept.7,17,26 Based on a recent expert consensus, PCFD is now described as a complex condition combining 5 distinct deformities that can arise independently from one another. These 5 deformities are represented by 5 classes, and each class can either be flexible or rigid. 25 Similarly, the role of the TA in PCFD was not discussed by these experts and is not considered in the current classification system. Consequently, improving the understanding of TA behavior in PCFD could help foot and ankle specialists and surgeons better understand the pathology and could potentially improve treatment particularly in understanding whether specific TA correction is necessary.
Thus, the objective of this study was to answer the following questions: (1) Is the curvature of the TA decreased in PCFD? (2) Where does TA flattening happens in PCFD?
Methods
This retrospective case-control, single-center study received institutional review board approval (IRB 201904825) and complied with the Health Insurance Portability and Accountability Act.
Patients who presented to our institution with symptomatic PCFD and who underwent weightbearing CT (WBCT) assessment (cone-beam CT extremity scanner; PedCAT; CurveBeam, Hatfield, PA) were reviewed for this study. 28 Exclusion criteria included patients under 18 years of age, those with prior foot surgery, individuals suffering from tarsal coalition, inflammatory diseases, or neuropathic pain. Data previously reported by Venkadesan et al 30 shows a mean for normalized curvature (ĉ) to be 16.9 with a SD of 2.7. With a type I risk of 5%, a type II risk of 20%, an estimated 10% expected minimal difference between our PCFD and control groups, and a unilateral test, we performed an a priori power calculation and estimated that 32 feet per group would be necessary. Starting in August 2021 and moving retrospectively, the institution’s database was reviewed to continuously select 32 PCFD feet that met criteria. Then, 32 control feet were randomly selected from a database including scans obtained from healthy volunteers without clinically apparent deformity (IRB 201912144) (Table 1).
Demographics and Patient Characteristics.
Abbreviations: BMI, body mass index; PCFD, progressive collapsing foot deformity.
All measurements were independently completed by 2 fellowship-trained foot and ankle surgeons who assessed the study’s population on WBCT acquisitions with built-in WBCT analysis software (CubeVue, CurveBeam). Before each measurement, the sagittal plane of the WBCT data set was aligned along the longitudinal axis of the third metatarsal in the axial view, controlling for influences related to abduction of the hindfoot. Intraclass correlation coefficients (ICCs) were calculated for each measurement performed (Table 2).
ICC for WBCT Measurements (n=32 for Both PCFD and Control Groups).
Abbreviations: ICC, intraclass correlation coefficient; PCFD, progressive collapsing foot deformity; WBCT, weightbearing CT.
The TA was directly assessed using a newly proposed angle, the transverse arch plantar (TAP) angle, measured in the coronal plane, and represented by the angle formed between the most plantar parts of the first, second, and fifth tarsometatarsal joints. This angle is proposed based on similar methodology used to describe a different PCFD angulation, also measured in the coronal plane.5,6 More specifically, to perform the measurement reliably, the following methodology was used. First, starting in the axial plane, the most plantar aspect of the first tarsometatarsal joint (TMTJ) was identified and the cross-section of the coronal and sagittal planes was brought to that point (Figure 1A). Then in the sagittal plane, that location of the cross-section of the axial and coronal planes was verified to be equidistant between the articular surfaces of the proximal first metatarsal and distal medial cuneiform (Figure 1B). Back in the coronal plane, the identified voxel of the cross sections served as the first point to build the TAP angle (Figure 1C). The exact same process was then repeated at the second TMTJ, finding the second point and vertex of the TAP angle. Finally, the same process was utilized to identify the third and final point of the TAP angle, at the fifth TMTJ. This process created an angle that included the arch’s apex (second TMTJ) and the medial and lateral endpoints on either side of the arch (first and fifth TMTJ respectively), presumably resulting in a simple and reproducible 2-dimensional measurement that most accurately reflects a 3-dimensional curvature. Examples of TAP angles measured in a PCFD patient and a control are depicted respectively in Figure 1D and E.
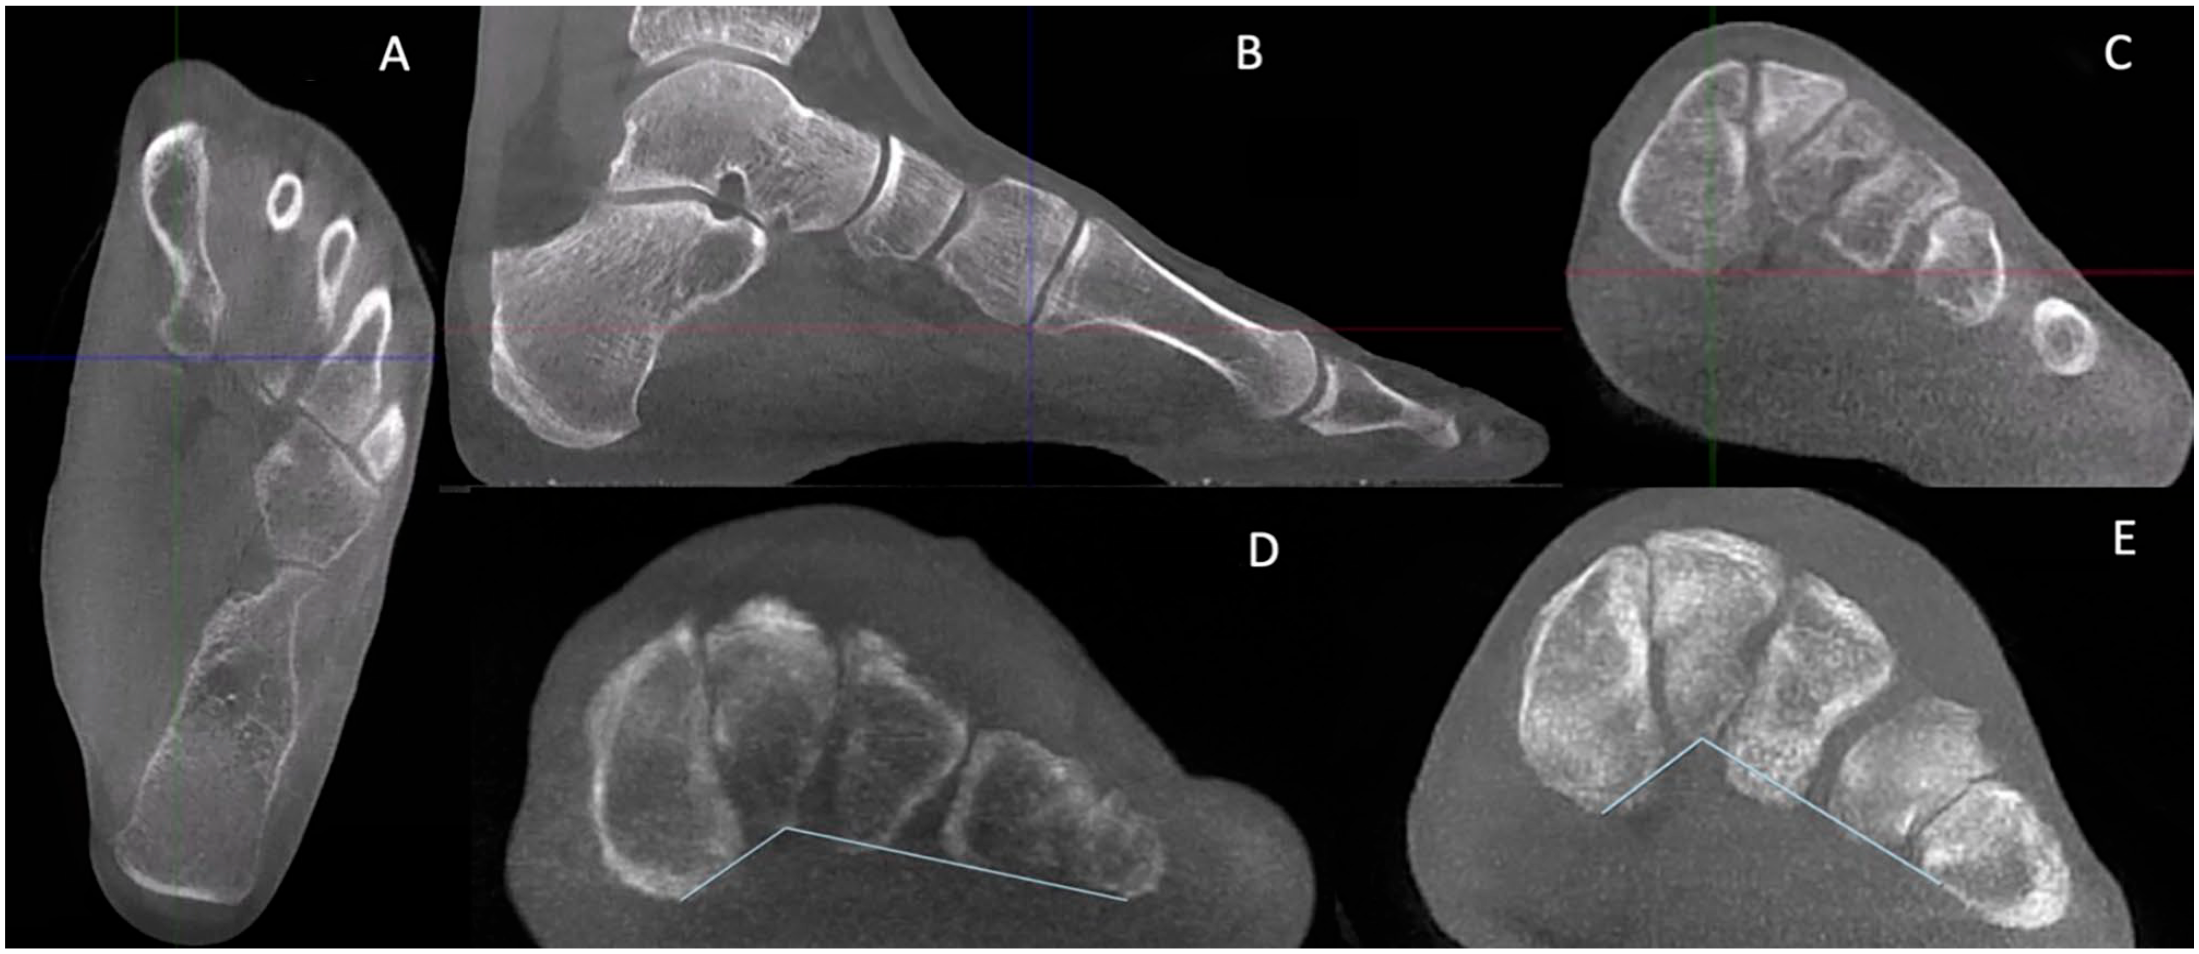
(A-E) The transverse arch plantar (TAP) angle is the angle formed between the most plantar aspects of the first, second, and fifth tarsometatarsal joints (TMTJs) in the coronal plane. An example of finding the most plantar aspect of the first TMTJ is shown. (A) First in the axial plane, the most plantar aspect of the first TMTJ was found. (B) Then in the sagittal plane, the location was verified to be equidistant between the 2 bones of the joint: in this case, the medial cuneiform and first metatarsal. (C) Then the location is marked in the coronal plane as the first point. This process is repeated for the second and fifth TMTJ, forming the 3 points of the TAP angle in the coronal plane. The TAP angle was measured in (D) patients who have PCFD and in (E) controls. PCFD, progressive collapsing foot deformity.
To extrapolate the curvature of the TA, we applied the equation described by Venkadesan et al.
30
This equation includes fourth metatarsal torsion (
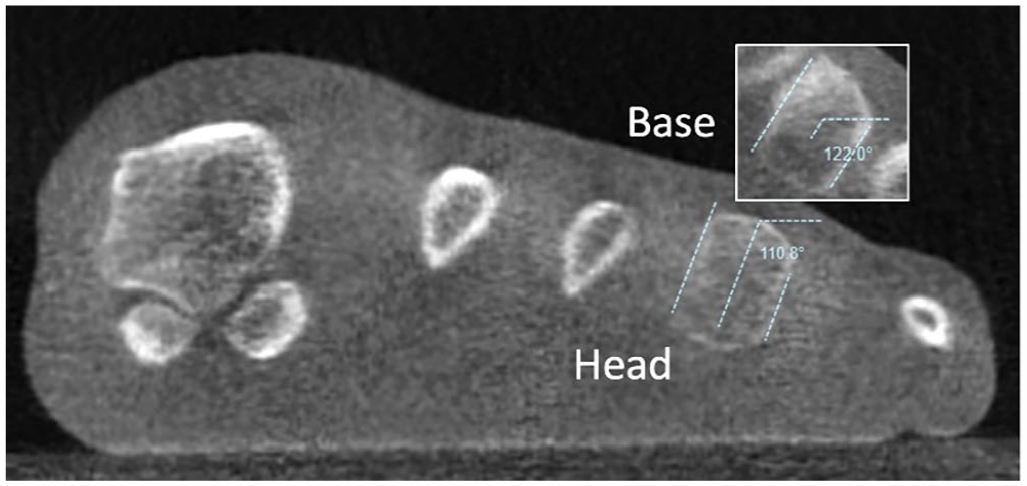
Fourth metatarsal torsion (
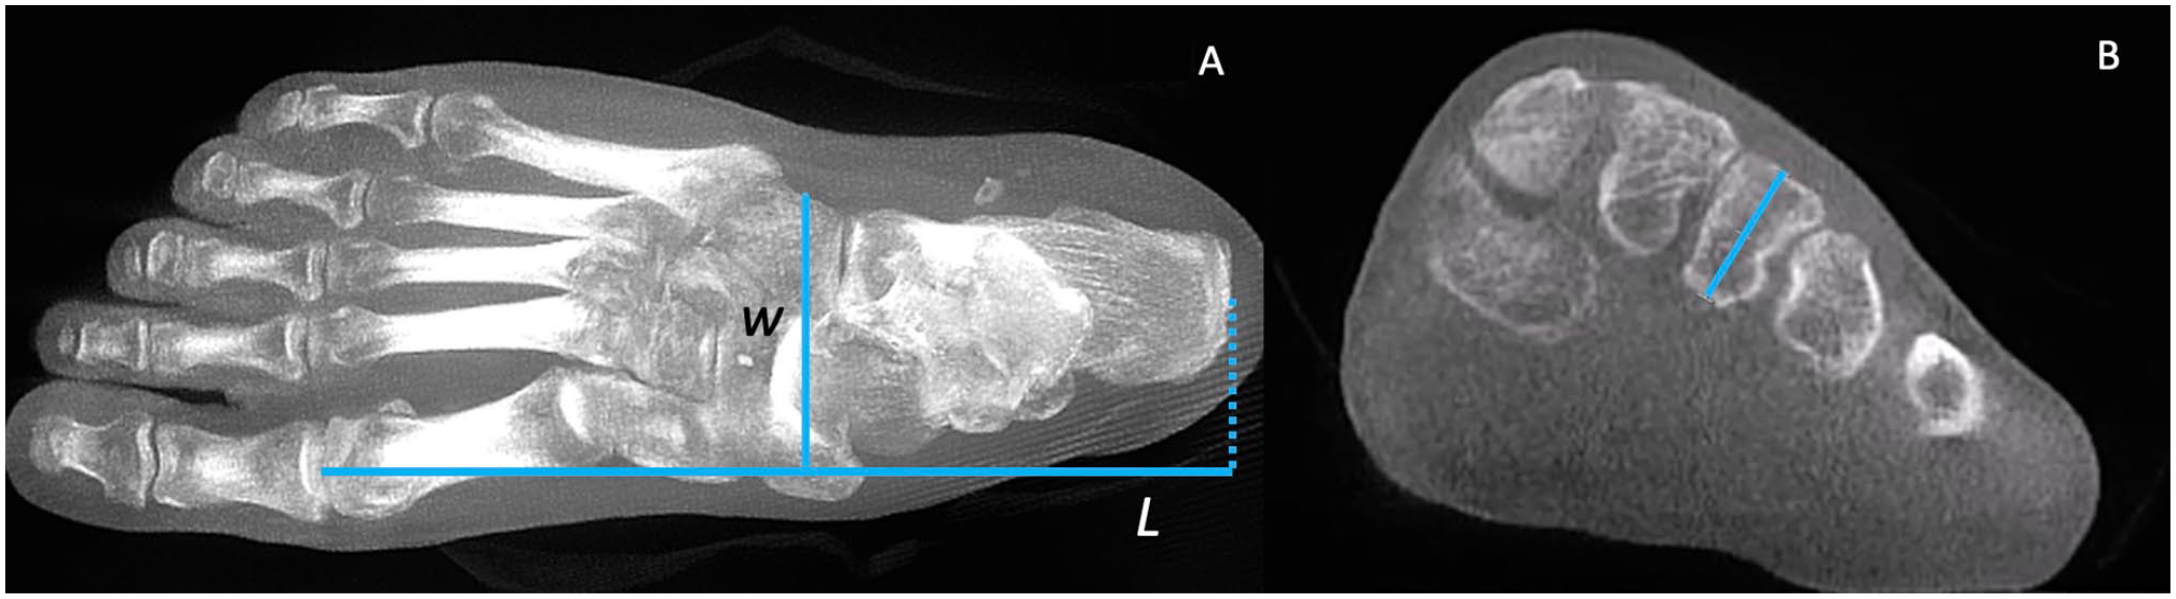
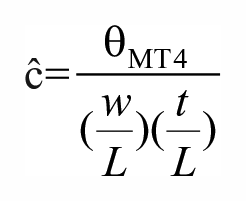
(A, B) Definitions of width (w), length (L), and third metatarsal thickness (t) are as follows: (A) Width (w) is the distance between the most lateral aspect of the cuboid and the most medial aspect of the cuneiform in the axial plane. Length (L) is the distance between the most proximal aspect of the calcaneus and the most distal aspect of the first metatarsal in the axial plane. (B) Thickness (t) is defined as the distance between the middle dorsal edge and the middle plantar edge of the third metatarsal base in the coronal plane.
To assess where within the midfoot the TA is flattening, the distance between each metatarsal and a line connecting the medial cuneiform and fifth metatarsal at the level of the most inferior aspect of the medial cuneiform was drawn (Figure 4). The collapse between the first and second rays was assessed by the distance between this line and the second metatarsal base, the collapse of the second and third rays by subtracting the distance between the line and the third metatarsal from the distance between the line and the second metatarsal, and so on.
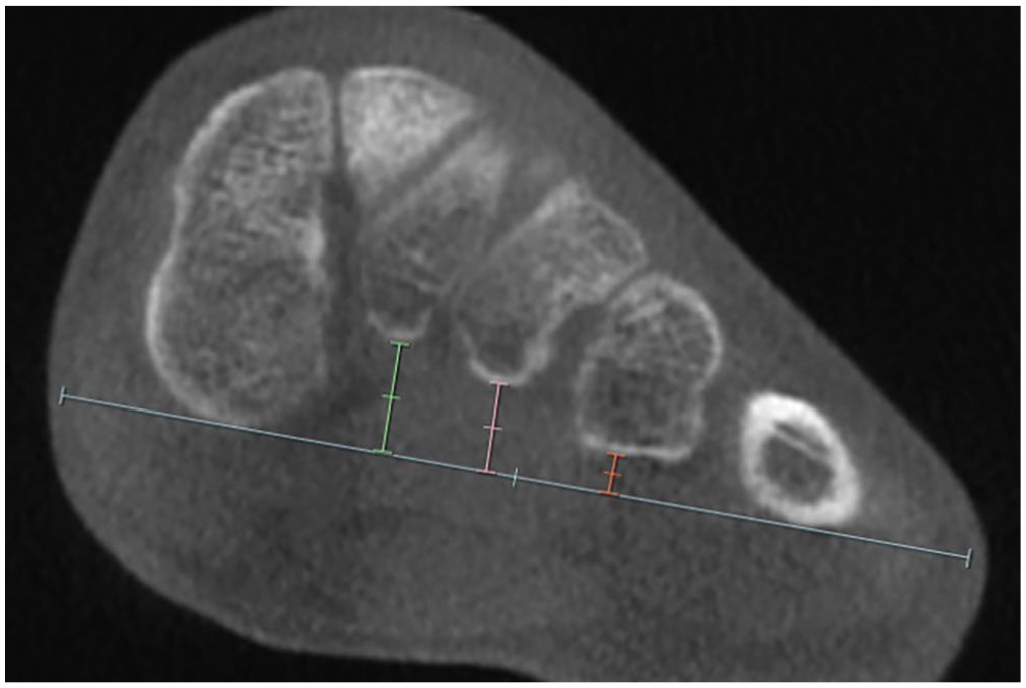
A method to determine where collapse is occurring along the transverse arch. First, the most inferior aspect of the medial cuneiform was identified in the axial plane. Then in the coronal plane, a line was drawn connecting the most inferior aspect of the medial cuneiform (C1) and the most inferior aspect of the fifth metatarsal (M5). Then the distance between that line and the second metatarsal (M2) was measured (C1-M2, with the value of C1 equaling zero) and these measurements were repeated between the second and the third (M2-M3), the third and the fourth (M3-M4), and finally the fourth and the fifth metatarsals (M4-M5, with the value of M5 equaling zero).
Finally, the foot and ankle offset (FAO), which is a semiautomatic 3D WBCT measurement validated to assess PCFD, was used to measure overall 3D foot deformity2,4 and represents the offset between the center of the ankle joint and the bisecting line of the foot tripod.18,20,33
Statistical Analysis
Normality of all quantitative variables were assessed using the Shapiro-Wilk test. Two groups were compared using a t test for normal, and Mann-Whitney test for nonnormal variables. Gender difference between groups was tested with the χ2 test. Interobserver reliabilities were assessed using intraclass correlation coefficient (ICC). A P value less than .05 was considered statistically significant. All statistical analyses were performed with EasyMedStat (version 3.26; https://www.easymedstat.com).
Results
The TAP angle presented an excellent reliability (ICC: 0.93, 95% CI 0.89, 0.95; P < .001). Intraclass correlation coefficient reliability for calculated TA curvature (ĉ) was found to be modest (ICC: 0.73, 95% CI 0.62, 0.82; P < .001). The distance measurements between the bones of the TA were also found to be reliable with modest to excellent reliability. See Table 2 for overall reliability measurements.
The TAP angle was increased in patients with PCFD as compared to controls. The mean values for the TAP angle were 115.2 degrees (SD 10.7) and 100.8 degrees (SD 7.9) for PCFD and controls, respectively (P < .001). The mean values for the calculated normalized TA curvature (ĉ) were not significantly different between groups with a mean value of 17.1 (SD 4.8) for PCFD and 18.3 (SD 4.0) for controls (P = .266).
When looking at the variable of fourth metatarsal torsion (
Summary of Results for All Performed Measurements in PCFD (n=32) and in Controls (n=32).
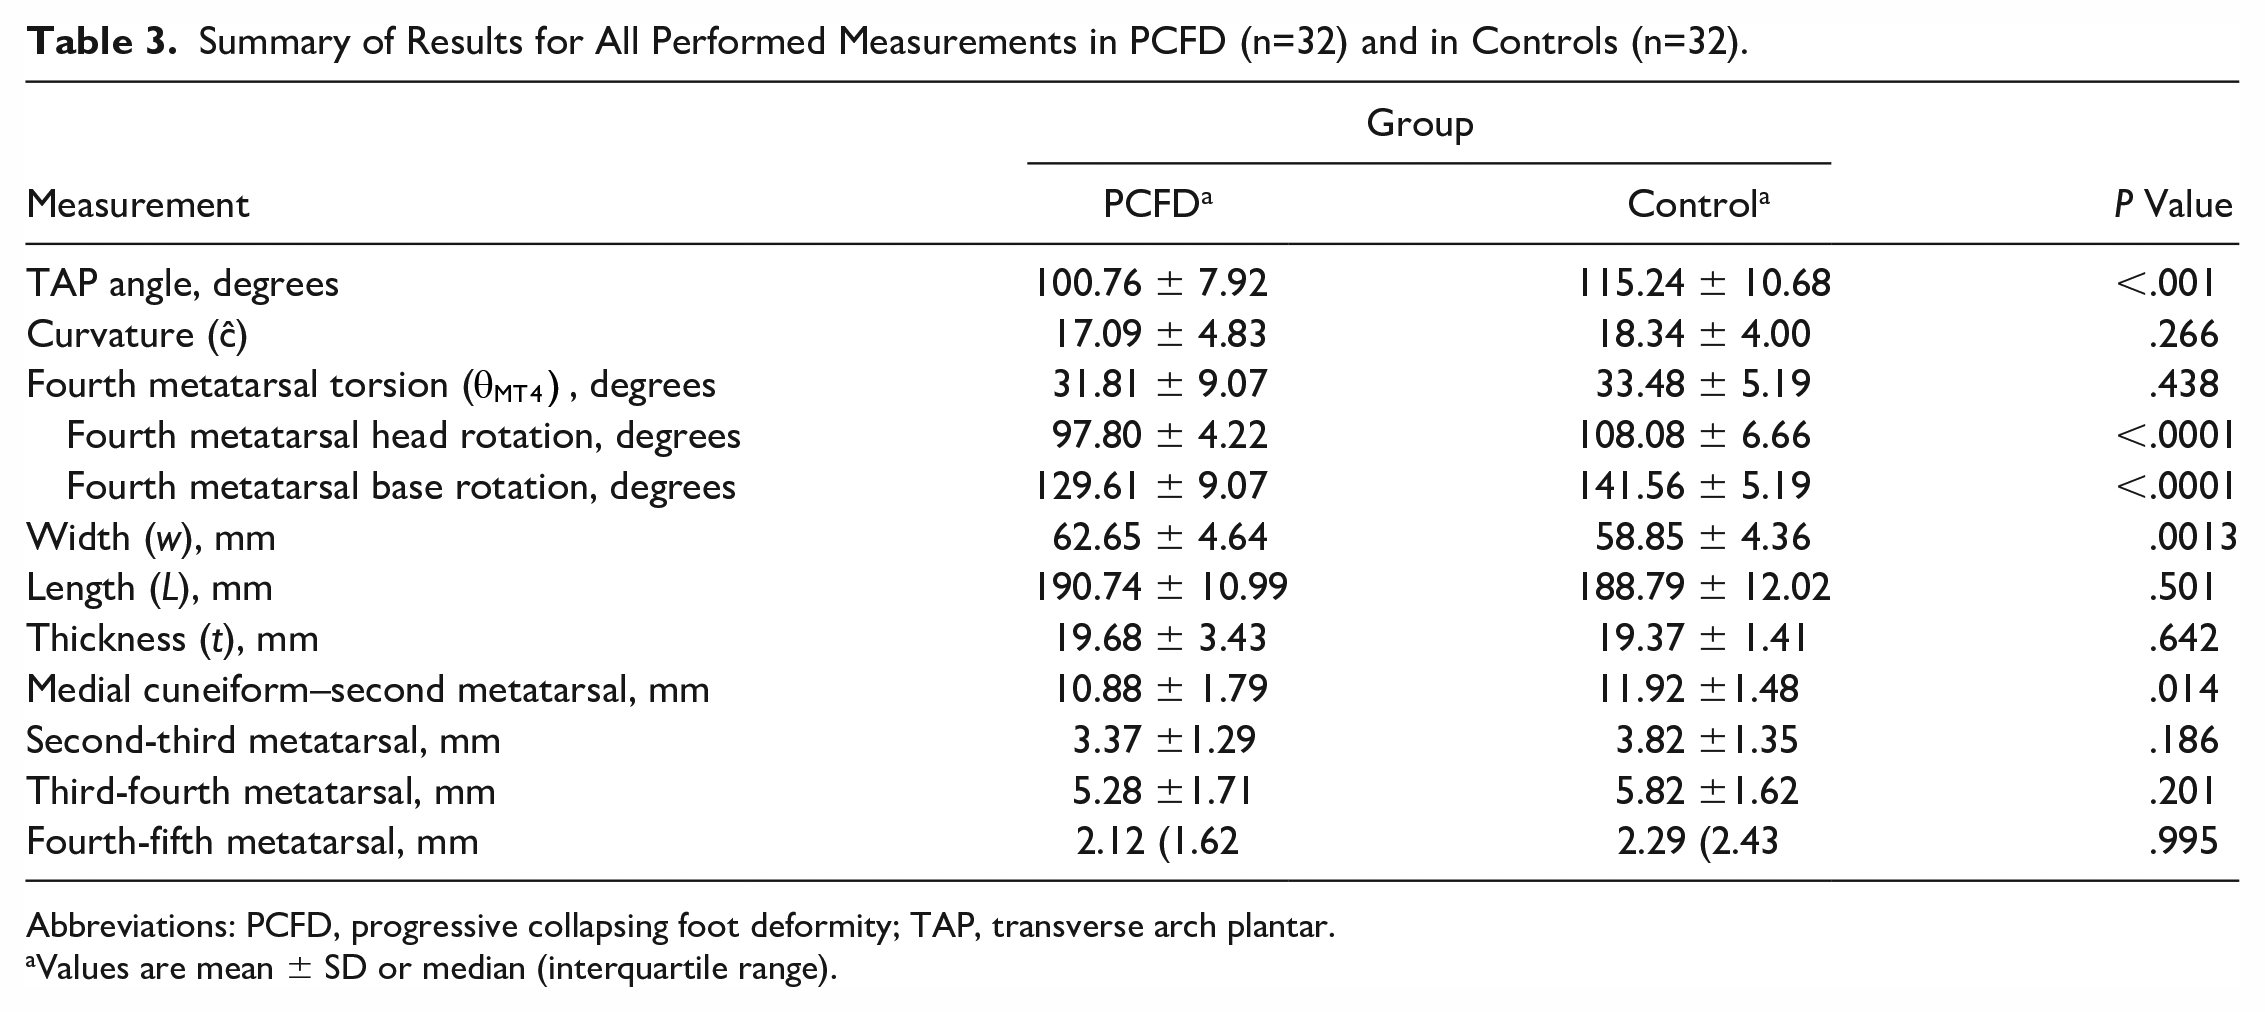
Abbreviations: PCFD, progressive collapsing foot deformity; TAP, transverse arch plantar.
Values are mean ± SD or median (interquartile range).
The patients with PCFD showed a shorter distance between the plantar first cuneiform and plantar second metatarsal with a mean distance of 10.9 mm (SD 1.8) compared to 11.9 mm (SD 1.5) for controls. All other distances showed no significant difference (Table 3).
Regarding FAO, the PCFD group had a mean value of 9.7% (SD 3.2) whereas the control group had a mean FAO value of 1.6% (SD 2.5).
Discussion
The importance of the TA has been previously demonstrated as critical to the stiffness of the foot when coupled with the MLA. 30 However, the role of the TA in PCFD, which represents a clinical collapse of the MLA, has yet to be compared to a control population using WBCT.
In our study, the TAP angle was significantly increased in PCFD patients when compared to controls. The TAP angle is a novel measurement developed to directly assess the TA where a greater TAP angle corresponds to a more collapsed arch. Therefore, we found there to be collapse of the TA in PCFD.
The FAO is a validated measurement of the relationship between the center of the ankle joint and the center of the tripod of the foot used for both normal and pathologic populations.18,20,33 Additionally, FAO values greater than 4.6% have a specificity of 100% and a sensitivity of 89.2% for diagnosis of PCFD. 19 In the present study, the PCFD group had a mean FAO value of 9.7%, suggesting that the cohort included is a true PCFD cohort. Similarly, the control group had a FAO value of 1.6%, suggesting that this cohort would not meet criteria for a PCFD diagnosis.
To more directly measure the TA, the TAP angle was designed and chosen for many reasons. First, the TAP angle is performed at the level of the Lisfranc, which most commonly corresponds to the level of the TA with the most curvature. Second, we found the TAP angle to be reproducible (Table 2) and to most directly reflect the TA curvature the authors were aiming to quantify. Third, it is a relatively simple (only 3 points) method of measuring a 3-dimensional arch. And by taking the first, second, and fifth TMTJ as landmarks, it consistently depicted the highest point at the top of the arch (second TMTJ) and the 2 lowest points on each side (first and fifth TMT). Lastly, the most plantar aspects of the TMT joints were used instead of specific points on the bones, aiming to avoid adding confusing factors to the measurements related to the shape/anatomy/arthritic findings of the bones as well any positional, rotational, and angular distortions in the tarsal bones. Overall, we found the TAP angle to be a consistent, simple, and direct 2-dimensional method to measure the 3-dimensional curvature of the TA.
Applying the formula described by Venkadesan et al,
30
the calculated curvature (ĉ) of the TA did not differ in PCFD when compared to controls. The parameters included in the equation were also found to not differ between groups. This includes MT4 torsion, as defined by the difference between the axis of the MT4 base and axis of the MT4 head. Interestingly, when examining the MT4 base and the MT4 head individually, there was a significant difference found. This suggests that, between PCFD and control, the base rotates and the head rotates, but they rotate in comparable amounts causing the difference between them (ie, MT4 torsion [
In determining where collapse occurs, we found the distance between the plantar medial cuneiform and the plantar base of the second metatarsal to be the only location along the TA that was significantly decreased. The distances for the third and fourth metatarsals were found to be similar in PCFD and in controls. Therefore, the decrease in TA curvature can be most attributed to differences seen along the medial column or between the medial and middle columns of the foot at the first tarsometatarsal and intermetatarsal space. This is in line with previous findings of first metatarsal hypermobility or medial column instability present in PCFD.1,25 A failure of the first ray stability may represent an anatomic link between the MLA and the TA collapses. Mason et al 22 anatomically described a ligament spanning from the second to the fifth metatarsal and argued this ligament as a possible reason for the stiffness of the Lisfranc complex. This ligament does not connect the first and second metatarsals and therefore does not connect the MLA to the TA. This absence may indicate a failure appoint, the point between the first and second metatarsals which allows for collapse of the TA when the MLA is collapsed. This is consistent with the mechanism proposed by Venkadesan et al, 30 where the TA couples with the MLA to significantly contribute to the passive stiffness of the foot. Taken along with our findings, a loss of this coupling at the interval between the first and second rays may result in a decrease in midfoot stiffness and the clinical outcome of a flatfoot. However, since there is an absence of longitudinal data regarding the TA, we cannot comment on whether the collapse of the TA or the MLA appears first in the pathogenesis of PCFD. Further study should work to clarify this point.
This concept of first ray mobility in contrast to the stability of the Lisfranc complex can be applied to the clinical context as well. In view of our results, TA collapse occurs mainly on the first ray, which also belongs to the MLA. When correcting for MLA collapse using the Cotton procedure or a Lapidus to plantarflex the first ray, 10 we can assume that correction of the MLA would simultaneously correct the TA collapse. Further study in this area, including comparing pre- and postoperative patients is needed to most closely investigate this proposed relationship.
Our study was not without limitations. First, there was no matching procedure although the demographics between groups were found not to be statistically significant. Second, our study proposes a novel measurement that may be susceptible to a number of biases. To overcome this, all measurements were completed independently by 2 fellowship-trained foot and ankle surgeons. Additionally, the ICCs for all measurements were found to be moderate to excellent. The novel TAP angle specifically was found to have excellent reliability (Table 2). Third, the TAP angle is an angle defined by 3 points and is not a true curvature measurement. However, this is similar to how Meary angle is used to measure the MLA.9,23 Moreover, other measurements of the TA were included in this study including a previously described estimate of TA curvature,27,30,31 as well as the distances between each bone component of the TA. Also, regarding the TAP angle, it is a 2-dimensional measure of a 3-dimensional arch and is therefore composed of points not identified in the same coronal plane. Additionally, the 3 points making up the TAP angle were in close proximity but may not have been exactly identical to the points describing the distance measurement. This discrepancy was small (eg, the most inferior aspect of the first TMTJ vs the most inferior aspect of the medial cuneiform) and were measuring different outcomes (a measurement of the TA vs a measurement of distances between bones) so was unlikely to affect the results. One difference may lie in the fact that performing this measurement at the medial cuneiform excludes the collapse that can occur at the more distal first TMTJ. However, this collapse is more related to first-ray instability than to MLA collapse, which are slightly different. Thus, our study evaluated the MLA collapse rather than the first-ray instability. Lastly, the statistical calculations completed assume independent observations whereas the PCFD and control group included some bilateral feet from the same person. Although these are not always true independent observations, the amount of bilateral feet used per group was small in both the PCFD group (3 people, 6 total feet) and in the control group (5 people, 10 total feet). We therefore believe that our statistical analysis was not erroneous.
Conclusion
Using a direct measurement of the TA, we found the TA to be more collapsed in PCFD than in controls. The overall collapse of the TA in PCFD was found to be most substantial between the medial cuneiform and second metatarsal. Given the importance of TA/MLA coupling to maintain inherent foot stiffness, collapse at this location may represent a point of TA/MLA uncoupling leading to decreased stiffness and the progressive flattening and collapse seen in PCFD.
Supplemental Material
sj-pdf-1-fai-10.1177_10711007231205298 – Supplemental material for The Role of the Transverse Arch in Progressive Collapsing Foot Deformity
Supplemental material, sj-pdf-1-fai-10.1177_10711007231205298 for The Role of the Transverse Arch in Progressive Collapsing Foot Deformity by Eli Schmidt, Matthieu Lalevée, Ki Chun Kim, Kepler Alencar Mendes de Carvalho, Kevin Dibbern, Francois Lintz, Nacime Salomao Barbachan Mansur and Cesar de Cesar Netto in Foot & Ankle International
Footnotes
Author Note
This work was performed at the Department of Orthopaedics and Rehabilitation, within the Orthopedic Functional Imaging Research Laboratory (OFIRL), University of Iowa, Iowa City, IA, USA.
Ethical Approval
Ethical approval for this study was obtained from the University of Iowa Institutional Review Board (IRB # 201912144).
Declaration of Conflicting Interests
The author(s) declared the following potential conflicts of interest with respect to the research, authorship, and/or publication of this article: Francois Lintz, MD, MS, reports grants or contracts; consulting fees; payment or honoraria for lectures, presentations, speakers bureaus, manuscript writing or educational events; support for attending meetings and/or travel; and stock or stock options from CurveBeam LLC. Cesar de Cesar Netto, MD, PhD, reports payment or honoraria for lectures, presentations, speakers bureaus, manuscript writing or educational events; and stock or stock options from CurveBeam LLC. ICMJE forms for all authors are available online.
Funding
The author(s) received no financial support for the research, authorship, and/or publication of this article.
References
Supplementary Material
Please find the following supplemental material available below.
For Open Access articles published under a Creative Commons License, all supplemental material carries the same license as the article it is associated with.
For non-Open Access articles published, all supplemental material carries a non-exclusive license, and permission requests for re-use of supplemental material or any part of supplemental material shall be sent directly to the copyright owner as specified in the copyright notice associated with the article.