
Abstract
Molecular dynamics simulations are used to study the effects of tensile loading on nucleation and subsequent growth of bcc phase in pure fcc iron. The results show that orientation variant selection occurs during the stress-induced fcc-to-bcc transformation, which leads to the coalescence of neighbouring bcc platelets with identical orientation. The bcc phase nucleates mainly following Nishiyama–Wassermann and Kurdjumov–Sachs orientation relationships with the parent fcc phase. The present simulations contribute to a better understanding of mechanisms controlling mechanically induced martensitic transformation as well as coalescence of bcc platelets in steels.
Keywords
Introduction
In recent years, the effects of external stress and strain on martensitic transformation have become a relevant topic both by experiments and by simulations [1-4]. While internal stress and strain are induced due to microstructural deformation during the martensitic transformation, external stress and strain, in turn, contribute to the face-centered cubic (fcc) to the body-centered cubic (bcc) phase transformation as well [4,5]. Thus, in steels with transformation-induced plasticity (TRIP), austenite transforms into martensite during deformation [1-3]. Previous molecular dynamics (MD) simulations by Sandoval and Urbassek [4] indicate that a tensile axial stress leads to the fcc-to-bcc transformation and lowers the transition temperature in a nanowire Fe system. Furthermore, the nucleation of bcc phase occurs in a biphasic bcc/fcc Fe crystalline at low temperatures (300 K) under an applied shear strain in MD simulations, while the unstrained system remained stable and does not transform at the time scale of around 100 ps [5]. Both enhanced strength and ductility are obtained in TRIP steels due to the strain-induced martensitic transformation [1,3,6,7]. However, the mechanisms governing the mechanically induced martensitic transformation are difficult to be revealed by experiments. In this context, MD simulations of the microstructure development under a mechanical loading may identify interesting atomistic processes that can contribute to the proposal of realistic experimental mechanisms.
It is well known that grain size affects the mechanical properties, especially the hardness and toughness, of materials. Coarsening of ferrite grains may take place through two mechanisms: by normal grain growth due to migration of grain boundaries and by the coalescence of neighbouring bcc grains with identical orientation [8]. It has been reported that adjacent platelets of martensite or bainite tend to coalesce under conditions in which they share the same habit plane and orientation relationship variant with the austenite [9-13]. Moreover, experimental results by Pak et al. [11] indicate that a tensile stress promotes the formation of coalesced bainite platelets in steels. The proposed reason is that the tensile stress reduces the number of occurring crystallographic variants, which therefore contributes to the formation of platelets with the same or close orientation. Such coalesced coarse structures may be detrimental to the mechanical properties, especially the strength and toughness, because of their low resistance to cleavage crack propagation [9,13].
In the present paper, MD simulations are used to study the effects of uniaxial tensile loading on the nucleation, growth, coarsening and coalescence of bcc grains forming in a single fcc crystal in iron at different temperatures. This study provides information on the influence of stress on the microstructural evolution during the fcc-to-bcc phase transformation in iron, which will contribute to a better control of the final structures, especially the refinement of the grains, in steels.
Simulation methods
An embedded-atom method (EAM) potential for Fe by Mendelev et al. [14] is used in the present work (see Supplementary material 1). The lattice constant of fcc iron is 3.658 Å at 0 K for this potential, which is obtained from the first-principle calculation and is slightly larger than the experimental lattice constant (3.569 Å) of fcc-iron at room temperature [15]. Besides, the elastic constant  of fcc structure based on the Mendelev potential is only
  GPa, which is too low compared with the experimental value of 77 GPa. Thus, the fcc structure based on the Mendelev potential is close to being mechanically unstable [15]. For MD simulations using this potential, the fcc phase transforms to the bcc phase automatically at or above 150 K, while no phase transformation takes place in an fcc single crystal at or below 100 K unless mechanical loading is applied externally. In spite of the mechanically unstable fcc phase, the bcc-fcc transformation energy based on the Mendelev potential equals to 0.120 eV/atom, which is quite close to the reference value (0.11 eV/atom) from density functional theory (DFT) calculation [15]. Therefore, it can be deduced that the Mendelev potential is suitable to study the thermodynamics but not the kinetics of the fcc-bcc transformation. The Mendelev potential has been successfully employed in describing the martensitic transformation in iron by MD simulations [16-18]. In particular, MD simulations based on the Mendelev potential [14] have shown that plastic deformation induces γ (fcc) → ε (hexagonal close-packed, hcp) → α′ (bcc) martensitic transformation at the bcc/fcc interfaces, which is in agreement with experimental observations using high-resolution transmission electron microscopy [17]. From previous MD simulations by Ou and Song [19], however, the intermediate ε phase does not necessarily form during mechanically induced phase transformations in an fcc single–crystal depending on the uniaxial tensile directions. A quantity of ε phase (or stacking fault) only forms when the tensile direction is along the
  direction. Comparatively, no significant ε phase is found in the fcc crystal with tensile loading along the
  or
or  direction [19].
In the present work, the simulation cell includes a single fcc crystal containing 864,000 atoms. The dimensions of the system are  (or
(or  unit cells) in the x, y and z directions. The x, y and z axes are parallel to the
  ,
,  and
and  directions, respectively. The simulation cell is first thermally equilibrated using a barostat and a thermostat of the Nosé-Hoover type at a constant temperature
  under vacuum atmosphere for 2.5 ps, which is followed by uniaxial tension along the y-
 direction at the same temperature with the strain rate
  = 0.01 ps−1 for 10 ps. No stress is applied along the x and z directions, which are allowed to relax during the uniaxial tension along the y direction. The MD time step is fixed at 0.0005 ps. Two temperatures are studied, namely 50 and 100 K, respectively. All simulations are performed assuming periodic boundary conditions in x, y and z directions, thus in absence of free surfaces. Calculations are performed with the open-source LAMMPS code [20] (see input files in Supplementary materials 2 and 3). The adaptive common neighbour analysis (a-CNA) method [21] is chosen as the discriminator in the present study to determine local crystallographic configurations. The configurations are displayed using the software OVITO [22], where atoms representing the fcc, bcc, hcp and unidentified structure are coloured in green, blue, red and white, respectively. In the simulation cell, the stress
  with the increasing overall strain in the y direction
  at a given temperature represents the stress in the corresponding direction, which is averaged over the whole system.
Results and discussion
Phase transformation process
In absence of external strain, no phase transformation takes place in the single fcc crystal at or below 100 K under vacuum atmosphere up to 50 ps. However, a tensile stress induces the fcc-to-bcc transformation in the single fcc phase at or below 100 K. Figure 1(a–d) and 1(e–h) shows the evolution of the fcc-to-bcc transformation in fcc iron with the application of external strain in the Time evolution of the structure in a slice of 3.5 Å in the  direction at 50 and 100 K, respectively. Nucleation of the bcc phase starts after a strain of 3% at 50 K, while the bcc nucleation initiates under a lower loading strain of 2.5% at 100 K. In other words, a higher mechanical energy is involved for the onset of fcc-to-bcc transformation at a lower temperature. For MD simulations using the Mendelev potential [14], the fcc phase transforms to the bcc phase automatically at or above 150 K, while no phase transformation takes place in an fcc single crystal at or below 100 K due to the energy barrier existing between the fcc and bcc phase. In order to transform to the bcc phase, the fcc phase needs to overcome an energy barrier that decreases with temperature [15]. Therefore, the onset of fcc-to-bcc transformation requires a higher driving force at a lower temperature due to the higher energy barrier. Then the bcc phase grows quickly into the fcc phase with a significant texture, as marked by the yellow rectangles in Figure 1(b,c) and 1(e,f). Those bcc grains can be divided into two parallel groups that intersect with each other. After a strain of 5%, coarsening and coalescence of bcc grains occur in both systems as the density of grain boundaries (represented by the unidentified atoms) diminishes gradually. After the application of the maximum strain of 10% studied in this work, a single bcc crystal is obtained both at 50 and 100 K, with some remaining defects locally.
 direction indicating the fcc-to-bcc transformation in fcc iron under tensile stress at: (a–d) 50 K and (e–h) 100 K. Coloursof atoms represent different phase structures: blue-bcc; green-fcc; white-unidentified; red-hcp (colour online).
Figure 2(a,b) shows the evolution of different phases in the system during the tensile deformation at 50 and 100 K, respectively. It is seen that the fraction of fcc phase decreases dramatically after a strain of around 3% at 50 K and around 2.5% at 100 K, which correspond to the critical nucleation strain for bcc phase, as illustrated by the configurations in Figure 1(a,d). After nucleation has started, the bcc phase grows rapidly and consumes the majority of the parent fcc phase within the subsequent strain of 0.5%. At 50 K, the fraction of fcc phase decreases to about 15% at a strain of 3.5% with the fraction of unidentified atoms, acting as the bcc/bcc or fcc/bcc boundaries, increasing up to 55%. At 100 K, 15% of the fcc phase remains at a strain of 3.0%, 53% has become unidentified atoms and 32% bcc phase. Therefore, large quantities of bcc/bcc and fcc/bcc boundaries are created during this period in both systems. After that, the fractions of remaining fcc and unidentified atoms gradually decrease, accompanied by a steady increase of the fraction of bcc structure. In this period, the grain boundary density gradually diminishes under the continuous loading by the coarsening of bcc grains, as seen from the randomly selected regions inside the yellow rectangles in Figure 1.
(a) and (b) Evolution of the phase fractions for the systems at 50 and 100 K,which is divided into three stages according to the applied tensile strain  , namely the A (A′), B (B′) and C (C′) stages, as marked by the dashed black (red) lines in individual figure; (c) Stress of the systems in the y direction
  at 50 and 100 K, the dashed black (red) lines correspond to that in (a) and (b), respectively; (d) stress of systems with the size of
  ,
,  and
and  unit cells (UCs) at different strain rates at 100 K; (e) and (f) distribution of shear strain of atoms in systems at 50 and at 100 K, respectively, at
  , the red colour of the colour bar represents high shear strain equalling to 0.2, while the blue colour represents zero shear strain. The stress
  at individual temperature is averaged over the whole system (colour online).
Figure 2(c) illustrates the change of the stress in the y direction  with the increasing tensile strain in the y direction
  during the nucleation and growth of bcc phase in fcc iron at 50 and 100 K. The deformation process in the individual system is divided by dashed black (red) lines into four stages, as marked by lines ‘A (A′)’, ‘B (B′)’ and ‘C (C′)’, respectively, in Figure 2(a,b). The black and red dividing lines correspond to that in Figure 2(c). In the stage before line ‘A’
  , the stress
 in the simulation cell at 50 K first increases linearly up to ∼2.0 GPa, which corresponds to an elastic energy
  meV/atom given the atomic volume
  . This linear period corresponds to the elastic deformation of the fcc structure, before which no phase transformation takes place. The onset of the transformation is followed by a sudden decrease of
  to around −6.0 GPa with a minor strain increase to 3.5% (stage between lines ‘A’ and ‘B’). The corresponding reason is that the bcc phase nucleates and grows rapidly in the fcc crystal in this period, as shown in Figure 2(a). The fcc-to-bcc transformation induces a compressive internal stress opposite to the tensile loading direction [1,3,6,7], which thus leads to the sharp decrease of
  in present study. In the following stage between lines ‘B’ and ‘C’,
  gradually relaxes because of the coarsening of bcc grains with the elimination of grain boundaries, as indicated by the decreasing fraction of unidentified boundary atoms in Figure 2(a). Finally, a single bcc crystal with local defects is obtained in the stage after line ‘C’, during which a further tensile loading counterbalances the transformation-induced stress stored in the system.
The stress  for the simulation cell at 100 K shows a similar trend to that at 50 K, except that the nucleation of bcc phase at 100 K starts at a smaller tensile loading (or a smaller critical elastic energy of 1.05 meV/atom), as indicated by dashed red line ‘A'’ in Figure 2(b). Figure 2(d) shows the stress–strain curves of fcc iron with different system sizes for strain rates ranging from 5
 107–1010 s−1 at a tensile temperature of 100 K. It is seen that system sizes have little influence on the yielding strength of fcc iron. The stress for all curves first increases linearly with the applied strain, and then drops suddenly after reaching a critical value at which the fcc-to-bcc phase transformation occurs. Sandoval and Urbassek [23] also studied the effects of different axial strain rates ranging from 1.7
 107 s−1–6.7
 108 s−1 on the bcc
 (hcp + fcc) solid–solid phase transformations in Fe nanowires by MD simulations. They found that the phase transitions take place before the elasticity is lost and smaller strain rates produce identical results within their statistical error bars. In the present study, the fcc-to-bcc phase transformation also initiates from the elastic deformation period. The phase transformation is directly correlated to the stress, which is in a linear relationship with the applied strain in the elastic regime. Besides, the critical stress at which the phase transformation starts (or the yielding strength) decreases as the strain rate decreases from 1010 to 108 s−1. Further reducing the strain rate from 108 to 5
 107 s−1 results in little change to the yielding strength of the fcc crystal, as can be seen from Figure 2(d). Similar results were also found in MD simulations of deformed fcc iron by Ou and Song [19], as well as in experimental and simulation studies of deformed Co-Ni-Fe–Al-Cu high-entropy alloys by Li et al. [24]. Besides, with the strain rate decreasing from 1010 to 5
 107 s−1 at 100 K, the critical elastic energy at the yielding point decreases from 1.05 meV to only 0.16 meV/atom. According to density-functional theory (DFT) calculation by Müller et al. [15], the energy barrier that needs to be overcome for the fcc-to-bcc transformation along the Bain path
  is less than 1 meV/atom, which is comparable to the calculated elastic energies at the yielding point in the present study.
Figure 2(e,f) shows the distribution of shear strain on atoms induced by the external strain  at different temperatures at the strain of 4.5% [22,25,26]. It is found that an externally applied strain induces a locally higher shear strain on specific planes, as indicated by the red coloured regions in Figure 2(e,f). It is known that the formed bcc phase usually has an orientation relationship (OR) with the parent fcc phase, mainly the Nishiyama–Wassermann (NW) [27] or the Kurdjumov–Sachs (KS) [28] OR, which involve a main shear in the
  direction of the
  plane [19]. Correspondingly, those red coloured regions in Figure 2(e,f) represent the
  planes. It is also noted that the overall shear strain in fcc iron at 100 K tends to be higher than that at 50 K. The reason is that the onset of fcc-to-bcc transformation starts at a smaller critical stress
  in fcc iron at 100 K than at 50 K. As the fcc-to-bcc transformation continues, the induced shear strain in individual system increases. Thus, it is reasonable that the overall shear strain of the system at 100 K is higher than that at 50 K for a given externally applied strain. A further tensile loading in the stage after lines ‘C (C’)’ in Figure 2(a–c) will lead to the growth and coarsening of bcc grains, thus the shear strain of systems induced by the fcc-to-bcc transformation is gradually released.
Additionally, the fcc phase may also transform to the bcc phase in other metals and alloys during the deformation process, whereas the transformation path may be different from that in iron [24,29-31]. For example, the MD simulations by Sun et al. [29] indicate that serial fcc bcc
bcc hcp transformations occur in ultrafine copper film when the externally applied strain along the
  direction surpasses a critical value. However, the fcc-to-bcc transformation path in copper is different from that in iron. The transformation in copper obeys the Bain path that involves lattice compression and expansion along the
  and
and  direction, respectively, while the transition in iron follows the NW/KS paths that involve shearing along the
  direction on the close-packed
  plane [32]. The first-principles calculations by Sandoval et al. [32] indicate that the variation of the stress tensor elements, and of the atomic volume, shows significant differences regarding varied phase transformation paths. The Bain path results in five times higher compressive pressures than the NW Path. Therefore, compared to the NW path, the Bain path requires additional work to accomplish the fcc-to-bcc transformation [32]. Accordingly, it can be inferred that the critical strain value for the onset of fcc-to-bcc transformation in copper is higher from that in iron.
Crystallographic orientation and coalescence process
Figure 3(a–c) shows the enlarged view of the area marked by the yellow rectangles for the simulation cell at 50 K in Figure 1(b,c). The bcc grains are either in the NW or the KS OR. It is known that there are 24 variants for the KS OR and 12 variants for the NW OR [33]. In the present study, the bcc platelets mainly follow four variants of the KS OR at 50 K, as included in Table 1, without taking into account the symmetry of the bcc lattices. Two of the bcc platelets that follow two of the four variants are marked as KS1 and KS2 as an example in Figure 3(a). The other two variants can also be seen from a view direction of Enlarged snapshots of the grain coarsening process by coalescence of bcc grains in identical orientation for the simulation cell at 50 K (a–c) and 100 K (d–f). The view direction is parallel to the The variants of the orientations for the simulation cells at 50 and 100 K, respectively. , the snapshots of which are similar to Figure 3(a) and thus will not be discussed further here. A minor number of bcc grains in the NW OR exist as thin platelets involving only three to four layers of atoms. Such bcc platelets are neighboured on their broadsides by another two platelets in the KS OR with the same variant. The intermediate bcc platelet in the NW OR shrinks until the two neighbouring bcc grains in the KS OR forming from the same variant merge into a single coarser grain.
 direction. The regions in figures (a–c) and figures (d–f) correspond to those inside the yellow rectangles in Figures 1(b,c) and (e,f), respectively. The inserted snapshot shows the atomic arrangement of the original fcc crystal. The small yellow rectangles indicate the orientation relationships between the bcc and fcc phase (see also Supplementary material 4). Colours represent different phase structures: blue-bcc; green-fcc; red-hcp; white-unidentified (colour online).
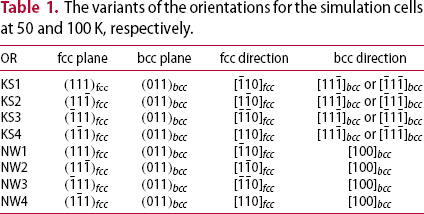
At 100 K, however, the NW OR dominates the bcc grains, as shown in Figure 3(d–f). The bcc grains mainly follow four of the 12 variants NW OR at 100 K, as included in Table 1. Two bcc grains that have two of the variants are indicated and labelled as NW1 and NW2 in Figure 3(d). Similar to the coalescence process at 50 K, two bcc grains in the NW OR merge to form a coarser grain with the elimination of the intermediate bcc platelet in the KS OR.
It is known that the NW and KS ORs are the commonly observed relations that developed between the fcc and bcc structures in experimental studies [33-36]. From previous investigations [19,34,37], the nucleation of the bcc phase inside the fcc bulk involves a Pitsch OR [38], which leads to local lattice distortion. During the subsequent growth, the bcc phase continues to form following the Pitsch distortion inside the deformed fcc phase. Thus, misorientation gradually occurs with the rotation angles in the range between 0 and 5.26° around the Distribution of shear strain of atoms on the  and
and  directions, which finally leads to a KS and NW OR between fcc and bcc phase [39]. The electron backscatter diffraction pole figures by Cayron [39] indicate that the Pitsch, NW and KS relations are continuous orientations of martensite variants and can be connected by a rotation angle ranging from 0 to 5.26° around
 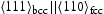 and
and  directions. Specifically, the Pitsch and NW relations are two complementary ORs, which are both 5° away from the most often reported KS OR [34]. In the present study, at both tensile temperatures of 50 and 100 K, the variants of the NW and KS ORs in Table 1 are observed during the fcc-to-bcc phase transformation. The only difference is that a larger volume of fcc matrix transforms in the KS OR at 50 K, while the majority of fcc matrix transforms following the NW OR at 100 K. The variant selection among different orientation relationships may originate from the interaction between local stress state and elastic strains accompanying the volume change on transformation under varied deformation temperatures [34,40]. This can be illustrated by the shear strain and local micro-rotations of atoms on the
  planes in both systems in Figure 4(a–d). The bcc structure transforming following the mainly observed KS OR involves a smaller shear strain and rotations than that in the NW OR at 50 K. By contrast, the bcc structure in the NW OR involves a smaller shear strain and rotations than that in the KS OR at 100 K.
 planes in systems at (a) 50 and (b) 100 K; the corresponding local (micro)rotations of atoms on the
  planes at (c) 50 and (d) 100 K. The strain in (a-d)
  equals to 4.5%, the colour bar in (a,b) represents shear strain, while that in (c,d) represents the micro rotations of atoms (colour online).
 direction according to the Schmid's rule [19,24,33,41]. There are 12 slip systems in the fcc structure. Upon a uniaxial tensile stress, there is a resolved shear stress
  acting along the slip direction on the slip plane of a specific slip system. When the resolved shear stress
  exceeds a critical value
  , the material yields at a strength
  and dislocation motion occurs. The Schmid factor can be expressed by
  . Dislocations prefer to slip for a slip system with a larger Schmid factor. Table 2 shows the calculated Schmid factors of the 12 slip systems of fcc iron with the external stress in the
  direction. It is seen that the observed orientation variants included in Table 1 agree with those slip systems that have the largest Schmid factors equalling 0.41 or −0.41 in Table 2. This phenomenon of preferred orientation selection is governed by the Schmid's law, which was also observed in other alloys under a tensile stress, for example, titanium alloys and high entropy alloys either by experiments or simulations [19,24,41]. As a consequence, the reduced number of orientation variants promotes the coalescence probability of the forming bcc platelets. Additionally, similar simulations were performed in fcc Fe and Fe-0.5%C systems (∼1.4 million atoms) using the EAM potential proposed by Meyer and Entel [42], the variant selection also takes place during the fcc-to-bcc transformation obeying the Schmid's rule (Supplementary material 5).
Schmid factors (M) on the slip systems of fcc iron for the loading in direction.


The stress-induced fcc-to-bcc transformation follows specific variants of crystallographic orientations, which leads to the formation of bcc/bcc grain boundaries in specific crystallographic orientations. The bcc grains (and grain boundaries) tend to develop forming at about ±45°with respect to the tensile direction, as can be seen from Figures 1 and 4. Variant selection was also observed experimentally in a deformed medium C (0.4 w.t.%) high Si (3 w.t.%) steel by Eres-Castellanos et al. [43], as shown in Figure 5(a–c). When the steel experiences a pure isothermal treatment, all twelve NW variants are found in the material and their fractions are similar, as can be seen from the inverse pole figure (IPF) in Figure 5(b). When the fully austenitic steel was deformed up to 10% at a strain rate of 0.04 s−1 at 400°C (the so-called ausforming treatment), bainitic transformation took place. Variant selection of the twelve NW ORs occurred during the bainitic transformation according to the electron back scattered diffraction (EBSD) images in Figure 5(c). By comparing Figure 5(c) with Figure 5(b), it can be seen that the deformed steel has significantly reduced crystallographic variants with obviously higher pole figure intensity. Besides, the deformation-induced bainitic ferrite plates are tens of nanometers in thickness and exhibited a strong alignment with specific directions, which were approximately at ±45° relative to the compression direction. Therefore, the plates intersected each other at an angle of around 90°. Similar results were observed in experiments by Pak et al. [11] where bainite platelets transformed from the austenitic phase under external stress had a strong tendency to lie at approximately 45° to the tensile stress axis. The reason is that the coalesced bcc platelets comply best with the external stress when they form at 45° to the stress direction.
(a) Microstructure of a medium C (0.4 w.t.%) high Si (3 w.t.%) steel after ausforming treatment at 400°C; (b) inverse pole figure (IPF) ferrite map of a reconstructed parent austenite grain with pure isothermal treatment; (c) IPF map of ferrite with respect to compression direction (top) and  pole figure (bottom) for the sample in (a). Figure (a–c) originates from Ref. [43].
Conclusions
The present paper studies the effects of tensile loading on the fcc-to-bcc phase transformation in pure iron. Simulations show that the fcc-to-bcc transformation can be induced by an external tension at or below 100 K for a single fcc crystal. The forming plate-like bcc grains prefer to form in few dominant orientations with specific variants, which conform with the Schmid's rule. The KS OR dominates the bcc platelets at 50 K while the NW OR is dominant at 100 K. Besides, the external tensile loading contributes to grain coarsening by the coalescence of neighbouring bcc platelets with identical orientation. Similar to experimental studies, the bcc grains tend to lie about ±45° relative to the external tensile direction. The present study indicates that the crystallographic orientation and the grain size of the bcc phase forming from fcc iron are sensitive to the external loading direction, which might provide an alternative design strategy to control the microstructure and mechanical properties of steels.
Footnotes
Acknowledgements
The research leading to these results has received funding from the European Research Council under the European Union's Seventh Framework Programme FP7/2007-2013/ERC grant agreement [No. 306292] and National Natural Science Foundation of China [No. 51901248].
Disclosure statement
No potential conflict of interest was reported by the author(s).