
Abstract
Eye tracking in smooth pursuit eye movement (SPEM) tasks requires an interplay of slow (smooth pursuit) and saccadic eye movements. The precision of target tracking by SPEMs is most commonly measured on the basis of gain, that is, defined as the ratio of eye velocity to target velocity. In the case of sinusoidal movement of the target, it is usual to measure peak gain, measured during the fastest episodes of SPEM. The majority of studies found lowered gain in schizophrenia patients [1–6], which suggests a defect in SPEM in this group of patients. By contrast, there are no such clear findings in depressive patients, and, what is more, the methods applied are not consistent. On the one hand, reduced gain was observed at constant stimulus velocity [3] and reduced gain and increased saccades were observed with sinusoidal stimulus movement [7]. On the other hand, normal gain was also described at constant stimulus velocity [8] as well as a normal signal-to-noise ratio with sinusoidal stimulus movement [9]. Findings in depressive patients are also inconsistent with regard to possible changes caused by therapy. On the one hand, there were no changes in SPEM performance measured in the form of gain and number of saccades with sinusoidal stimulus movement [10]. On the other hand, the finding that the SPEM performance estimated by experts with sinusoidal movement is improved by antidepressive therapy, and must thus be regarded as a state factor in depressive patients [11], contrasts with this.
Deficits of smooth pursuit are corrected by means of catch-up saccades (CUS: fast eye movements towards the target when the eyes lag behind). In healthy subjects it was shown that CUS planning incorporates both position error (mismatch between stimulus position and direction of view) and velocity error (mismatch between stimulus speed and eye movement speed) [12]. One of the few results for position error and velocity error in psychiatric clinical patients demonstrates on the basis of infrared oculography that schizophrenia patients tolerate a higher velocity error before saccades [13]. Impaired processing of movement information in schizophrenia was concluded from this and from measurements of perception threshold for differences in speed [14–17].
The aim of the present study was to ascertain whether deficits in processing localization information and/or movement information are involved on a group-specific basis in an impairment of SPEM in schizophrenic patients compared with depressive patients and healthy controls. Peak gain was recorded as a common measure of eye tracking performance and as an expression of an impairment of SPEM. The main target variables measured were position error and velocity error in intervals before CUS, that is, during a time interval of SPEM in which there is an increased need for correction. If there are error variable abnormalities in one of the study groups, they should hence occur more distinctly in the time intervals under examination than in periods far from a CUS. These pre-saccadic intervals were divided into 50 ms intervals in order to examine the error variables and possible group differences over time.
A sinusoidally moving target at different frequencies, between 0.2 and 0.7 Hz, was used in this study. In previous studies, eye tracking readings were found to be correlated with stimulus frequency [18], possibly to a different extent in patients and in controls [8]. Use of a single stimulus frequency (usually 0.4 Hz) would mask a possible dependence of SPEM abnormalities on frequency.
Methods
Subjects
A total of 61 male subjects took part in the investigation. The three study groups consisted of 21 inpatients with schizophrenia, 19 inpatients with non-psychotic major depressive disorder, and 21 healthy controls (male nurses and physicians). A total of 24 schizophrenic and 19 depressive patients were included. Three schizophrenia patients dropped out because they withdrew their consent to continue in the study. There were no dropouts among the depressive patients. Diagnoses were based on DSM-IV [19]. The mean age of the remaining subjects was 34.4 years (SD = 8.3) in the schizophrenic patients, 36.8 years (SD = 12.2) in the group of depressive patients and 37.8 years (SD = 5.9) in the control group. The three groups did not differ in age (F(2,58) = 0.77, p = 0.47). All subjects were right-handed. Examinations were conducted approximately 1 week after admission, so the patients were still in the acute phase of their illness. All schizophrenia patients were on neuroleptics during testing. They received either risperidone (average 5.5 mg day−1), olanzapine (average 13 mg day−1), clozapine (average 225 mg day−1) or sertindole (average 16 mg day−1). One patient was stabilized on haloperidol (10 mg day−1). The patients with major depression received a selective serotonin re-uptake inhibitor (sertraline average 100 mg day−1, paroxetine average 20 mg or fluoxetine average 20 mg day−1) or a tricyclic antidepressant (amitriptyline average 120 mg day−1).
The present study was approved by the ethics committee of the Medical University of Graz. All patients and controls gave their signed informed consent.
Eye tracking measurement
Eye movements were recorded with a CHARTR ENG device, version 2.1, from ICS Medical, Schaumburg, IL, USA. This device allowed a total of 200 s of sinusoidal tracking measurement per session at a sampling rate of 120 samples per second. This one session daily corresponded to the patience and concentration span of acute psychotic patients. Therefore, subjects were tested five times on consecutive days using the identical test procedure in order to collect a sufficient amount of valid tracking data. All measurements were performed between 09.00 hours and 11.00 hours in a dimly lit and silent room.
The moving target was displayed on a horizontal array of red light-emitting diodes that was mounted 125±2.5 cm in front of the subject's head. The height of the subject's seat was adjusted in order to eliminate any vertical disparity between the target display and the subject's eyes. During the actual measurement, the subject's occiput was held in place by a semicircular head rest. The eye tracking stimulus was a red light dot that moved ±17° horizontally in a sinusoidal shape at six different frequencies: 0.2, 0.3, 0.4, 0.5, 0.6, and 0.7 Hz. Three cycles of each frequency followed consecutively in order of rising frequency (i.e. three cycles at 0.2 Hz, three cycles at 0.3 Hz, and so on). This sequence was repeated four times during each test session. Electrode drift was eliminated by a digital high-pass filter using fast Fourier transformation with a cut-off frequency of 0.1 Hz. In order to rule out filter artefacts, each test session was supplemented with one 0.2 Hz cycle at the beginning and one at the end of the measurement, which were excluded from analysis after raw data filtering. Eye-blink artefacts were identified by their specific picture on both horizontal and vertical electro-oculography (EOG) and then corrected manually. The first cycle of each triplet was excluded from the calculations because properties of SPEM performance after a sudden target frequency change might differ from those during maintenance of smooth pursuit [20, 21], and the present study was focused on performance during maintained smooth pursuit.
SPEM measures
We considered three variables: peak gain, position error before CUS, and velocity error before CUS. Each of the three variables was calculated as a global value from the pool of measurements from all stimulus frequencies and, on the other hand, separately for each individual stimulus frequency. On the basis of the readings, a comparison was made between patients with schizophrenia, patients with depression, and healthy controls. In order to draw conclusions regarding frequency dependence of the measures, we examined gain, position error and velocity error in each of the subject groups with regard to whether their values changed when stimulus frequency changed.
Peak gain
Smooth pursuit peak gain was calculated using software that was shipped with the ENG device. This algorithm compared the velocity of the stimulus over its fastest 250 ms of each individual sinus oscillation with eye movements over the same period, computing gain from these values. In order to ensure that only smooth pursuit and no saccades were measured, movements >15° s−1 faster than the stimulus, and entire cycles with phase shifts >3° leading or >20° lagging were automatically eliminated from gain calculations by the software. Gain calculations were performed both over the entire stimulus frequency range (‘global’) and separately for each individual stimulus frequency. The global gain was calculated for each subject by determining the median of all gains from each session and then determining the median of all medians for all five tests. In order to present the results in tabular and graphical form, the group median was calculated from the medians of the members of each of the three subject groups. The gains of the individual distinct stimulus frequencies were computed in the same way, albeit incorporating only the periods of time of the respective frequency into the calculations.
Position error and velocity error
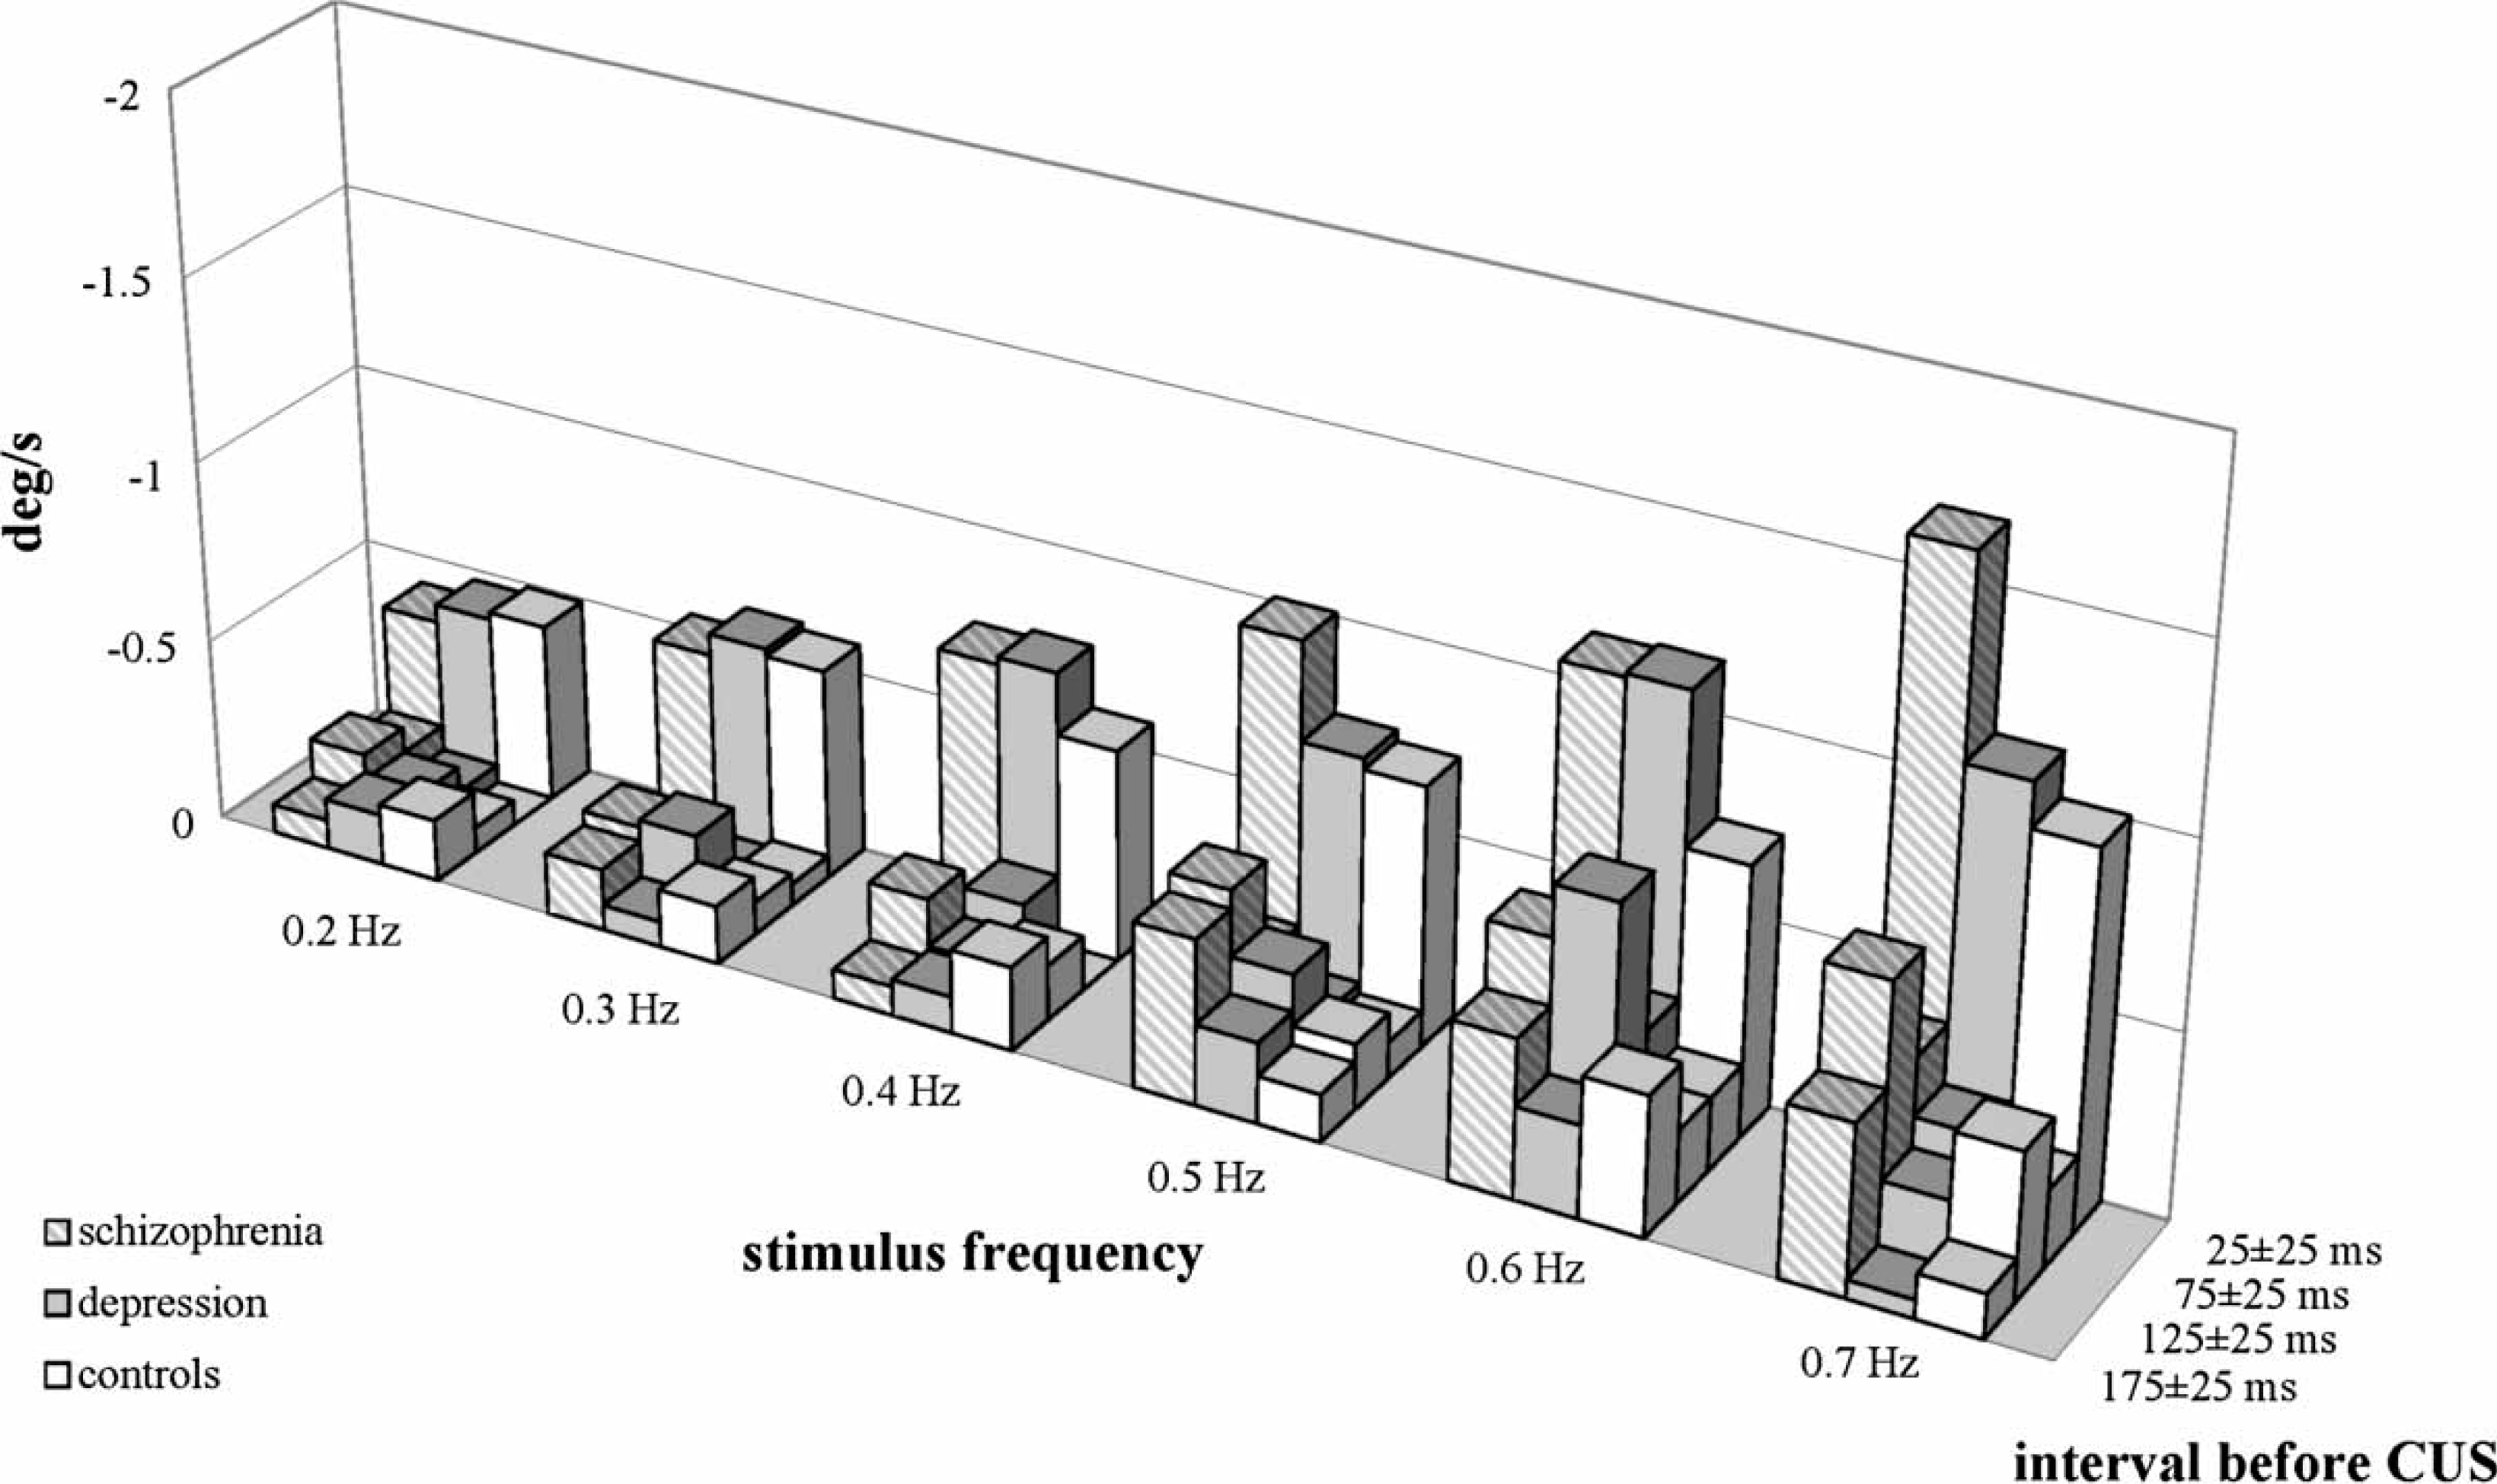
These were investigated in intervals by observing smooth pursuit over a total length of 200 ms before a saccade in order to better ascertain any possible group differences that become increasingly clear toward the CUS. Following Ross et al.[22] and de Brouwer et al.[23], we opted for 50 ms intervals and divided the 200 ms sections into 175±25 ms, 125±25 ms, 75±25 ms, and 25±25 ms before CUS. On the basis of the findings of de Brouwer et al. and Keller and Johnsen, according to which the time interval 100 ms before the CUS is relevant for a prediction of CUS amplitude from the value of position error and velocity error [23, 24], the interval 100 ms±25 ms before CUS was also investigated. As with the peak gain analyses, position error and velocity error were also calculated over the entire stimulus frequency range (‘global’) and separately for each individual stimulus frequency. The medians were calculated in the same way as for peak gain.
For saccade identification and analysis, software was used that was developed in our own lab. Following the definition proposed by Ross et al.[22], an entity was defined as a saccade if it met the following conditions: both a minimum speed of the eye of 35° s−1 and an initial acceleration >2000° s−2. We had an EOG device with a sampling rate of 120 s−1, which is why initial acceleration was measured over the interval of 1/120 s. In addition, we introduced the criterion of a minimum amplitude of 1°, according to the measuring accuracy of the EOG method [25]. Subsequently, in order for a saccade to be regarded as a CUS, it must (i) have the same direction as the target movement and begin after the target; and (ii) either end after the target or (if the saccade has overtaken the target) the post-saccadic position error may not exceed. 50% of the pre-saccadic position error [22].
Statistical analysis
Prior to statistical analysis, the distributions of all variables were tested for normal distribution using Kolmogoroff–Smirnoff-tests. Because none of the investigated variables was distributed normally, non-parametric methods were used. All comparisons of the three subject groups with each other were performed with Kruskal-Wallis tests, and the associated post-hoc comparisons with Dunn's tests. Performances at different stimulus frequencies within the same subject group were compared with Friedman tests. If they were significant, post-hoc trend tests were performed according to Page in order to verify whether the measuring quantities increase or decrease as stimulus frequency increases. A resampling procedure was applied on position error and velocity error data in order to control the familywise error rate. All calculations used SPSS version 12.0 (SPSS, Chicago, IL, USA), and R version 2.5 (http://www.r-project.org). All statistical tests were performed at the 5% alpha level.
Results
Peak gain
A comparison of gain in the three subject groups (Table 1; Figure 1) showed that the schizophrenia patients had a lower gain than the other two subject groups in a global calculation over the entire stimulus frequency range.
Gain.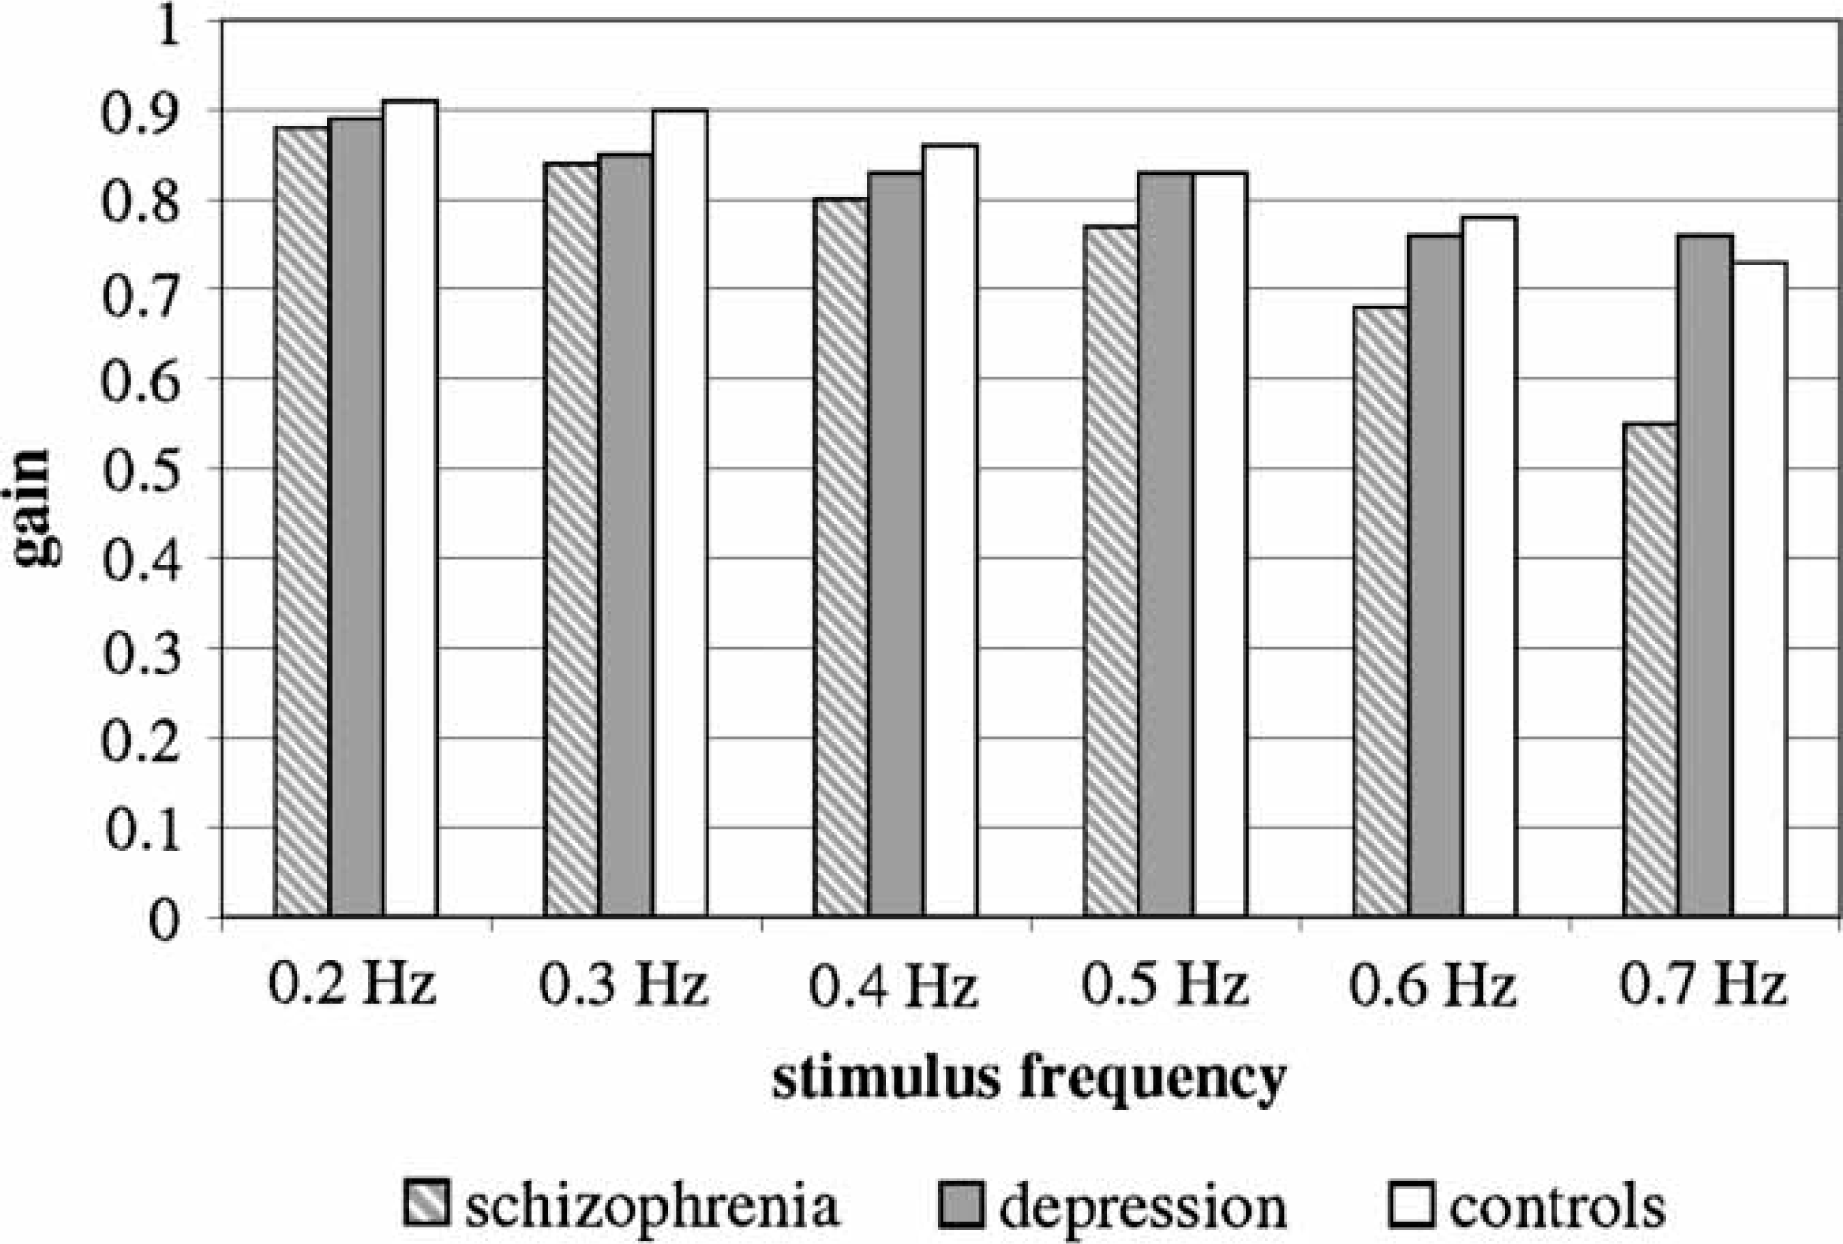
Median peak gain
aSchizophrenia patients differ from controls (Dunn's post-test); bschizophrenia patients differ from depressive patients (Dunn's post-test); †increase in gain with increasing stimulus frequency (Page's trend test).
The breakdown into separate stimulus frequencies showed that this result occurred only for a stimulus frequency of 0.5 Hz. Below that level, at 0.4 and 0.3 Hz, the schizophrenia patients differed only from the controls. At 0.2 Hz there was no difference between the groups at all.
A comparison of gains at increasing stimulus frequency within each separate subject group showed a decrease in gain with increasing stimulus frequency in each of the three subject groups.
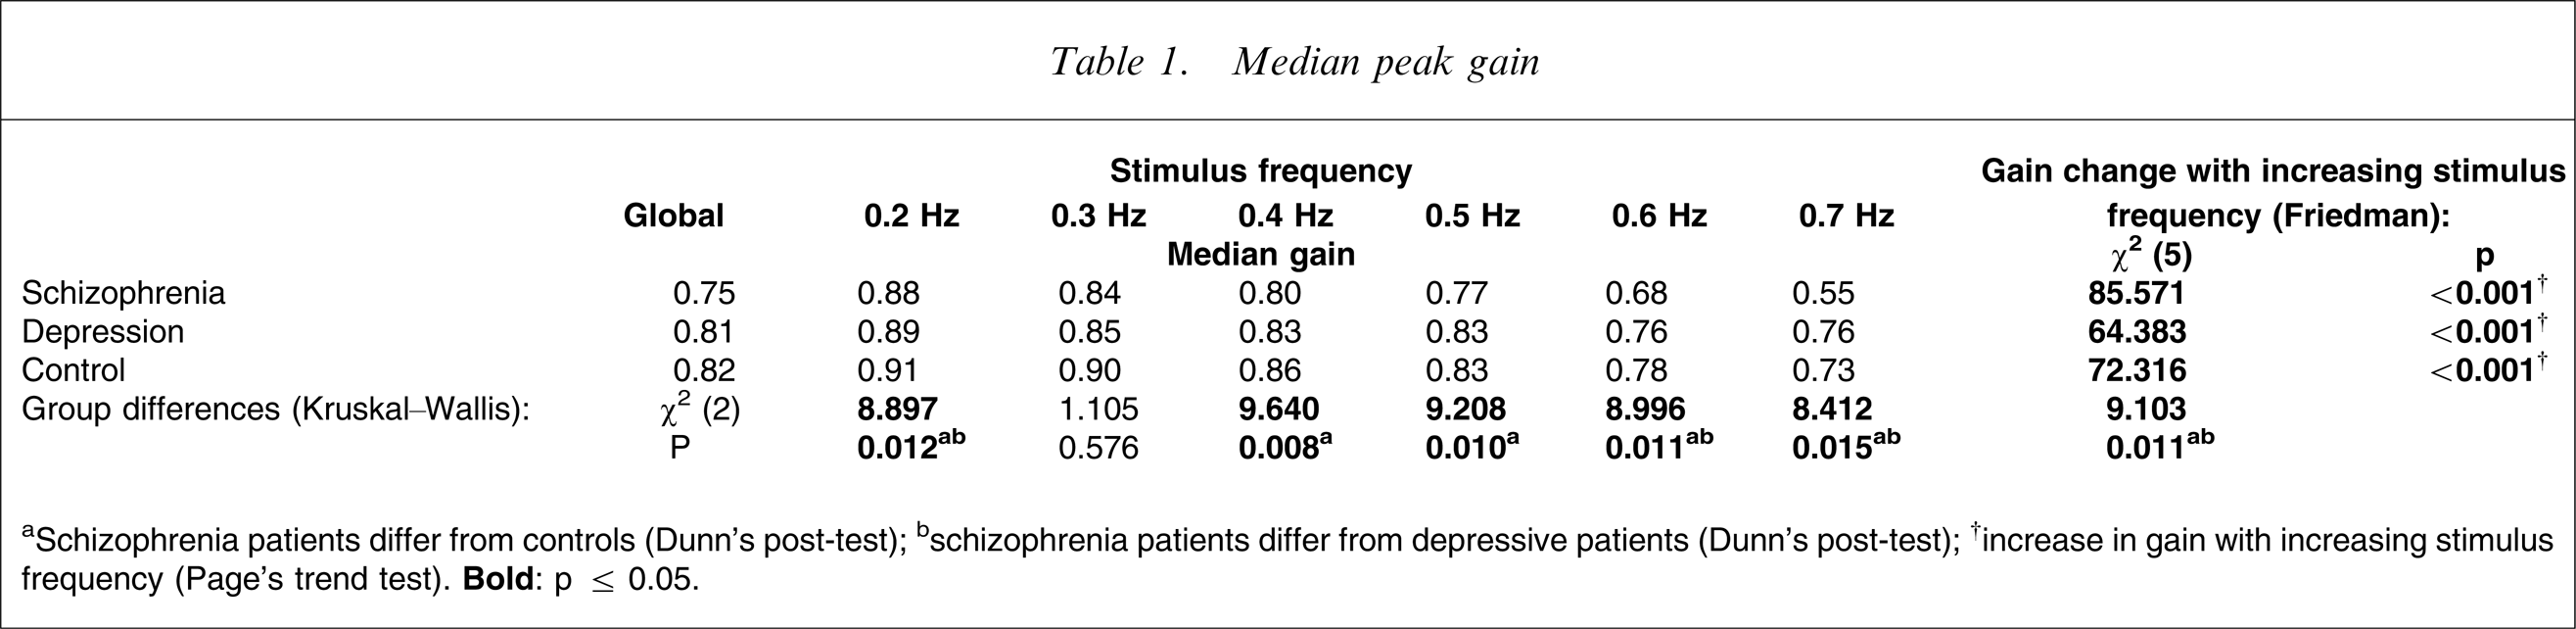
Position error and velocity error
As mentioned in a previous section, only saccade-free 200 ms-long smooth pursuit sections before CUS were used to calculate position error and velocity error. Such suitable smooth pursuit sections were localized before 1935 of a total of 2373 CUS of schizophrenia patients, before 1351 of a total of 1659 CUS of depressive patients, and before 961 of a total of 1178 CUS of the controls. Hence, 81.5% of all CUS and their 200 ms sections were usable. These sections under scrutiny constituted 2.2% of the total smooth pursuit time. The number of these 200 ms sections under scrutiny was distributed evenly over all stimulus frequencies from 0.2 to 0.7 Hz (χ2=0.84, p > 0.5).
Position error
CUS, catch-up saccade; PE, position error; SPEM, smooth pursuit eye movement. aSchizophrenia patients differ from controls (Dunn's post-test); bschizophrenia patients differ from depressive patients (Dunn's post-test); †increase in absolute PE with increasing stimulus frequency (Page's trend test).
A comparison of position errors in each individual subject group in each individual interval before the CUS at increasing stimulus frequencies (Table 2) indicated a systematic result only in the interval immediately before the CUS. Position error increased with increasing stimulus frequency in the interval 25±25 ms before the CUS in each of the three subject groups.
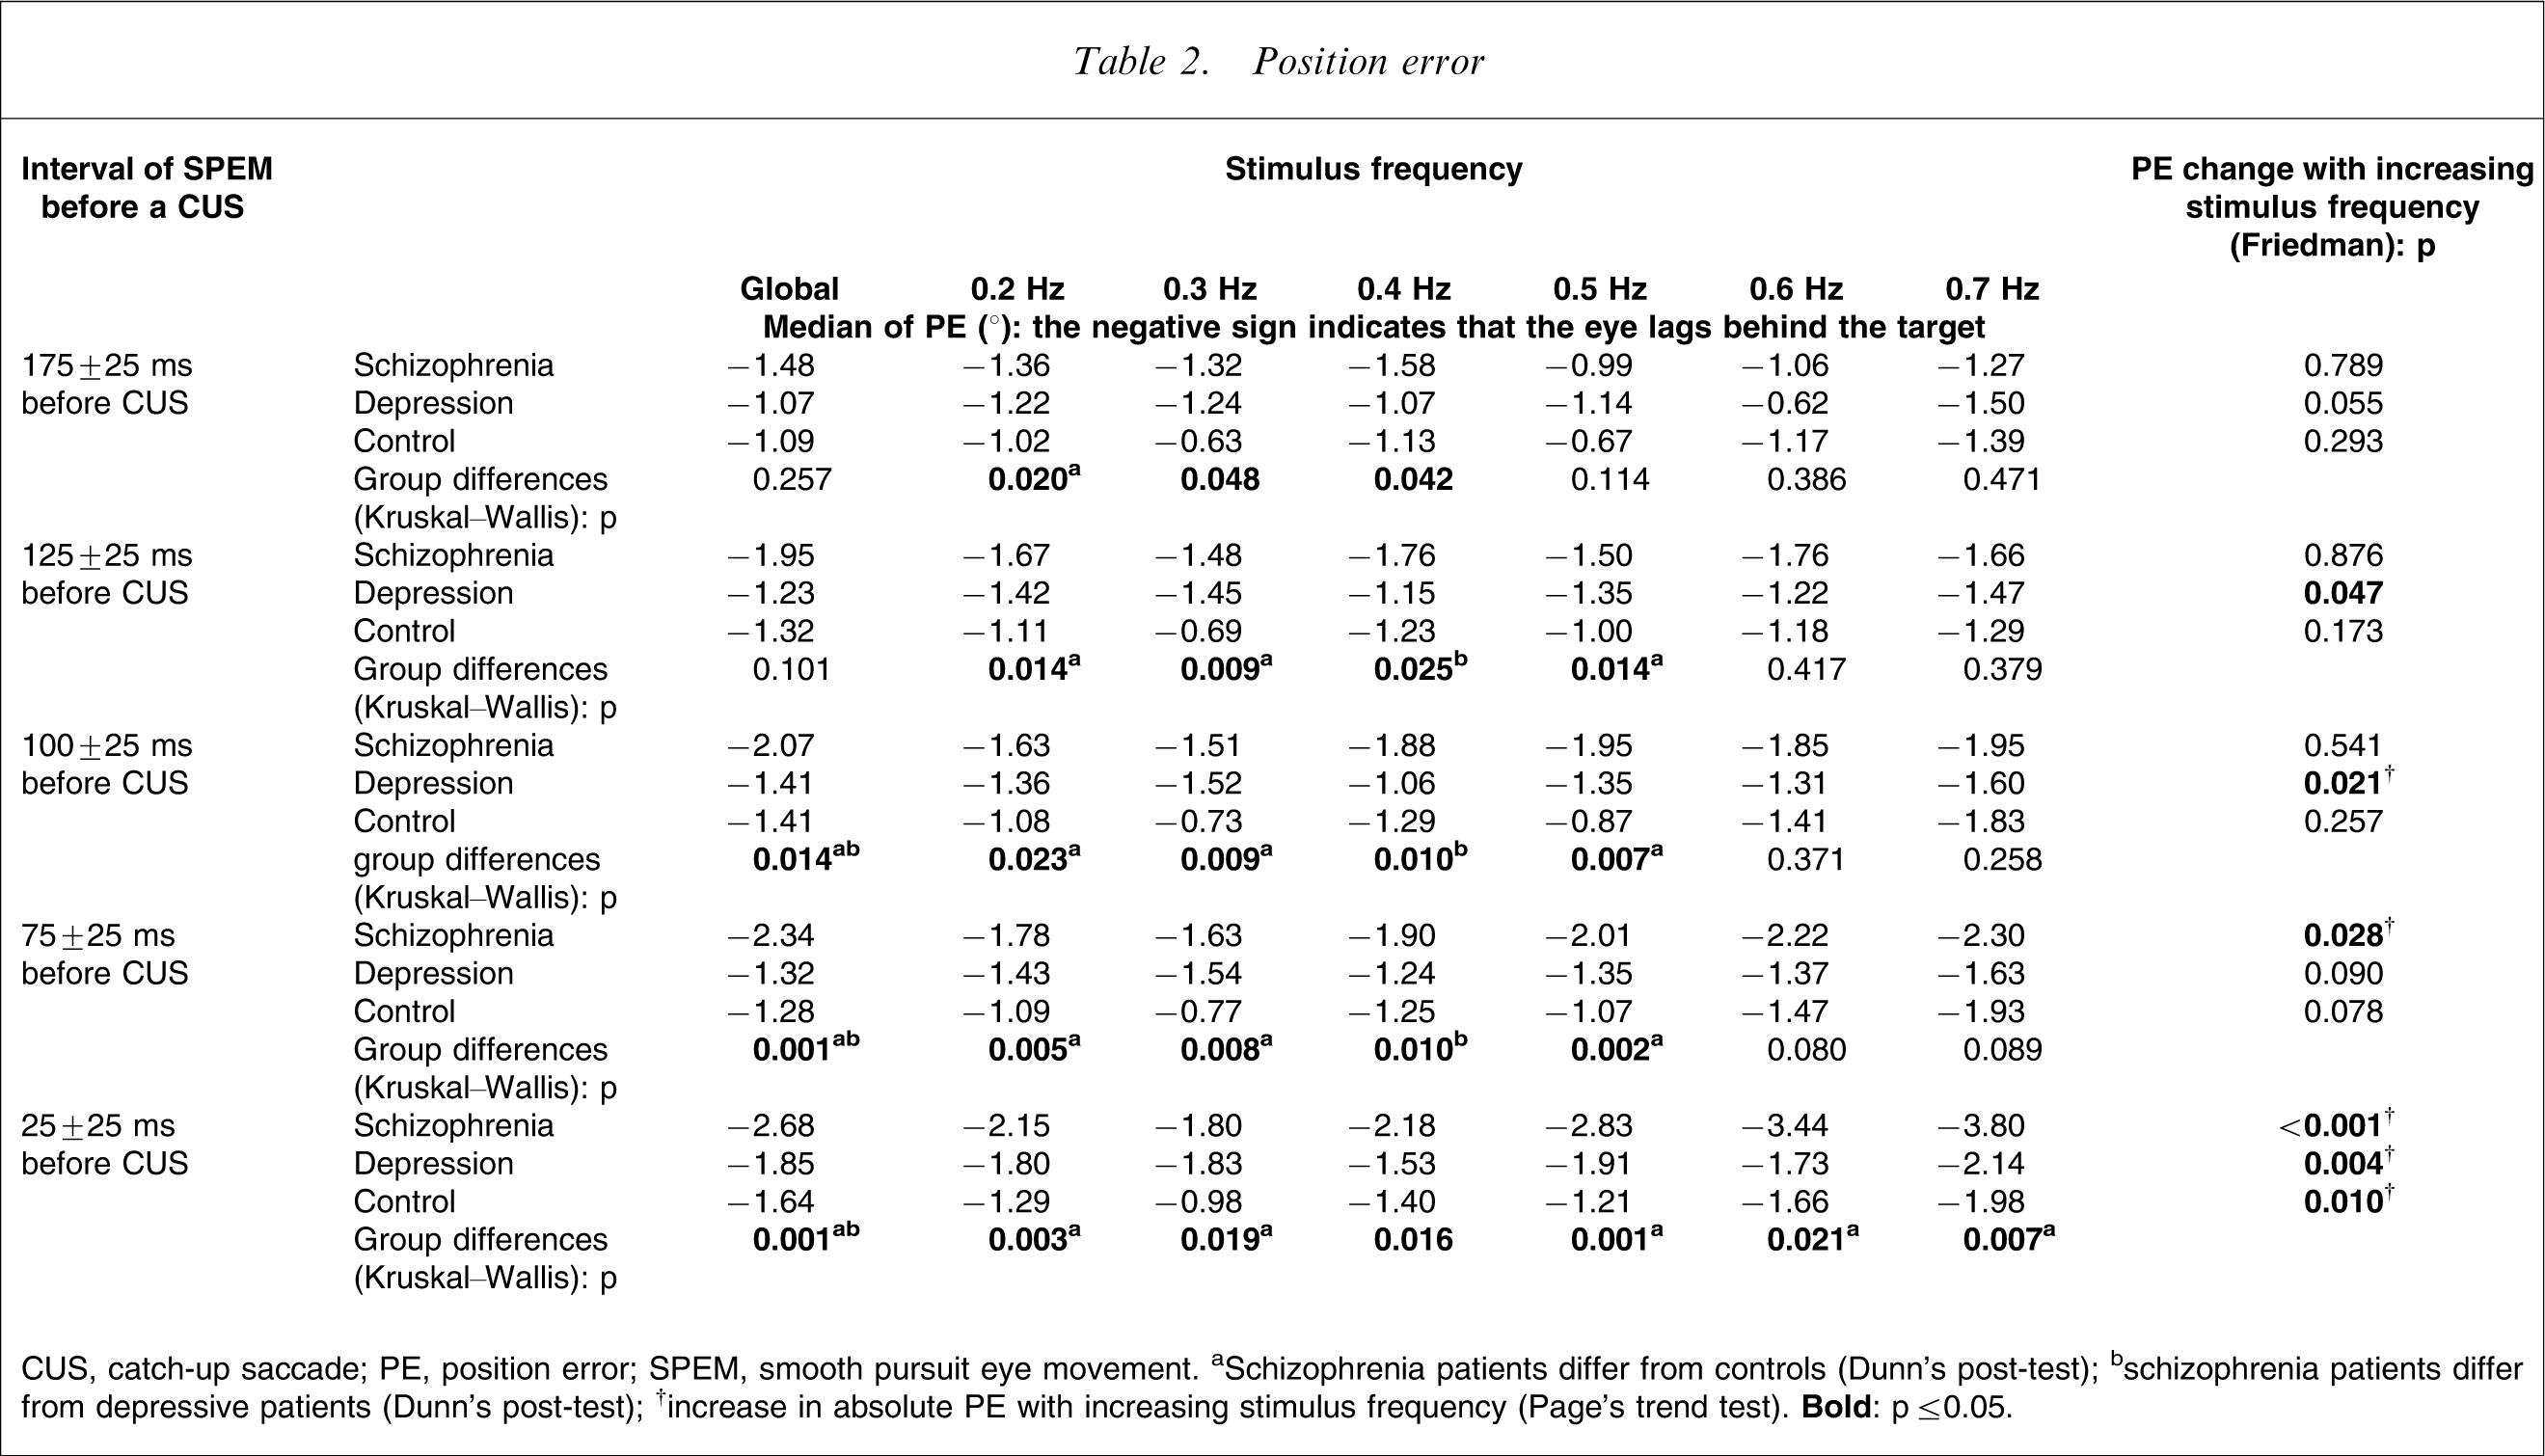
Velocity error
CUS, catch-up saccade; SPEM, smooth pursuit eye movement; VE, velocity error. aSchizophrenia patients differ from controls (Dunn's post-test); bschizophrenia patients differ from depressive patients (Dunn's post-test); †increase in absolute VE with increasing stimulus frequency (Page's trend test).
In a comparison of velocity errors at increasing stimulus frequency per subject group in each of the selected intervals (Table 3), velocity error was observed to increase in the schizophrenia patients with increasing stimulus frequency in each of the five intervals under scrutiny. There were no systematic results in the depressive patients. In the controls, velocity error was found to increase with increasing stimulus frequency from the 100±25 ms interval up to the CUS. Figure 2,Figure 3 provide a quick overview of the complex pattern of results of the three subject groups at the different stimulus frequencies and at the different intervals before CUS.
Position error. Velocity error.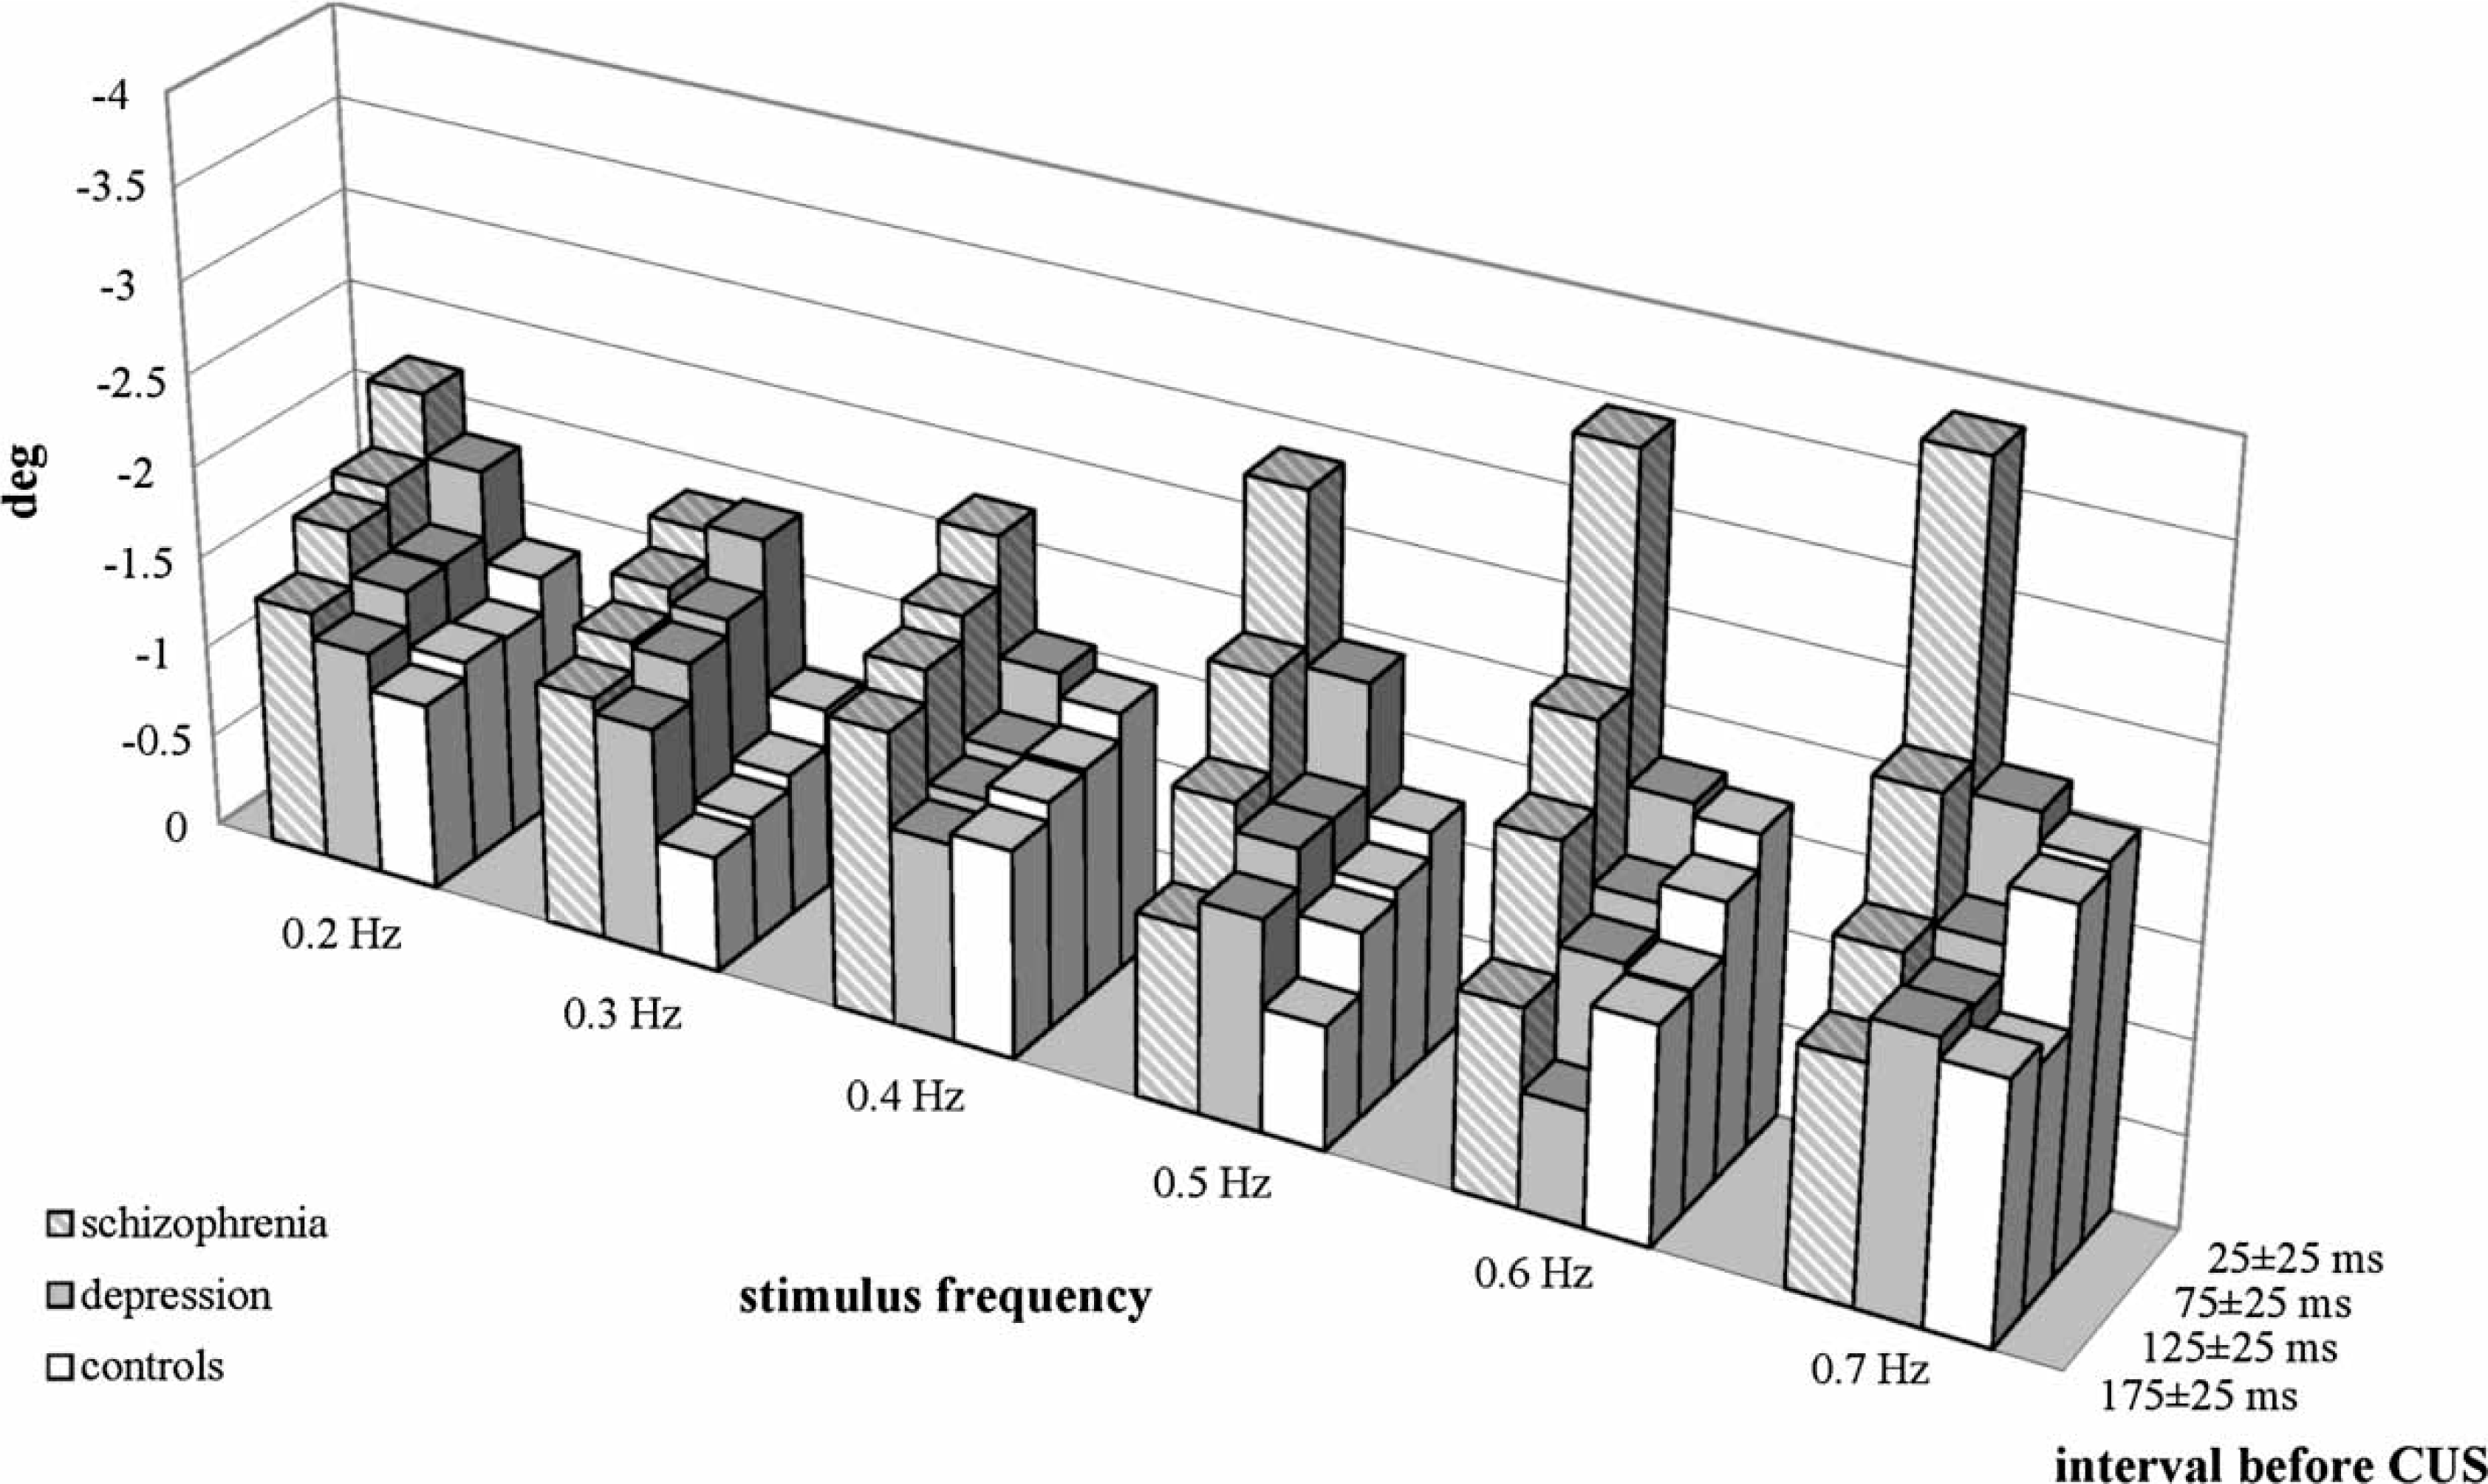
Discussion
Our finding of reduced gain in schizophrenia patients is in line with the majority of the SPEM literature. By dividing the investigation into individual stimulus frequencies, it was possible to show that there were no differences between groups at low stimulus frequency and that the schizophrenia patients achieved a lower gain than the controls as stimulus frequencies increased. At even higher stimulus frequencies, the schizophrenia patients also achieved lower gains than the depressive patients. For all three subject groups, however, gain decreased with increasing stimulus frequency, which correlates with the results of Mather et al.[18]. The present subjects thus displayed an extent of impaired eye movement that is consistent with the literature.
With regard to position error and velocity error before the CUS, systematic results were evident mainly for position error, but hardly for velocity error. In a global calculation over the entire stimulus frequency range there was an increased position error starting from the interval 100±25 ms before the CUS in schizophrenia patients. The interval at 100 ms before the CUS was described as being of particular relevance in terms of saccade planning [23, 24]. Velocity error increased only immediately before the CUS in this global calculation in the present schizophrenia patients, that is, after saccade planning was already completed. The following conclusion could be drawn from this fact: either schizophrenia patients tolerate or require a greater position error in order to plan a CUS and to execute it 100 ms later, or the saccade is planned with the same position error as in healthy subjects, but in schizophrenia patients this results in a latency of >100 ms between planning and the delayed start of the CUS. This also means that there would be a period between saccade planning and the interval 100±25 ms before the CUS in schizophrenia patients. Position error would increase in this period. This would mean that position error in schizophrenia patients would have to be higher than in the controls in the interval 100±25 ms before the CUS, particularly at higher stimulus frequencies. This was, however, not the case with the present data, on the contrary, the differences of position error between the subject groups became smaller as stimulus frequency increased. This contradicts the assumption of an increased latency between planning and execution of CUS in schizophrenia. For internally guided saccades and anti-saccades, in contrast, it had been shown that saccade latency is increased in schizophrenia [26, 27]. Although there were differences of position error between the subject groups, it proved to be only weakly dependent on frequency, with the exception of the interval of the last 50 ms immediately before the CUS. In this interval, however, when saccade planning has long taken place, all three subject groups displayed an increase in position error as stimulus frequency increased. We do not have any conclusive interpretation of this. The particularly large frequency-dependent increase of position error in schizophrenia patients 25±25 ms before the CUS could be one of many phenomena of impaired tenacity in this disease [28]. In the depressive patients we found no indication of eye tracking disorder for position error, as was also the case for gain.
In contrast to position error, there were hardly any differences of velocity error between the three subject groups. Velocity error, however, was more dependent on the stimulus frequency, most distinctly in the schizophrenia patients. This was the case in all of the intervals investigated. This could indicate that movement information processing is more susceptible to disruption than localization information processing in the course of increasing stimulus frequencies. And this would be all the more pronounced in schizophrenia.
Position error and velocity error are processed independently of each other. Both always occur conjointly in smooth pursuit. This is why it is difficult to find experimental paradigms with which it is possible selectively to ascertain the influence of one or the other on smooth pursuit. In the present study, in contrast, we investigated in a clinical context whether schizophrenia patients display a selective abnormality in terms of position error and velocity error. Indeed, it was shown that there were distinct differences between groups in terms of the extent of position error, while there were hardly any with regard to velocity error, and also that velocity error was more dependent on stimulus frequency than position error. Bearing in mind their simultaneous occurrence, this indication of a functional difference of position error and velocity error gives cause to assume that position error and velocity error are coded via two different neuronal systems. On the basis of studies of velocity perception and position perception, other authors have arrived at similar assumptions, namely that different processing mechanisms are responsible for position information and for velocity information [29, 30], and that position and velocity perceptions are encoded in different anatomical pathways. The middle temporal area (area MT) may be responsible for velocity information processing [31–34] and the superior colliculus may be responsible for position information processing [35, 36].
Are schizophrenia patients characterized by deficits in processing localization information or rather by movement information? Findings of increased velocity error tolerance in schizophrenia patients in the literature were not confirmed in the present study. Rather, the present schizophrenia patients had hardly any abnormalities in terms of velocity error, while they did display an increased position error compared with the controls. We take this latter fact as evidence that schizophrenia involves either an increased position error tolerance or an impairment of processing localization information (or both). Although the comparison of groups did not produce any evidence of deficient velocity processing in schizophrenia patients, the increase in stimulus frequency did increase velocity error in a more consistent manner in the schizophrenia patients than in the depressive patients and controls. Parallel to this, peak gain, also a measure of deviation in velocity, decreased substantially in the schizophrenia patients as stimulus frequency increased. Both of these findings indicate that velocity processing is impaired by increasing stimulus frequency, particularly in schizophrenia.
Limitations
The present sample size was small, but the differences between the subject groups based on gain correspond to the results described in the literature and thus indicate that the sample size is adequate. At the times of testing the patients were on medication. It was not homogeneous; but neuroleptic therapy does not influence SPEM performance in subjects with schizophrenia [10, 37], unless after years of continuous medication [38]. SPEM dysfunction has proven to be stable over time [39, 40] and is not correlated with measures of psychopathology [5, 10, 41, 42]. This, in turn, suggests that this is a biological marker with trait-like characteristics. What is more, smooth pursuit performance seems to be independent of subject age and intelligence [42]. It could further be argued that the three subject groups exhibit different cognitive functioning, which could possibly influence results. There are, however, suggestions in the literature that cognitive performance does not play a role with regard to predictive smooth pursuit tasks [5, 42] as in the present study. In addition to the patients’ cognitive impairment, staying power in the acute stage of the disease may also be expected to be diminished. This would affect the patient's ability to focus on their task and possibly impair SPEM performance. In order to counter this limitation, the measurements were divided among short sessions that took place on five consecutive days.
Conclusion
The depressive patients did not differ from the healthy controls, while schizophrenia patients are characterized by abnormalities in localization information processing, to a lesser extent in movement information processing. Processing of movement information in schizophrenia, however, seems to be sensitive to an increase in stimulus velocity. The following implications can be drawn from the present results. The changes of position error in schizophrenia require that the role of the superior colliculi be integrated into the complex models of smooth pursuit [33, 43]. In view of the deteriorating velocity error with increasing stimulus velocity, the question is whether this observation might be related to the attenuation of processing speed that exists in acute schizophrenic psychosis [44].
Given the existing impairments of SPEM performance in schizophrenia, there is a question of which coping mechanisms are activated. Existing gain control mechanisms [43] could possibly be used to a greater extent. Whether the changes in localization information processing and movement information processing are in fact the result of an impairment caused by the schizophrenia, whether this is a biological marker, or whether they are due directly to a genetically anchored change, for example in the sense of an endophenotype [45–47] could be clarified only by further studies.