
Abstract
The burden of disease associated with alcohol-related problems is considerable. In Australia alcohol alone accounts for 4.9% of the total burden of disease in Australia [1]. Despite a minimum legal purchase age of 18 years, alcohol is particularly problematic in young adults (15–24 years of age) and is the second most common cause for burden of disease and injury in this age group [1, 2].
Adolescents tend to adopt high-risk patterns of alcohol use and have limited knowledge or skills to minimize alcohol-related harm [3, 4]. As such, the harm experienced by young people resulting from alcohol use is relatively high and mainly acute. Approximately four in 10 young people aged between 14 and 19 years placed themselves at risk of acute harm in the last year, with approximately 17% putting themselves at risk at least monthly, and 9% at least weekly [5].
The high prevalence rates of alcohol consumption along with the harm experienced by teenagers highlight the need for prevention in this area. Meta-analyses have shown small effect sizes for alcohol prevention programmes in schools [6], but these findings are contentious [7, 8]. If the focus of prevention efforts for alcohol use is on harm reduction and related outcomes as opposed to abstinence or delayed use, prevention effects do appear to be more sizable [9–21]. Even so, despite the existence of effective prevention programmes, the effectiveness of school-based prevention has been significantly hampered by implementation in field trials [22].
To allow for optimal programme implementation of harm minimization in routine practice, prevention programmes need to be more user friendly, curriculum based, commercially attractive [23] and not require significant training or resources. The innovative Clinical Management and Treatment Education (CLIMATE) Schools model (www.climateschools.tv) appears to provide what is required. The CLIMATE Schools model was developed from the collaborative efforts of a number of health and education professionals as well as teachers and students from the secondary schools system. All Climate Schools courses are computerized cartoon-based interactive programmes that are embedded within the Personal Development, Health and Physical Education (PDHPE) curriculum and meet set outcomes of the syllabus. The computerized delivery allows for standardized, complete and correct programme delivery with minimal training and effort [24].
To establish the efficacy of the Climate Schools: alcohol module, a cluster randomized controlled trial was conducted in 16 high schools in Australia (n=1466) [25]. Eight schools were randomly allocated to the computerized prevention programme (n=611) and eight schools to their usual classes (n=855). The main outcome measures tested were changes in alcohol knowledge, alcohol use, alcohol-related harm, and alcohol expectancies. Results at 12 months after the intervention indicated that the Climate Schools: alcohol module was more effective for all students than usual PDHPE classes in increasing alcohol-related knowledge and decreasing positive expectancies about alcohol. In terms of alcohol use, the computerized programme was effective in decreasing average alcohol consumption and the frequency of binge drinking (drinking in excess), and alcohol-related harm for girls only. No behavioural effects were found to be significant for the boys [25].
The aim of the present study was to successfully implement the Climate Schools: alcohol programme into another group of Sydney schools. The importance of cross-validation in prevention research has been noted by various researchers including by Bry [26], who stressed that without it, we cannot know if a programme can be generalized to new settings, or therefore make an impact on a larger scale [26, 27]. The results of the present cross-validation trial are presented.
Method
Design
To demonstrate the efficacy of Climate Schools: alcohol module, a cluster randomized controlled trial was utilized. Schools were randomly assigned to either the intervention condition, in which students received the Climate Schools programme in Year 8; or to the control condition, in which students received their usual PDHPE classes over the year. Questionnaire data were collected from all students on three separate occasions: before, immediately after, and at 6 months follow up. Students from the control schools completed the same pattern of assessments.
Climate intervention schools
The Climate Schools: alcohol intervention had a harm minimization approach and consisted of six 40 min lessons aimed at decreasing alcohol misuse. Each lesson includes two sections: the first is a 15–20 min computer-based lesson and the second consists of class activities. Details of the content contained in each lesson are outlined in the Vogl et al. study [25]. The computer-based material for each lesson can be viewed at www.climateschools.tv.
Control schools alcohol education
The control schools in the study received their usual PDHPE classes over the year. All schools except one received syllabus-based alcohol and drug education during the year. The programmes used by schools were social influence programmes based on harm minimization strategies.
Participants
Information and consent forms were sent home to parents/guardians of students, and only those who consented were involved in the study. A total of 764 students from Year 8 were recruited from 10 Sydney independent schools. At baseline the participant mean age was 13.08 years (SD=0.58) and 60% were male. Five schools (n=397: 55% male) were randomly allocated to the Climate Schools (intervention) condition, and five schools (n=367: 65% male) were randomly allocated to the control condition.
Measures
A self-report questionnaire was administered to all students. The questionnaire measured knowledge, alcohol consumption (frequency, quantity and bingeing), positive expectancies about alcohol, patterns of alcohol use, and harm associated with alcohol use. Student data were linked over time using a unique identification code adapted from the School Health and Alcohol Harm Reduction Project (SHAHRP) [18, 28].
Demographics
Sociodemographic information of the students was measured to determine the equivalence of the two conditions. This was a brief questionnaire that requested participant gender, age, and average school grades.
Alcohol knowledge
The knowledge questionnaire was adapted from the SHAHRP ‘Knowledge of Alcohol’ and included 16 items assessing student's knowledge of alcohol. Students were asked to indicate if each statement was ‘true’, ‘false’, or whether they ‘don't know’. The SHAHRP knowledge index had good reliability (α=0.73) [28].
Alcohol consumption
The alcohol consumption questionnaire was adapted from the SHAHRP ‘Patterns of Alcohol’ survey instrument and included three items measuring (i) frequency of consumption over the past 3 months; (ii) quantity of consumption in standard drinks over the past 3 months; and (iii) frequency of consuming above low-risk levels for occasional consumption in the past 3 months [4]. The SHAHRP alcohol consumption index had good test–retest reliability over time (r=0.84) [28].
Alcohol-related harm
Alcohol harm was measured using the SHAHRP survey instrument reflecting harm experienced from student's own use of alcohol. Five items were eliminated from the scale due to low variance in both the SHAHRP study [18] and the initial testing of the Climate Schools: alcohol module [29], leaving 12 items in total. Respondents had to indicate on a 6-point scale, how many times they had experienced each harm in the past 12 month (0, 1, 2, 3–4, 5–11, 12+). The type of harm varied in nature and ranged from ‘how many times were you sick after drinking’, to ‘how many times did you get into a physical fight with someone because you were affected by alcohol?’ to ‘how many times did you get into trouble with your parents because of your drinking?’. The SHAHRP alcohol-related harm index had good internal consistency (α=0.90) and test–retest reliability (α=0.89).
Alcohol-related expectancies
Expectancies in relation to consumption of alcohol was measured using the Alcohol Expectance Questionnaire–Adolescent form (AEQ-A) [30]. Due to time constraints the present study used only one of the seven scales within the AEQ-A. This was scale 2, which was termed ‘alcohol can enhance or impede social behaviour’. This scale was chosen on the basis that Christiansen et al. found this scale to have the highest concurrent, predictive and discriminant validity for alcohol consumption and related problems, and accounted for the majority of predictive variance at a 1 year follow up [31]. Scale 2 was also chosen because research has found that alcohol consumption is best predicted by scales that measure alcohol expected effects on social behaviour [31–34]. Items included statements such as ‘Drinking alcohol makes people more friendly’, and ‘drinking alcohol creates problems’. Students had to respond with either ‘true’ or false’.
Results
Baseline equivalence, attrition and differential attrition
Of the 764 students who completed the survey at baseline the follow-up rate was 69% immediately after the intervention and 62% at 6 month after the intervention. Figure 1 represents the number and percentage of students in each group over time.
Flow chart of recruitment and participation of schools. †Percentages in comparison to those who completed surveys at baseline. Repeat surveys represent students with data at baseline and the further testing occasion. Linked surveys represent students with a complete set of data for all time points subsequent to baseline.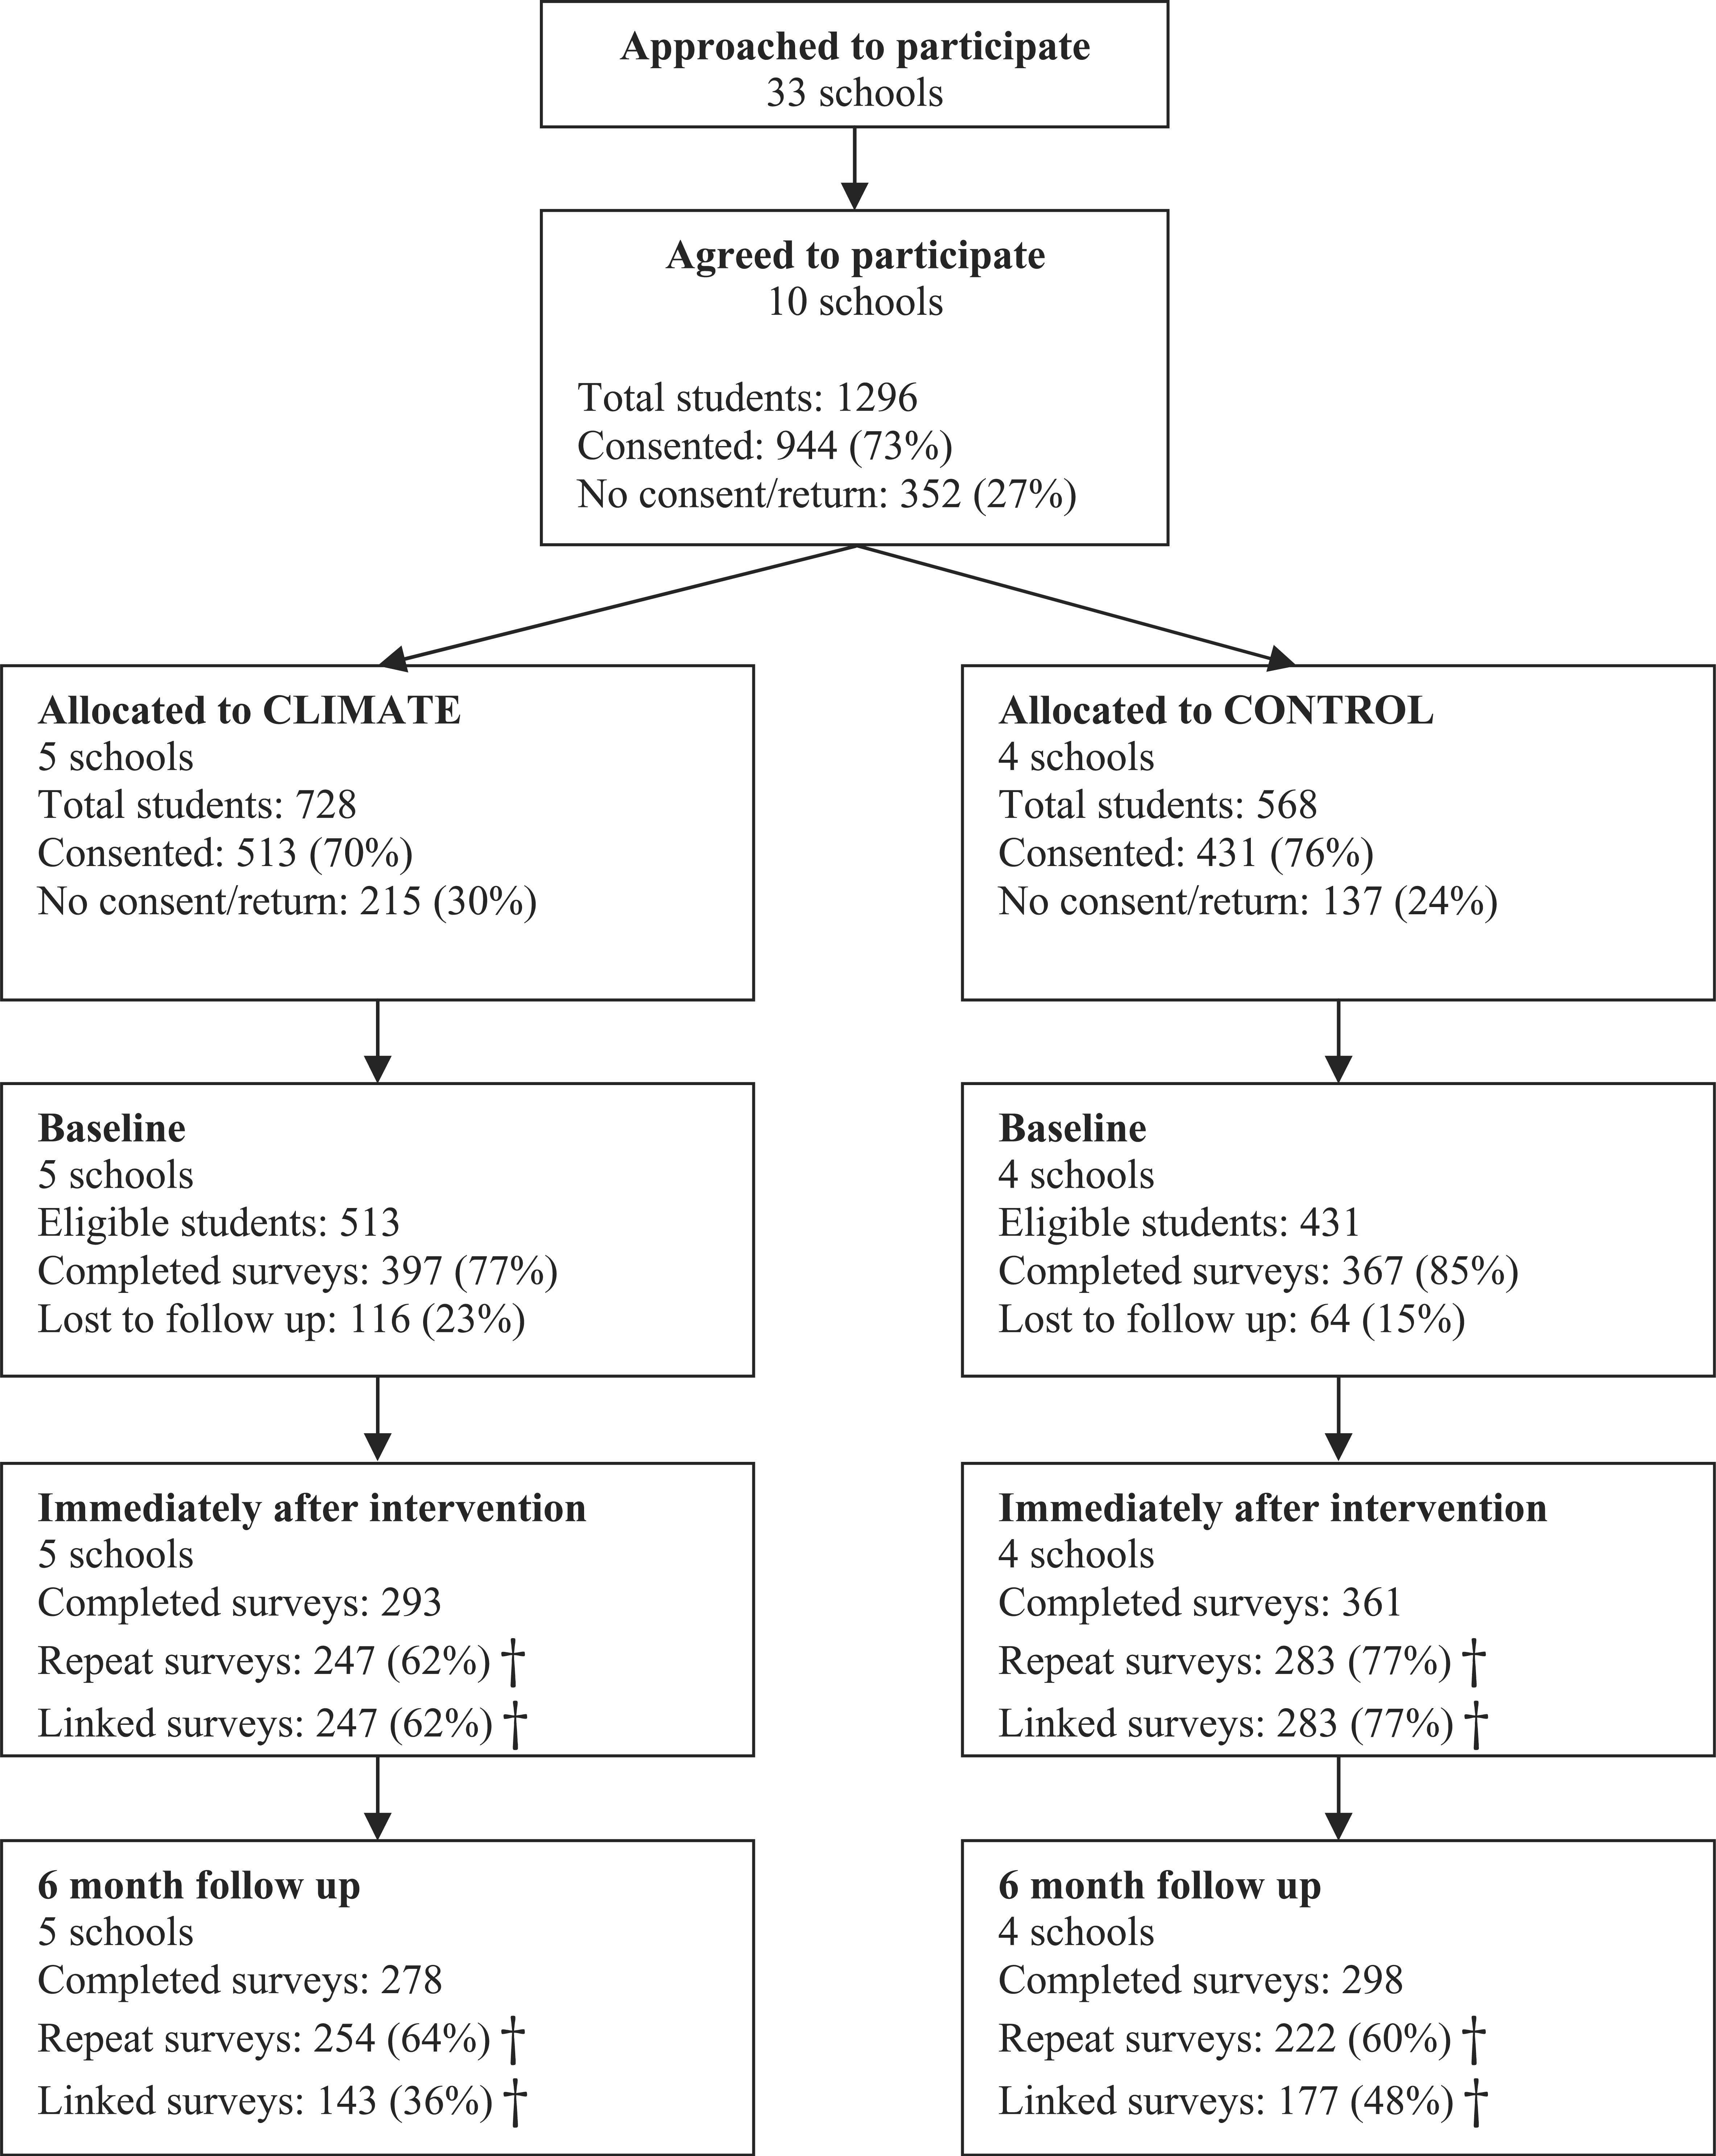
Baseline equivalence and attrition between groups were examined using a series of one-way analysis of variance for normally distributed data, χ2 test for binominal data, and Mann–Whitney U-test for non-normally distributed data.
At baseline there was a significant difference in the proportion of boys and girls in the Climate and control groups (χ2(1)=8.729, p<0.05), with a significantly greater proportion of boys in the control versus Climate group, 65% and 54%, respectively. No differences in academic grades were observed between groups at baseline (F(1,759)=0.93, p=0.34). Table 1 provides the mean scores for the Climate and control groups for all outcome measures for each survey occasion.
Student outcome data
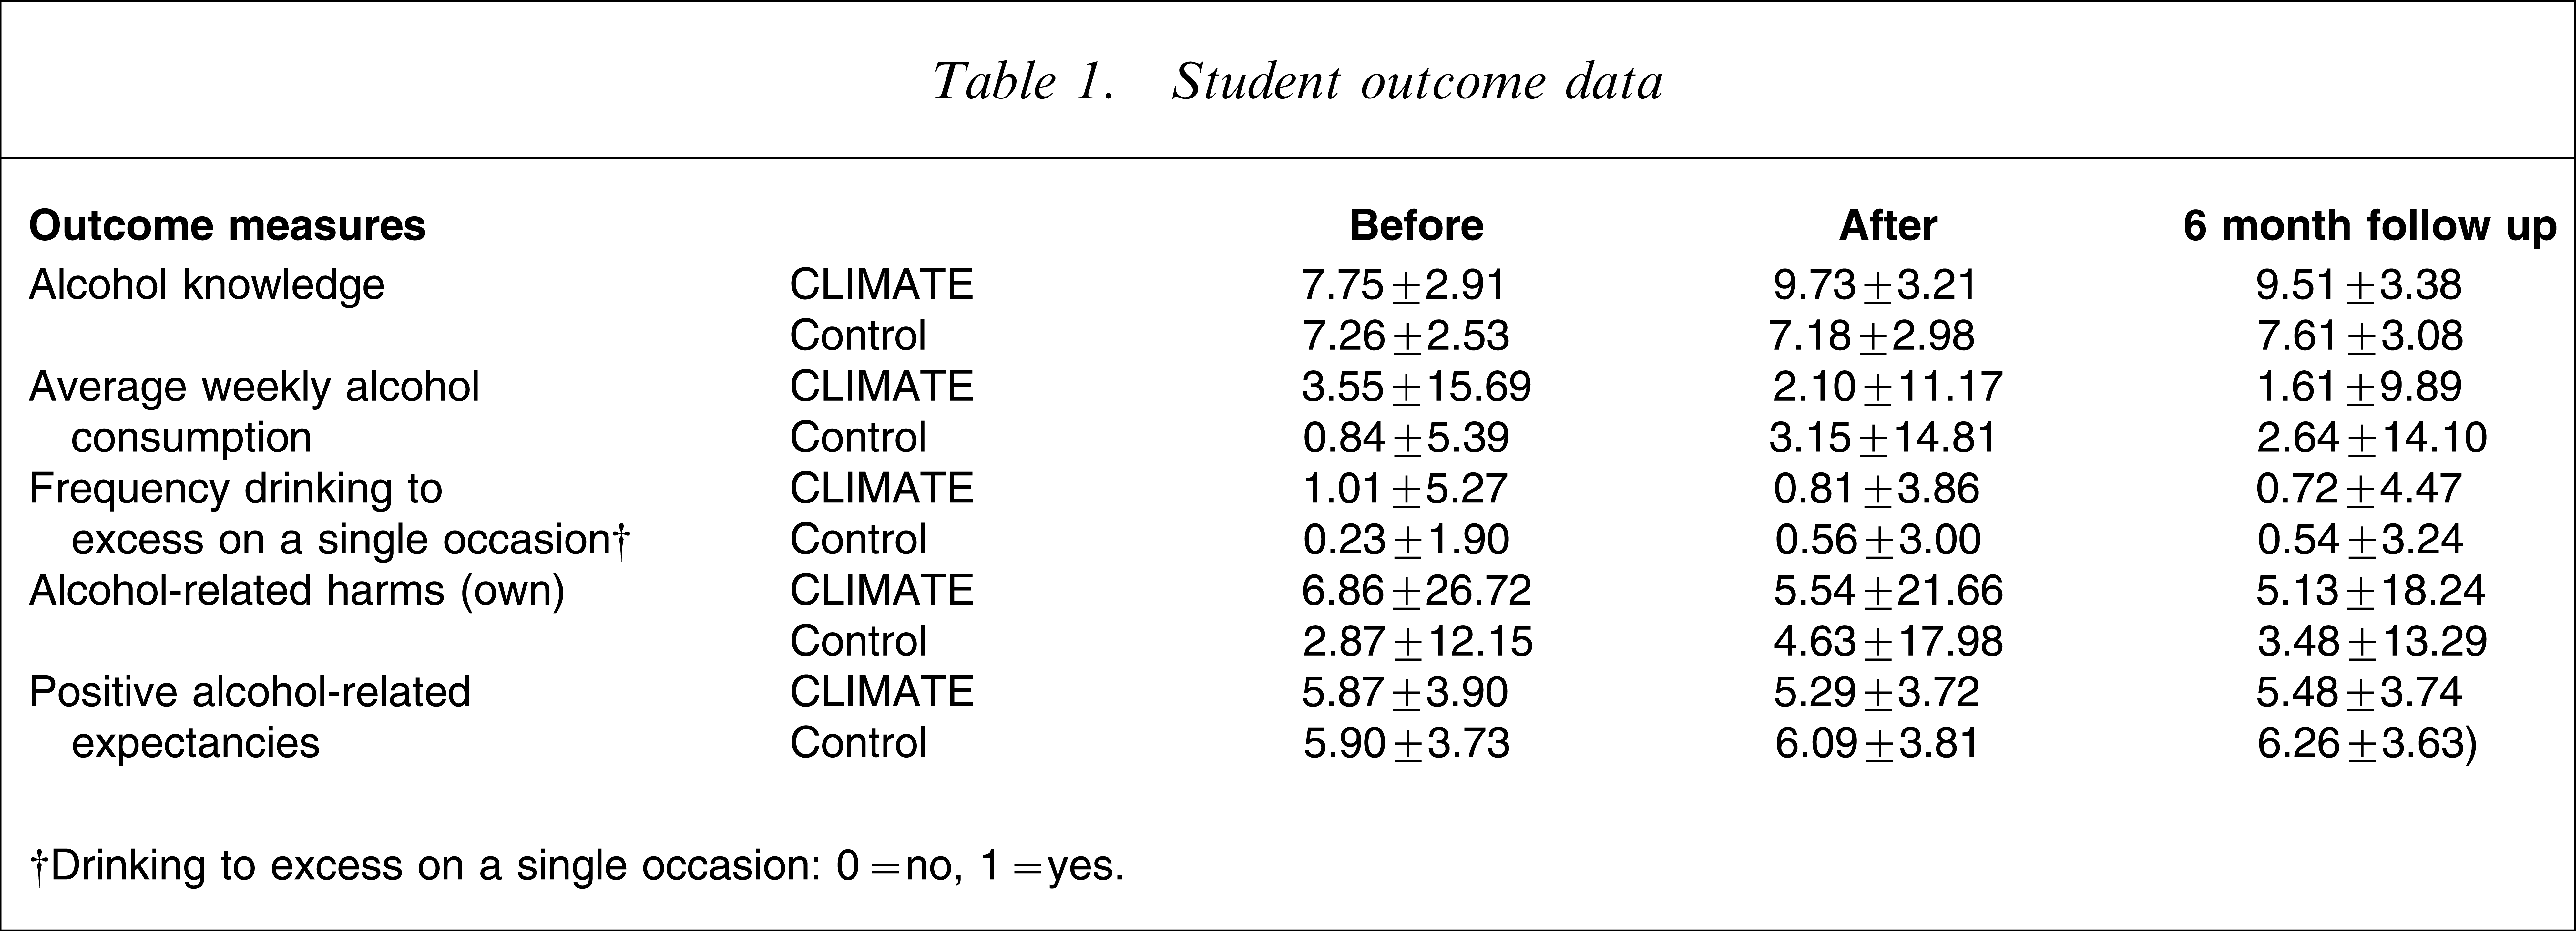
†Drinking to excess on a single occasion: 0=no, 1=yes.
At baseline the students in the Climate group had significantly higher alcohol-related knowledge (F(1,758)=6.17, p<0.05), higher average weekly consumption of alcohol (Mann–Whitney U-test, z=−2.35, p<0.05), and higher frequency of bingeing in the past 3 months (Mann–Whitney U-test, z=−3.68, p<0.01) than students in the control group. There was no significant difference between groups in the number of harms experienced as a result of their own alcohol use (Mann–Whitney U-test, z=−1.53, p=0.13).
Attrition analyses were conducted to assess comparability of students who were present at baseline only (single) versus students who were present a baseline and at least one follow-up occasion (repeat). Attrition resulted from students being absent on the day of the surveying, failing to use their unique identifying code, or answering <80% of the items on any scale. Compared with those students who were retained after baseline, analyses indicated that students lost on all follow-up occasions had significantly higher levels of binge drinking in the 3 month priors to the baseline survey (1.42 vs 0.55 episodes; Mann–Whitney U-test, z=−2.65, p<0.05). There were no significant differences between single and repeat cases on any other outcome measures.
There was no evidence of differential attrition on the outcome measure for the Climate and control conditions.
Intervention effects
Hierarchical linear modelling using the program HLM 6 [35] was used as the primary statistical method of analyses to account for intracluster correlations between schools. If the unconditional hierarchical linear model indicated that <10% of systematic variance existed at the between-school level, HLM was abandoned and single-level analyses were used [36]. The outcome variables with intraclass correlations under 10% were average weekly alcohol consumption, frequency of drinking to excess on a single occasion in the past 3 months, and harm associated with own use of alcohol. Each of these outcome variables were not normally distributed, therefore change scores were used in the analyses because they better represented normal distributions. For these variables ANOVAs utilizing SPSS GLM procedure (SPSS, Chicago, IL, USA) were conducted on change scores from baseline to each follow-up occasion. Bonferroni adjustments were made for multiple comparisons.
Alcohol-related knowledge
The unconditional hierarchical linear model had knowledge scores centred at post-test assessment. The unconditional model, which utilized a linear growth term to characterize the pattern of change in knowledge over time, provided a better fit to the model. The variation between schools accounted for 25% of total explainable variance in knowledge scores at post-test assessment. Two conditional linear growth models were assessed. In the first model, gender was entered as a school-level predictor, but did not significantly improve model fit (χ2(9)=5.2, p=0.9). In the second conditional model, intervention condition (Climate vs control) was added as a school-level predictor and significantly improved model fit (χ2(2)=7.19, p<0.05). The population mean across all schools was 7.36, with the Climate group scoring significantly higher (1.44 units) on the knowledge scale than students in the control group at post-intervention assessment (p<0.01). The average growth in knowledge scores across all schools was 0.06 units occasion−1 with the Climate group demonstrating a trend towards a further 0.88 units occasion−1 (p=0.057).
The inclusion of intervention effects explains 67% of the variance in post-test knowledge scores. Figure 2 shows the change in knowledge score for the Climate and control groups over time.
Alcohol-related knowledge in (♦) Climate and (▪) control group over time.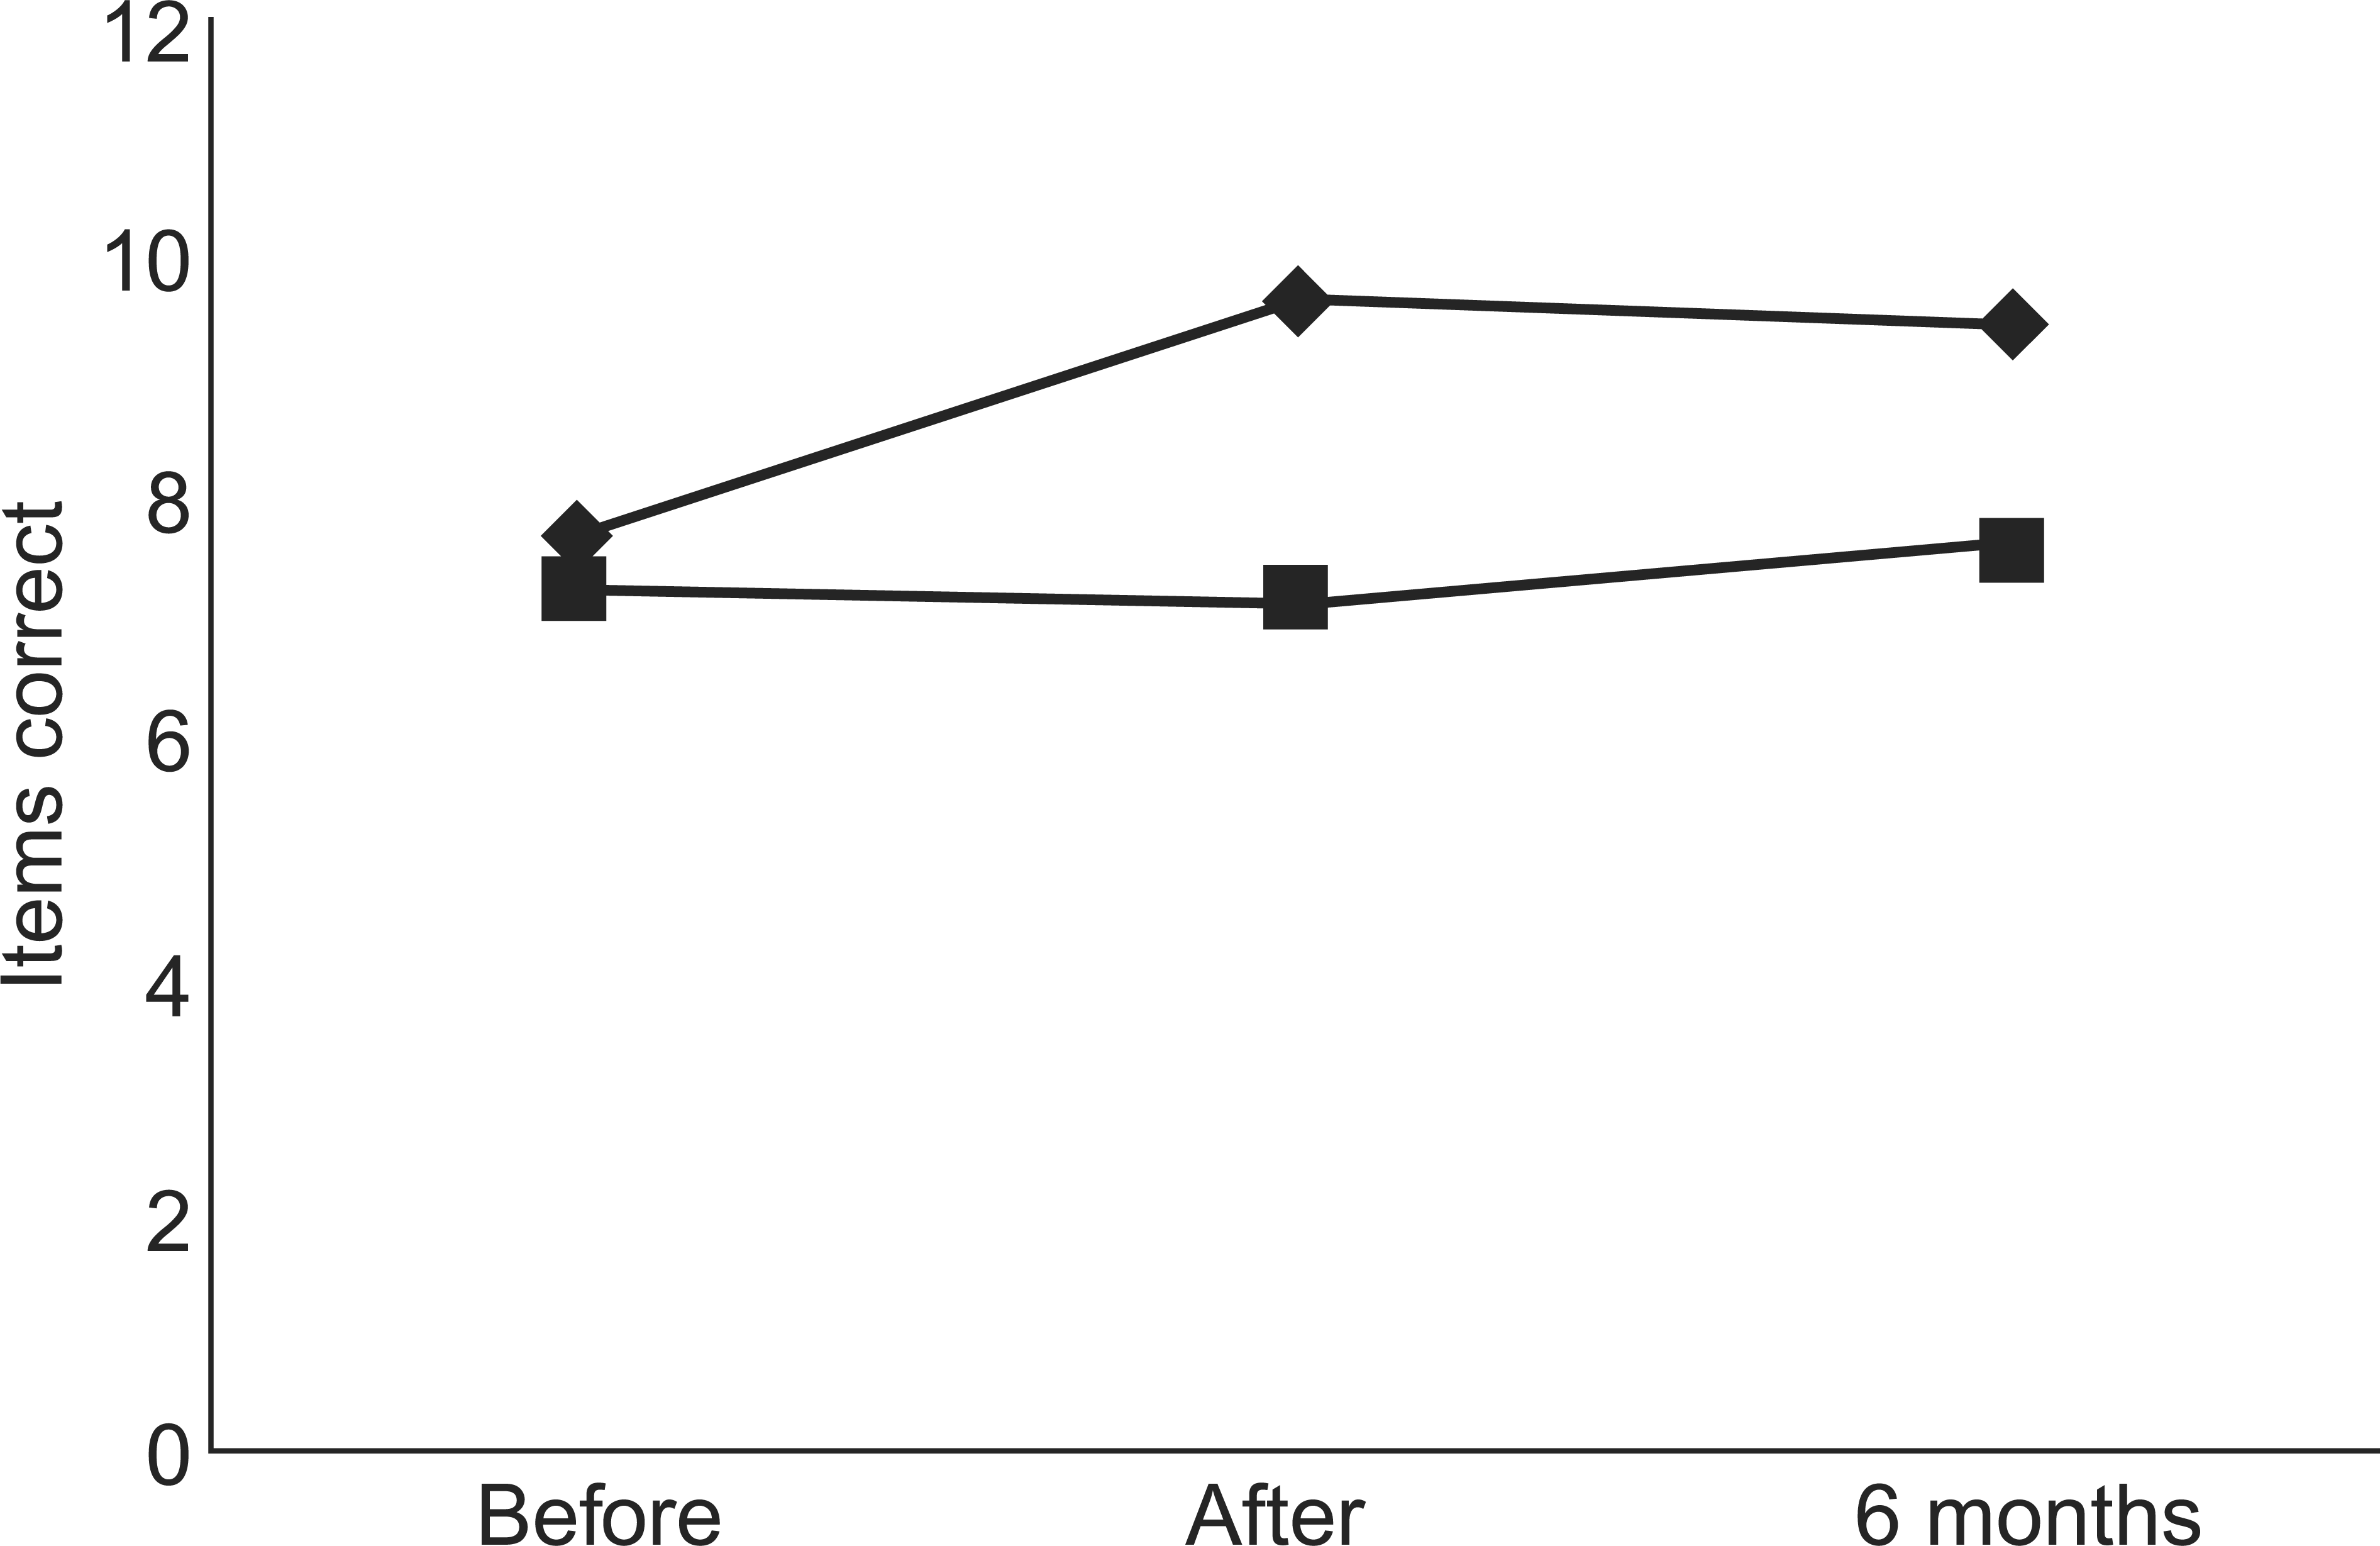
Alcohol-related expectancies
The unconditional hierarchical linear model had alcohol-related expectancy scores centred at post-test assessment. The unconditional model, which utilized a linear growth term to characterize the pattern of change in expectancy scores over time, provided a better fit to the model. Two conditional linear growth models were assessed. In the first model, gender was entered as a school-level predictor, but did not significantly improve model fit (χ2(9)=10.3, p=0.1). In the second conditional model, intervention condition (Climate vs control) was added as a school-level predictor, but again did not significantly improve model fit (χ2(2)=1.62, p=0.1).
Alcohol-related outcomes
Average weekly alcohol consumption
Figure 3 shows the change in average weekly alcohol consumption for the Climate and control groups over time. From baseline to immediate follow up the change in average weekly alcohol consumption was significantly different between groups, with the control group increasing their average consumption (mean difference=2.27 standard drinks) more than the Climate group, who actually decreased their average weekly consumption (mean difference=−1.75 standard drinks, F(1,530)=6.62, p<0.01). At the 6 month follow up no significant difference between groups was found on the change in average alcohol consumption (F(1,474)=2.31, p=0.13).
Average weekly alcohol consumption in (♦) Climate and (▪) control group over time.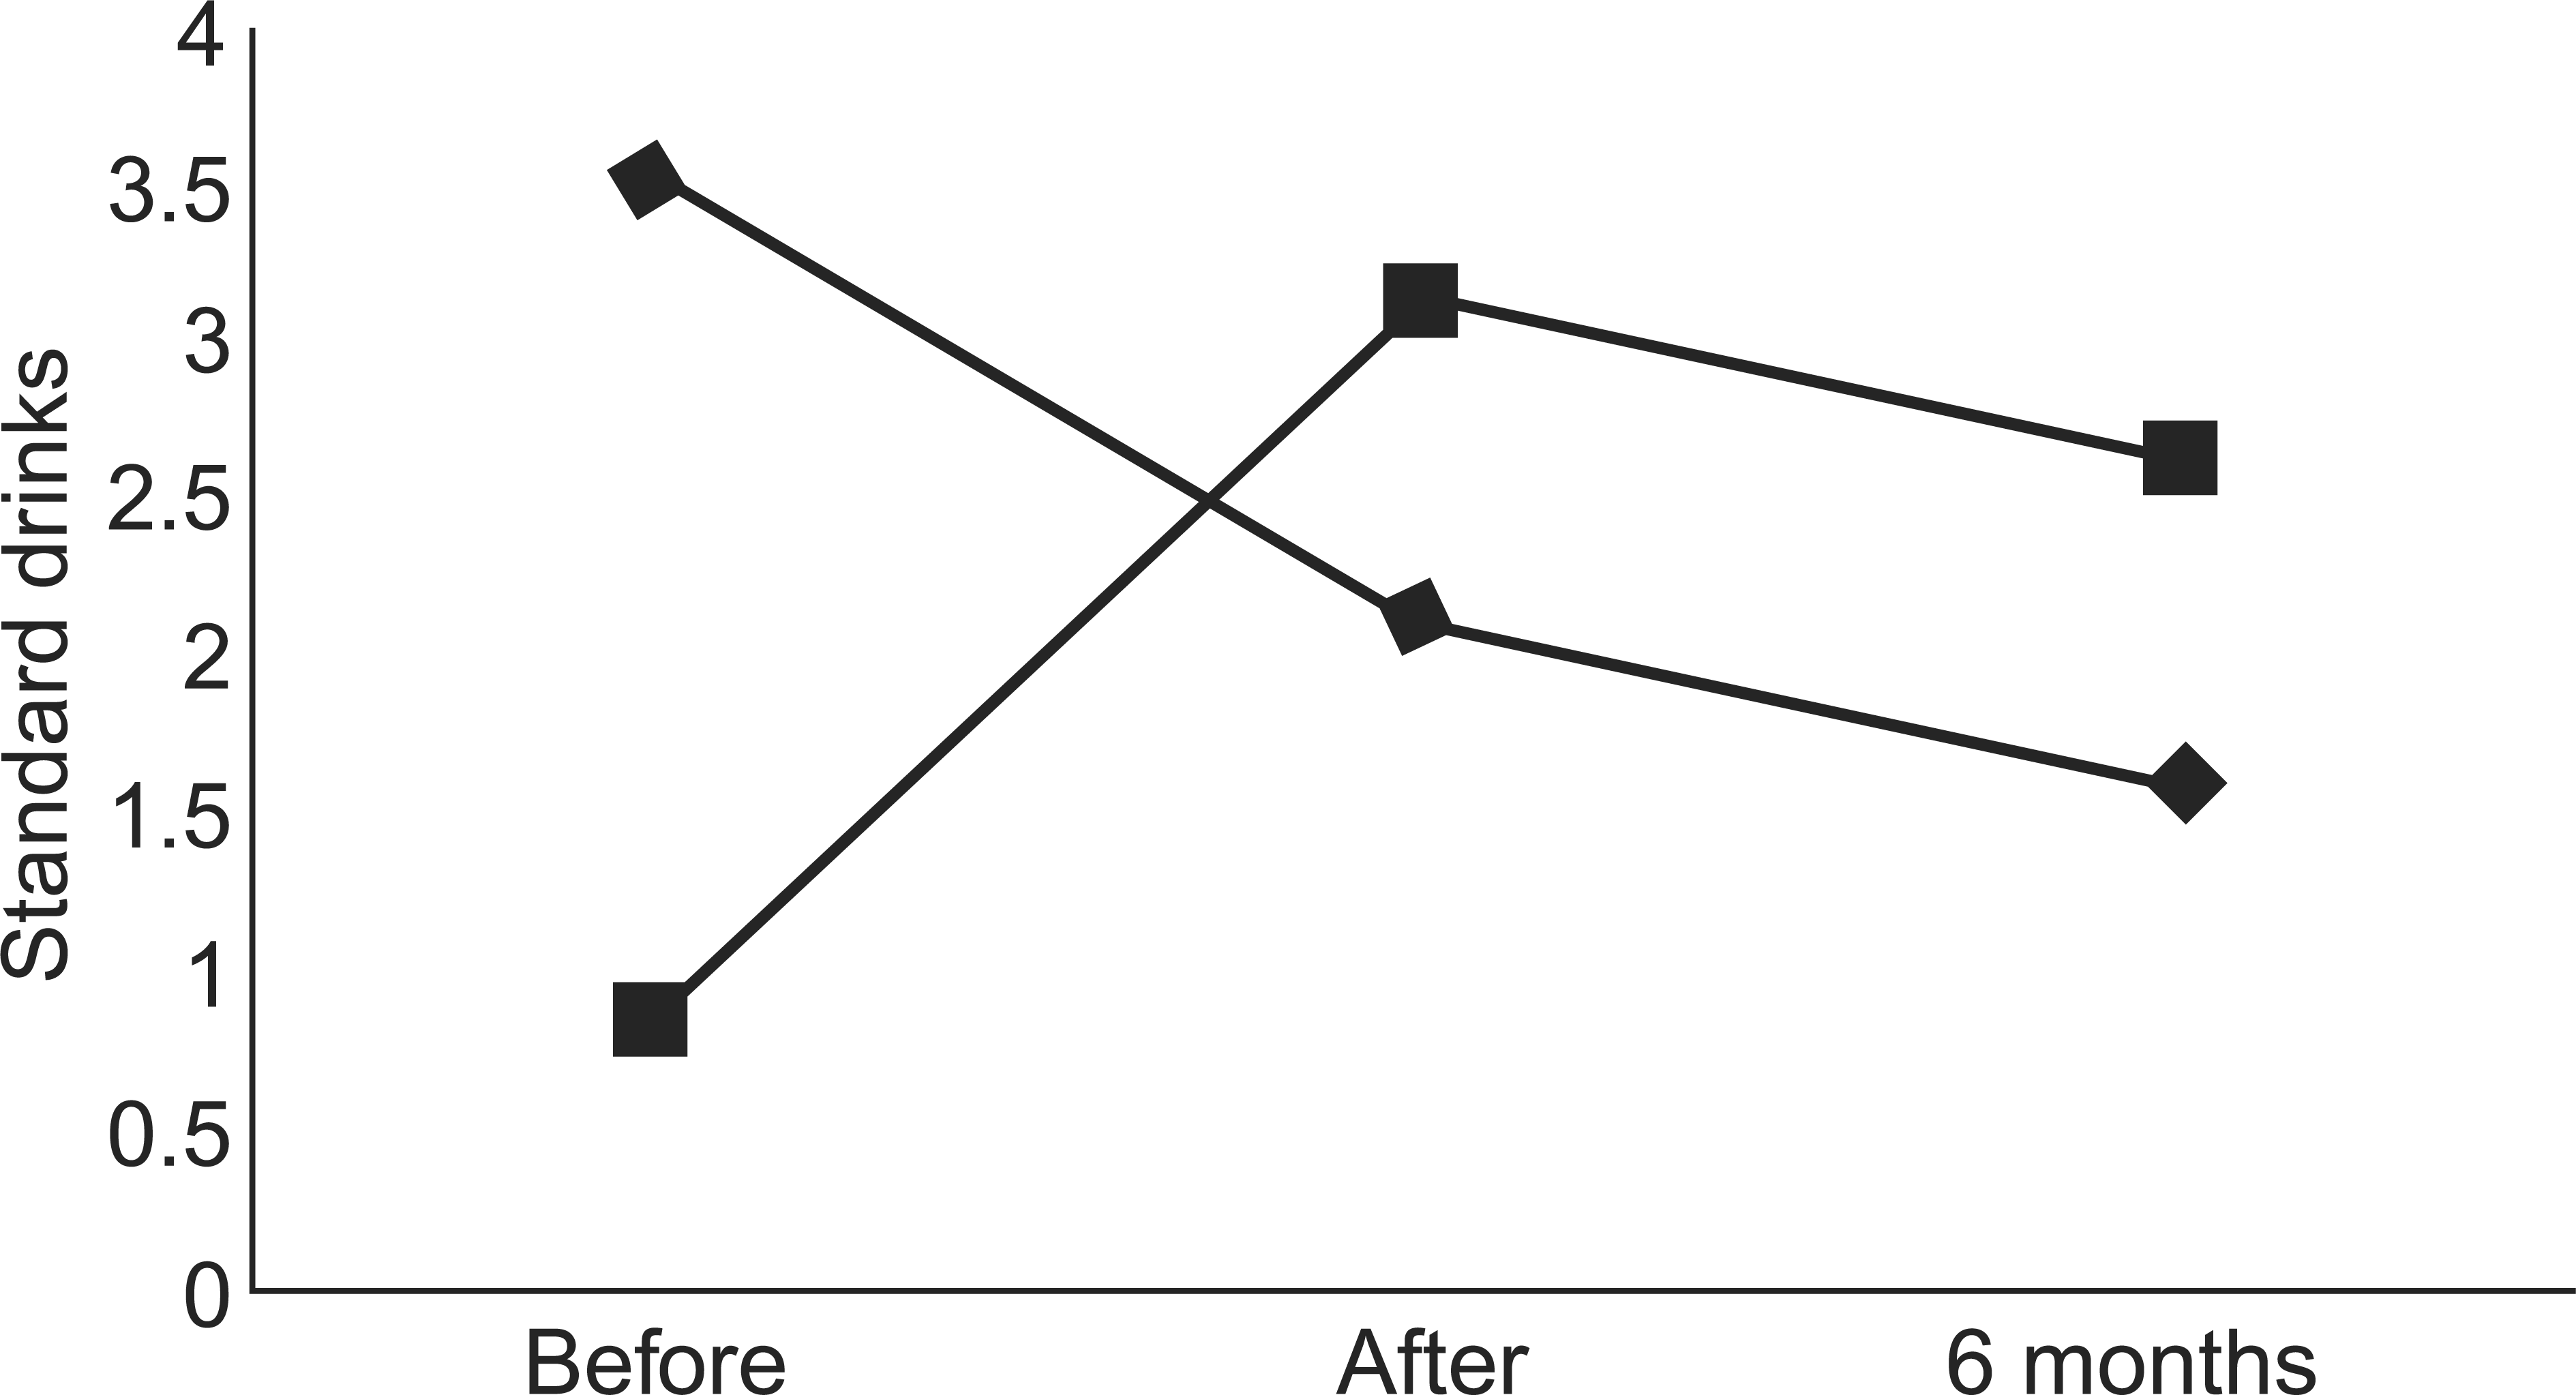
Frequency of drinking to excess on a single occasion in the past 3 months
Although the Climate group appeared to decrease their frequency of drinking to excess from baseline to immediate follow up (mean difference=−0.18 times per 3 months), there was no significant difference in change from the control group (mean difference=0.32 times per 3 months (F(1,530)=1.19, p=0.28). At the 6 month follow up, again no significant difference between groups was found on change in frequency of drinking to excess (F(1,475)=0.03, p=0.85).
Harm associated with own use of alcohol
From baseline to immediate follow up, the Climate group appeared to decrease harm associated with their own use of alcohol (mean difference=−1.13 harms), but there was no significant difference in change from the control group (mean difference=1.56 harms, F(1,451)=1.27, p=0.26). At the 6 month follow up no significant difference between groups was found on change in frequency of drinking to excess (F(1,426)=0.86, p=0.36).
Discussion
The current cross-validation trial of the Climate Schools: alcohol module supports its effectiveness as a harm reduction programme for alcohol misuse [25]. The programme demonstrated increases in alcohol-related knowledge, specifically regarding harm minimization information at post-intervention and at 6 month follow up. The programme was also able to demonstrate immediate behavioural changes in average alcohol consumption by students. These positive findings are consistent with other studies that have focused on harm reduction messages, as opposed to abstinence-based messages [9–21].
Evidence for behavioural change was weaker at 6 month follow up. This may in part be due to a loss of power, because only those individuals for whom there were full data were included in analysis. This may preclude more high-risk students, who exhibit the more harmful and at-risk behaviours, from the analysis. Further, non-significant differences between groups at 6 month follow up is not uncommon within school-based prevention literature, which shows that impacts of interventions may not be immediately apparent, but rather become evident 12 months after the intervention [37]. Analysis of 12 month follow-up data is planned to address this issue.
Field-testing points to the need to make some changes in order to have an impact on alcohol expectancies, binge drinking behaviour and harm associated with alcohol use. Although these outcomes were not found to be significantly different between control and intervention groups, the effects were in the right direction, and with a larger sample these differences may be detected. A final limitation of the present study again refers to power, which was not sufficient to examine gender differences in alcohol outcomes. It would be of interest to examine gender differences because the national harm limits for alcohol use in Australia are determined by gender [4], and differences were previously found to be evident [25], with the intervention found to have stronger impacts on female subjects’ reported alcohol use and related harms than the male subjects’. Future studies may wish to use a larger sample to look at gender differences and see if they are consistent with previous research.
Consistent with literature that has focused on harm minimization programme effectiveness [9–21], the Climate Schools: alcohol module, which overcomes the more traditional obstacles to implementation of prevention programmes, was effective in increasing alcohol-related knowledge and decreasing average use of alcohol. Further, it was acceptable to both teachers and students, thus providing a promising framework for the provision of prevention programmes in the future.
Schools are increasingly being asked to teach socially relevant non-core subjects for which teachers lack appropriate training. Internet-based lessons offer the benefit of offering content that is acceptable, cheap, accurate and standardized, leaving teachers free to do what they do well: translate the content into the tenor of the students’ own lives and predicaments.
Footnotes
Acknowledgements
The development of the Climate Schools: alcohol module was funded by the Australian Government Department of Health and Ageing. The funding for this replication study came from the Alcohol Education and Rehabilitation Foundation. Many thanks to all the schools, students and teachers who were involved in this research.