
Abstract
Regulator of G-protein signalling 4 (RGS4) has been proposed as a possible susceptibility gene for schizophrenia [1]. Supporting this theory is RGS4's involvement in the regulation of several neurotransmitter systems implicated in schizophrenia, including the dopaminergic [2], serotonergic [3] and glutamatergic systems [4], as well as the close proximity of the RGS4 locus to a chromosomal region associated with schizophrenia according to linkage studies [5]. Association studies initially identified four single nucleotide polymorphisms (SNPs) within the promoter and intronic sequences of the RGS4 gene associated with an increased risk of schizophrenia in several populations [6]. While the association between these SNPs and schizophrenia has also been reported in other populations [7], [8], other studies have found no association of any of these SNPs with the incidence of schizophrenia [9–11]. Thus, the role of these SNPs in conferring schizophrenia susceptibility remains unclear.
Initial studies of the post-mortem brain reported decreased levels of RGS4 mRNA in the dorsolateral prefrontal cortex (DLPFC) of subjects with schizophrenia [1]. Subsequent studies also demonstrated decreased RGS4 mRNA expression within the frontal cortex of schizophrenia subjects, also reporting decreased RGS4 expression within the cingulate gyrus, insular cortex and superior temporal gyrus but not in the caudate, putamen or the inferior frontal sulcus and gyrus [12], [13]. Other studies however, using post-mortem tissue have failed to replicate the original finding of decreased RGS4 mRNA in the DFLPC of schizophrenia subjects [14]. In light of the current discrepancies regarding RGS4 expression in the cortex of subjects with schizophrenia, we decided to use in situ hybridization and western blot to determine whether the expression of RGS4 is altered in the cortex from subjects with schizophrenia from an independent cohort.
Methods
Tissue collection
Approval was obtained from both the Ethics Committee of the Victorian Institute of Forensic Medicine and the Mental Health Research and Ethics Committee of Melbourne Health. All tissue was obtained from the Victorian Brain Bank Network. Brodmann area (BA)9 and BA40 tissue was obtained at post-mortem from 19 schizophrenia subjects and 19 subjects with no history of psychiatric illness, closely matched for gender, age, post-mortem interval (PMI) and tissue pH (Table 1). All schizophrenia subjects had prior history of treatment with a range of antipsychotic medications. The lateral surface of the frontal lobe, including the middle frontal gyrus superior to the inferior frontal sulcus demarcated BA9. BA40 was taken as the lateral surface of the parietal lobe including primarily the supramarginal gyrus surrounding the posterior segment of the lateral fissure.
Subject data
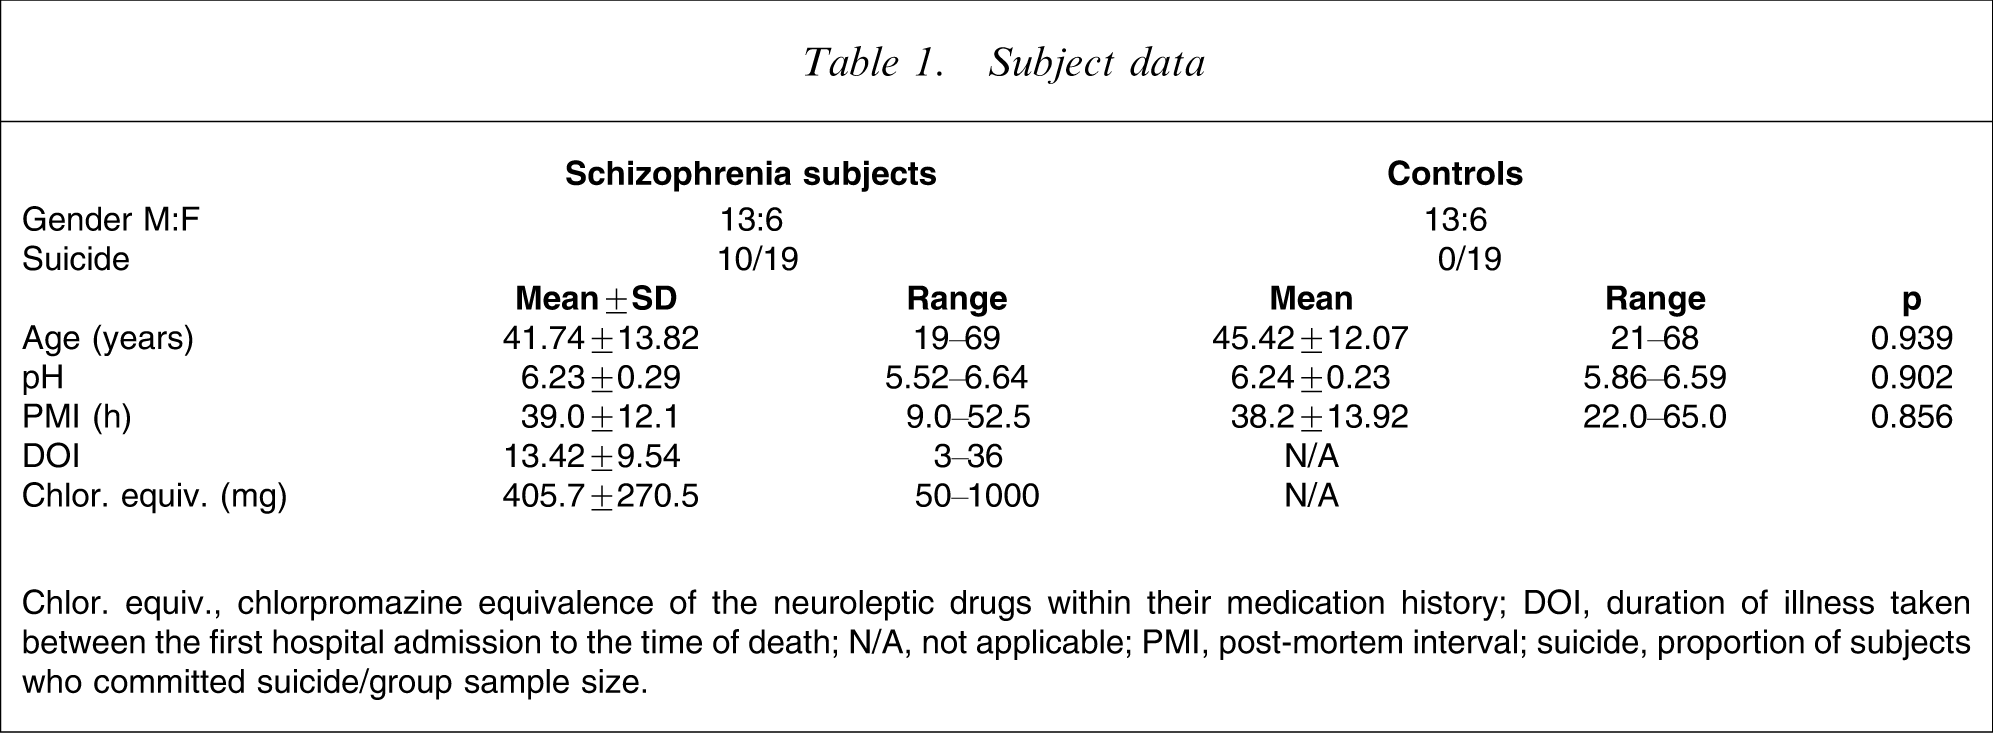
Chlor. equiv., chlorpromazine equivalence of the neuroleptic drugs within their medication history; DOI, duration of illness taken between the first hospital admission to the time of death; N/A, not applicable; PMI, post-mortem interval; suicide, proportion of subjects who committed suicide/group sample size.
In Situ hybridization
The complementary RNA (cRNA) probes were designed to correspond to the same sequence used by Mirnics et al.[1]. cRNA probes were generated from linearized pCRII plasmid, subcloned with RGS4 cDNA (Accession no. NM005613.3) that was amplified using the forward and reverse oligonucleotide primer sequences: 5′-CCGAAGCCACAGCTCCTC-3′ and 5′−CATCCCTCTCCCTTCAGGTG-3′. A total of 1 µg linearized construct was transcribed at 37°C for 2 h in 1X transcription buffer (Promega, Madison, WI, USA), 10 mmol L−1 dithiothreitol (DTT), 0.5 mmol L−1 each of riboadenosine triphosphate (rATP), riboguanosine triphosphate (rGTP) and ribocytidine triphosphate (rCTP), 23.15 MegaBequerel per microlitre, 1250 Ci mmol−1 [35S] ribouridine triphosphate (rUTP), 20 U RNase inhibitor and 20 U of either T7 (antisense) or SP6 (sense) RNA polymerase (Promega). The probes were purified using the RNEasy Minelute cleanup kit (Qiagen, Hilden, Germany). Probes were hydrolysed to 100 bp via alkaline hydrolysis [15].
The 10 µm frozen sections were cut from BA9 and BA40 tissue with a cryostat and mounted on to Esco Superfrost Plus slides (Erie Scientific, Portsmouth, NH, USA). Four sections per subject (two antisense, two sense) were used for in situ hybridization. Sections from pair-matched subjects were processed together to minimize the impact of experimental variation. The sections were fixed in 4% paraformaldehyde in 1X phosphate-buffered saline for 1 h and rinsed thrice in 2X saline-sodium citrate (SSC), acetylated for 10 min in 0.25% acetic anhydride/0.1 mol L−1 triethanolamine, washed twice in 2X SCC for 5 min, and dehydrated through graded ethanol solutions prior to a 5 min delipidation in 100% chloroform. The sections were rinsed in ethanol and air dried. The sections were hybridized under coverslip in 50% formamide, 3X SSC, 1X Denhardts solution, 50 mmol L−1 Na2HPO4, 10% dextran sulfate, 10 mmol L−1 DTT, 100 ng µL−1 yeast tRNA, 100 ng µL−1 poly A and 2×10⁻⁶ c.p.m. per section cRNA probe for 16 h at 56°C in a humidified chamber. Following hybridization the slides were incubated in 200 µg mL−1 RNaseA in 10 mmol L−1 Tris-HCl pH 8.0, 0.5 mol L−1 NaCl at 37°C for 30 min, washed in 2X SSC for 15 min at room temperature followed by washes in decreasing concentrations of SSC to a final high stringency wash in 0.5X SSC for 2 h at 60°C. The sections were dehydrated in graded ethanol and apposed to a BAS-SR2025 plate (Fujifilm, Tokyo, Japan) with [14C] autoradiographic microscales (Amersham Biosciences, Little Chalfort, UK) for 5 days. Pair-matched subjects were opposed on the same plate to minimize the impact of variation between microscales. The plates were analysed using a BAS 5000 high-resolution phosphoimager (Fujifilm) and AIS imaging software (Imaging Research, St Catherines, ON, Canada). RGS4 expression was measured as an integrated measurement of signal intensity across the entire region of binding. Signal intensities were calibrated against the microscales and expressed as the average d.p.m. per estimated tissue equivalent of antisense probe subtracted from the average sense background for each subject.
Western blotting
Homogenates were prepared from the cortical tissue at 5% w/v in 10 mmol L−1 Tris (pH 7.4), 1% sodium dodecylsulfate, 1 mmol L−1 Na3VO4. Protein concentrations were determined a modified Lowry method (DC Protein Assay, Bio-Rad Laboratories, Hercules, CA, USA) adapted for microplates. Twenty microgram protein samples were resolved on a 10% polyacrylamide gel. Protein samples from pair-matched subjects were loaded (in duplicate) consecutively on the same gel to minimize gel variation between diagnoses. Molecular weight standards were loaded onto each gel. The proteins were transferred onto a nitrocellulose membrane. The membrane was blocked in 5% non-fat milk powder in 1X 0.1% Tween-20 in Tris-buffered saline (TTBS), incubated in the primary RGS4 goat polyclonal antibody (1:1000; Santa Cruz Biotechnology, Santa Cruz, CA, USA) diluted in 5% milk powder in 1X TTBS for 1 h at room temperature, washed four times in 1X TTBS, incubated in HRP-conjugated secondary antibody (1:1000; Dako, Glostrup, Denmark) and washed four times in 1X TTBS. The membrane was incubated with ECL (Amersham, Biosciences) for 1 min and analysed using the Kodak 440 CF imaging system (Kodak, Rochester, NY, USA).
An internal standard protein preparation derived from BA9 tissue of a subject independent of the cohort was run on two gels to establish both intra- and inter-assay variation for the measurement of the RGS4 protein. This sample was subsequently run (in duplicate) on every gel to control inter-assay variation. The results from all subjects were standardized by expressing the antibody's signal intensity for each subject as a ratio of the membrane's internal standard.
Statistics
The data were analysed using two-way ANOVA following the D'Agostino and Pearson omnibus normality test to determine whether the data followed a Gaussian distribution. Demographic and tissue condition data were analysed using Pearson product moment correlation and ANCOVA. Analyses were conducted using Prism 5.01 (Graphpad Software, LA Jolla, CA, USA) and Minitab 13.01 (Minitab, State College, PA, USA).
Results
RGS4 mRNA and protein expression was measured in BA9 to assess whether previously published decreases in RGS4 expression within the DLPFC could be observed within the cohort. Expression was also measured within BA40. Changes in the molecular cytochemistry of this region have not been strongly associated with schizophrenia [16–18]. Thus, BA40 served as a negative control tissue.
In both BA9 and BA40, RGS4 mRNA expression was detected across the entire grey matter with comparably lower expression within laminae IV. This difference in RGS4 mRNA expression within laminae IV was confirmed by applying a transept across the cortex and measuring signal intensity across the transept (Figure 1a). This pattern of expression is comparable to the published expression pattern of RGS4 within the DLPFC [1], [13], suggesting that the specificity of cRNA probe binding within the present study is comparable to that of previously published studies. An integrated measure was taken across the entire cortex, consistent with other studies [1], [13]. There was no significant difference in RGS4 mRNA expression with diagnoses in either BA9 (F1,73=1.845, p > 0.05) or BA40 (F1,73=1.845, p > 0.05; Figure 1b).
(a) In situ regulator of G-protein signalling 4 (RGS4) expression in Broadmann area (BA)9. A density profile of cRNA probe binding across the laminae of the cortical grey matter shows lower RGS4 expression within lamina IV compared to other laminae. There was no significant difference in RGS4 expression between the two regions flanking lamina IV in the control and schizophrenia groups (BA9: F1,74=0.727, p > 0.05; BA40: F1,72=0.212, p > 0.05). (b) In situ expression of RGS4 mRNA as measured via autoradiography using cRNA probes. No significant difference in RGS4 expression was observed between control and schizophrenia groups in either BA9 (F1,73=1.845, p > 0.05) or BA40 (F1,73=1.845, p > 0.05). Expression was determined from an integrated measurement of cRNA probe signal intensity across the entire grey matter. Values are expressed as d.p.m. mg−1 estimated tissue equivalent.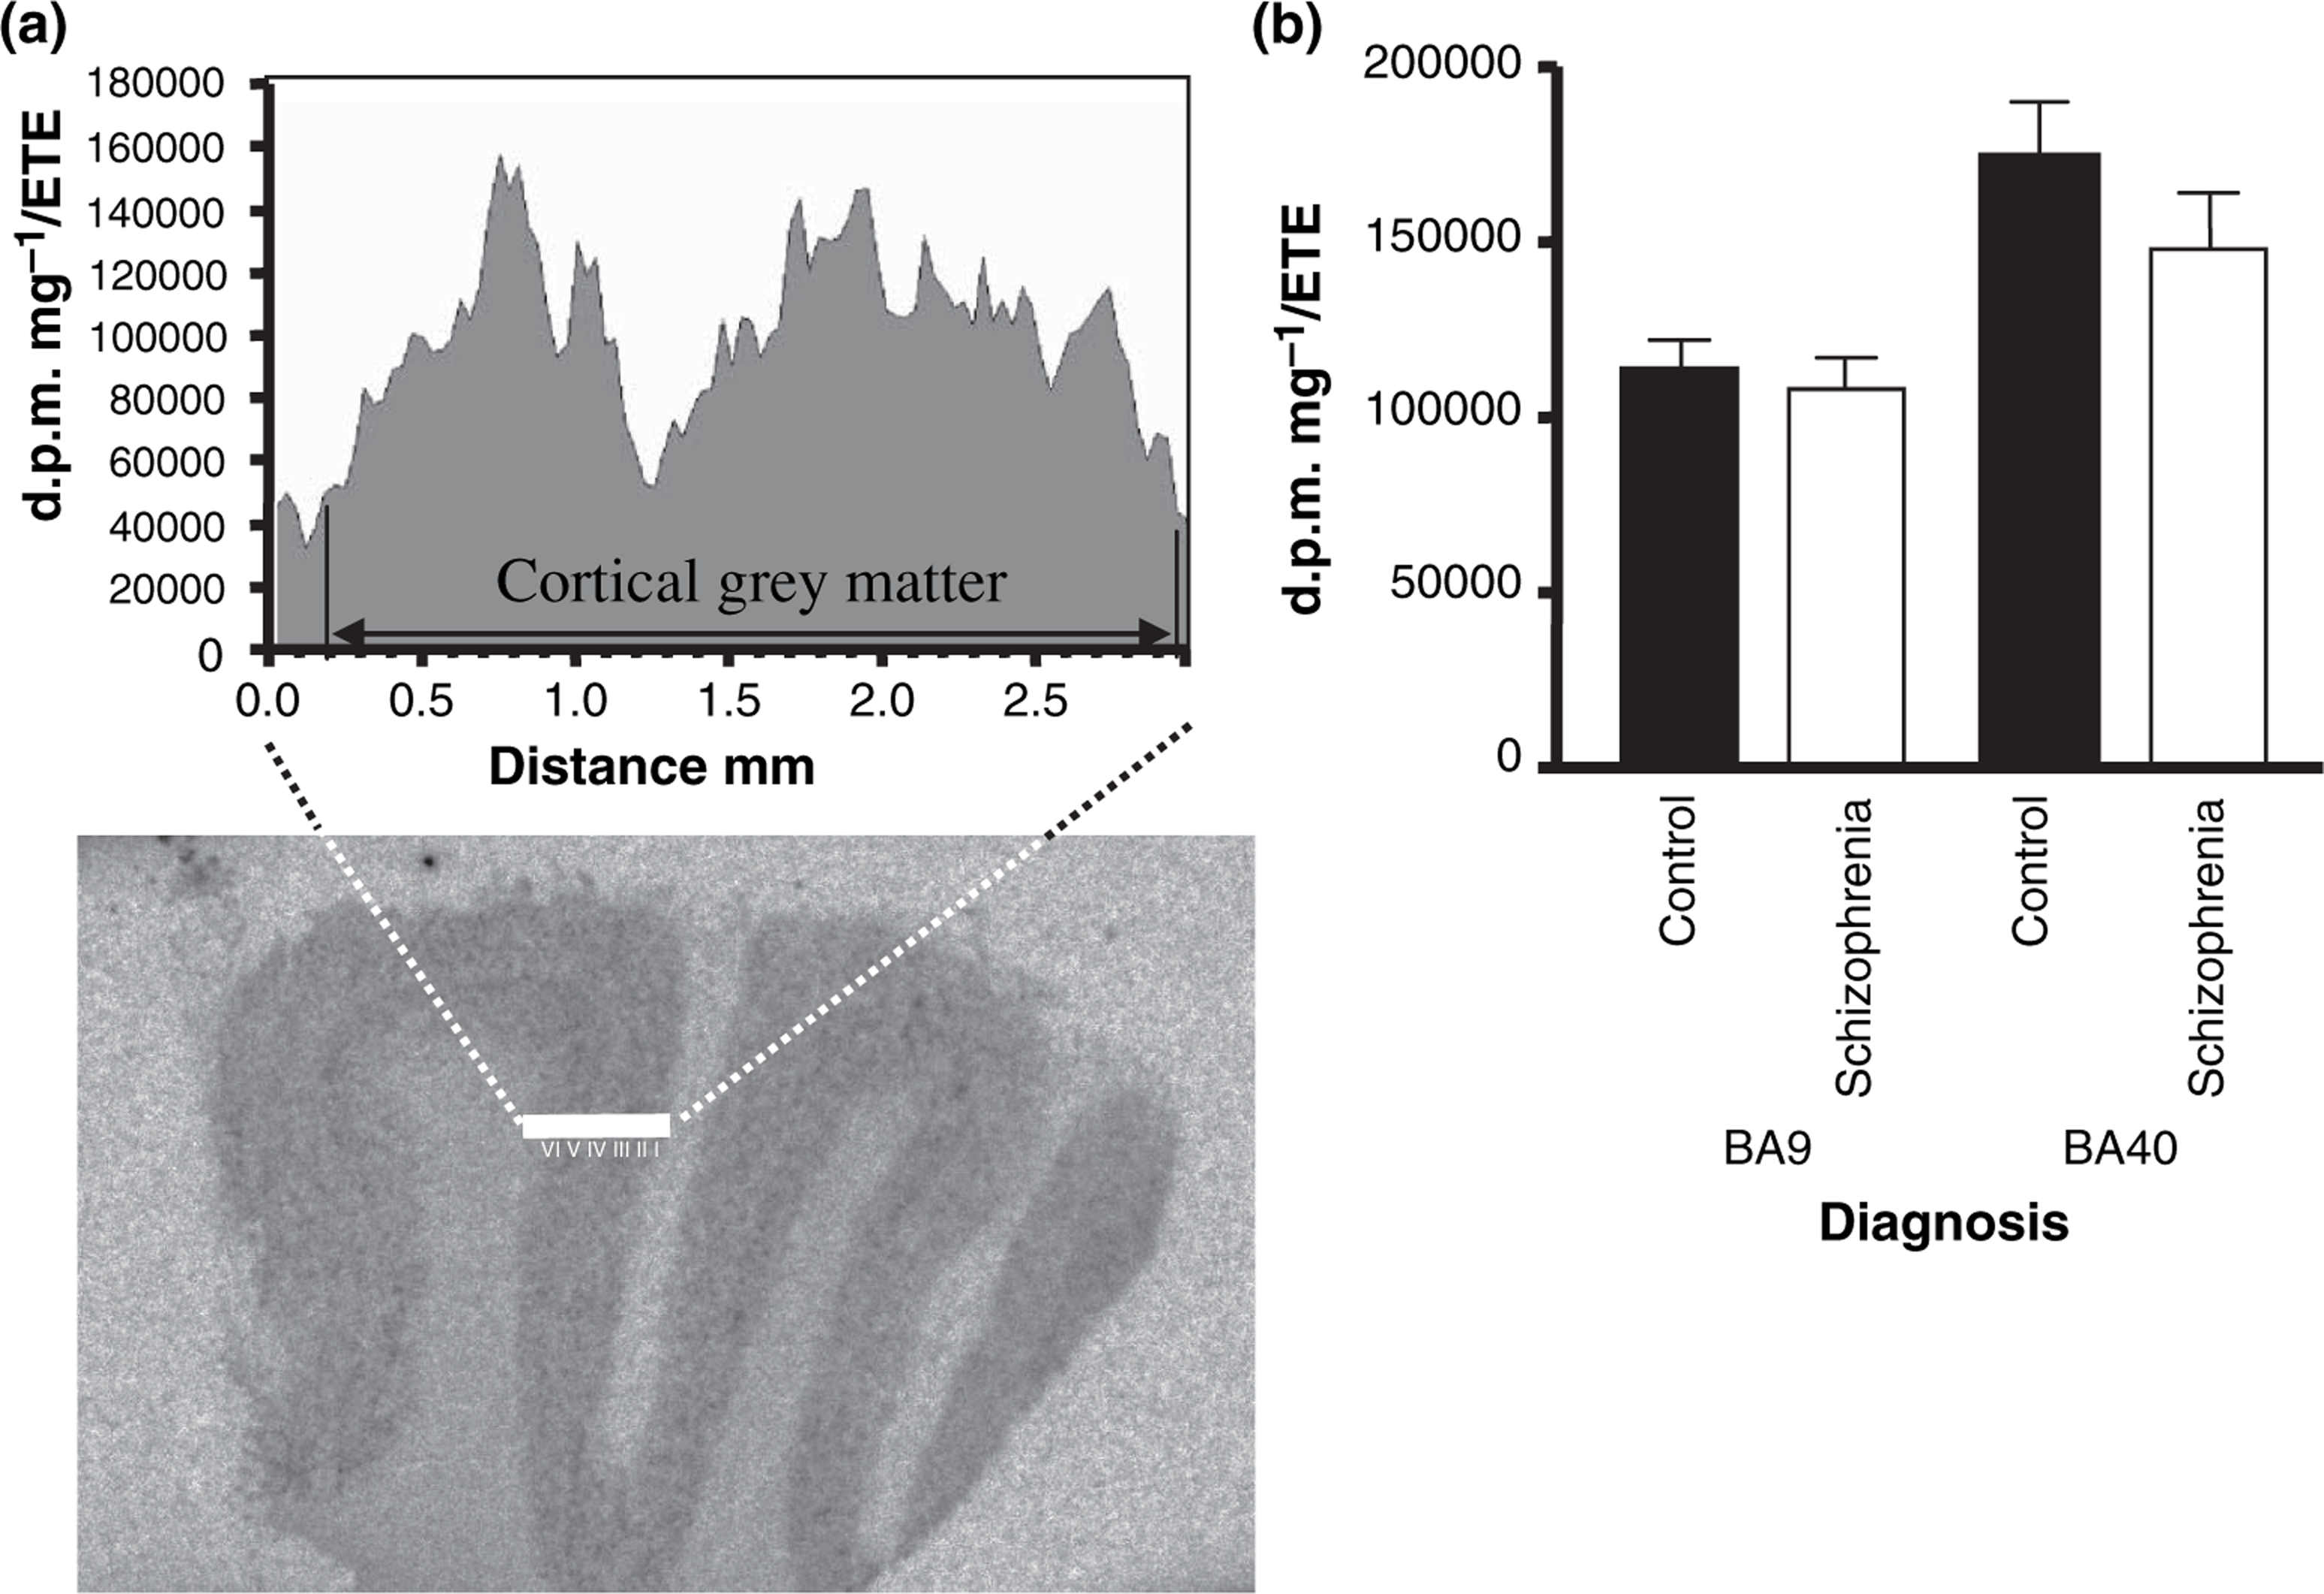
Western blots with the human anti-RGS4 antibody showed highly specific binding to a single protein at the predicted molecular weight of RGS4 (Figure 2a). Using an internal standard derived from a separate human BA9 protein extract, the inter- and intra-assay variation for the measurement of RGS4 was shown to be 8.0% and 10.8%, respectively. The use of an internal standard, coupled with running control and test subjects in adjacent lanes on the gel, is an alternative approach to the use of housekeeping proteins to control for assay variation [19]. Furthermore, it eliminates the confounding factor of expressional variation noted among established reference proteins [20], [21]. There was no significant difference in RGS4 protein expression with diagnosis in either BA9 (F1,72=3.336×10⁻⁴, p > 0.05) or BA40 (F1,72=3.336×10⁻⁴, p > 0.05; Figure 2b).
Regulator of G-protein signalling 4 (RGS4) protein expression analysed via western blotting. (a) A single 34 kDa band was observed on the western blots. (b) RGS4 protein expression. No significant difference was observed between control and schizophrenia groups in either Broadmann area (BA)9 or BA40 (F1,72=3.336×10⁻⁴, p > 0.05). Values are expressed as ratios of an independent BA9 protein extract (internal standard).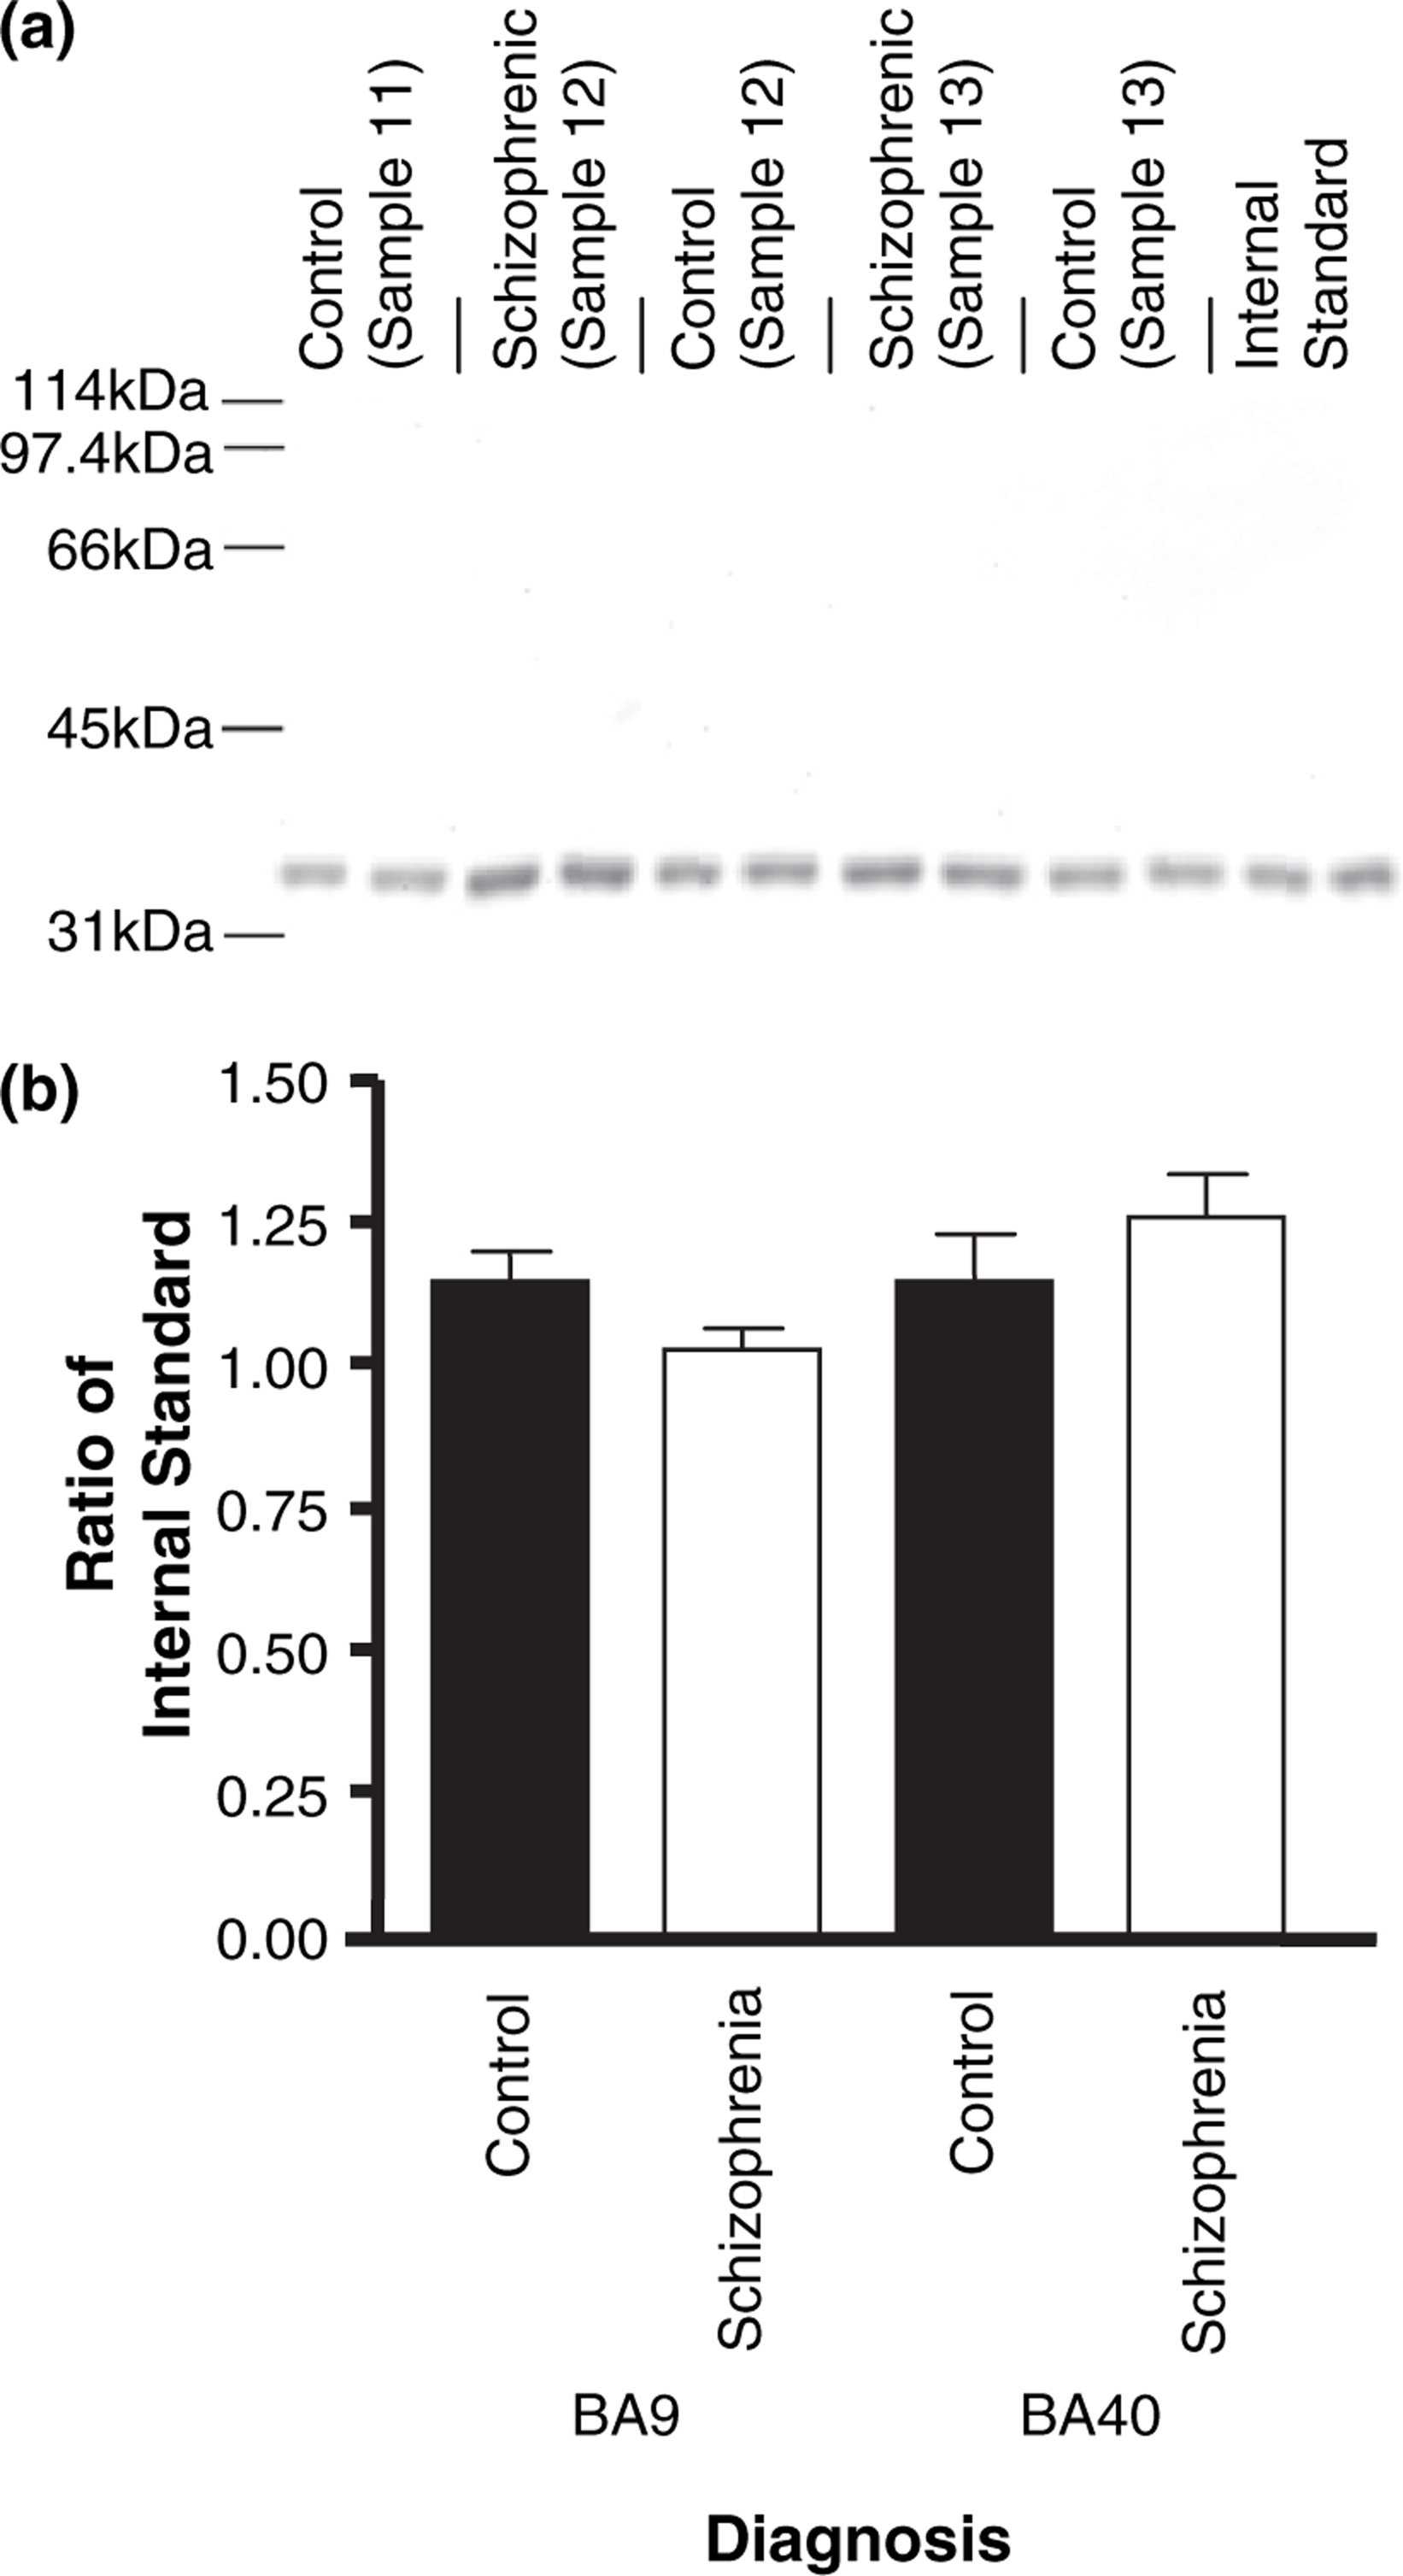
The effect of potential confounding factors such as tissue pH, PMI, gender, age, the incidence of suicide, duration of illness and antipsychotic medication on levels of RGS4 mRNA and protein were assessed using Pearson correlations: r2 < 0.25 indicated the potential for a significant relationship [22]. These analyses suggest that there could be a significant relationship between tissue pH and RGS4 mRNA in BA9 (r2=0.27, p = 0.0006) and BA40 (r2=0.36, p = 0.0001). Agonal factors, reflected in the acidosis of brain tissue, can affect RNA integrity [23] and this correlation may be reflective of partial RNA degradation due to agonal factors. Pair-matching control and schizophrenia subjects within the cohort was used to control for this variable. A subsequent ANCOVA using pH as the covariant showed any potential effect of pH and thus RNA degradation did not impact on the comparison of RGS4 mRNA across diagnoses (BA9: F1,37=0.37, p = 0.548; BA40: F1,37=2.17, p = 0.150).
Discussion
In the present study we did not detect a decrease in either the mRNA or protein expression levels of RGS4 in a cohort of subjects from the Victorian Brain Bank Network. Our data support a previous study using quantitative polymerase chain reaction that failed to show changes in RGS4 mRNA in BA9 from subjects with schizophrenia [14]. In contrast, the present data do not support the suggestion that there is a decreased level of RGS4 mRNA in the DLPFC from subjects with the disorder [1], [13]. The RGS4 mRNA expression patterns observed in the present study are consistent with the previously reported in situ expression of RGS4 [1], [13]. Importantly, the cRNA probes used in the present study were generated using identical oligonucleotide primers to those used previously [1], with the integrity of the resultant probe confirmed by sequencing. Thus, antisense cRNA probe binding to the intended transcript target is comparable to that of previous studies.
The present study is consistent in that it shows no change in either RGS4 mRNA or protein levels in the cortex of subjects with schizophrenia. In contrast, previous studies have found a decrease in RGS4 protein expression in the frontal cortex in schizophrenia subjects associated with a corresponding decrease in mRNA in the superior frontal gyrus [13]. But although decreased RGS4 mRNA expression without a corresponding change in protein levels has been reported in the insular cortex, decreases in protein levels in schizophrenia subjects appear to be dependent on a corresponding decrease in transcript [13]. Thus, in the absence of a significant decrease in RGS4 mRNA, we should not expect a decrease in protein expression in the present cohort.
Previous findings of decreased RGS4 protein expression associated with schizophrenia were based upon the detection of a 28 kDa protein [13]. The antibody used in the present study detected a single 34 kDa band on the western blots. This band was consistent with that reported by the antibody's manufacturer. The specificity of the antibody we used has been confirmed in other studies [24], thus we are confident that we were detecting RGS4 protein. RGS4 has a predicted molecular weight of 23.3 kDa based on amino acid sequence and thus the band we observed possibly represents a palmitolated or glycosylated form of the protein.
There are several factors that can give rise to different outcomes from studies on the molecular cytoarchitecture of schizophrenia. For example, there are likely to be differences in the genotypes of donors that have contributed tissue to CNS repositories used by other studies. There is the potential for specific RGS4 SNPs and haplotypes to affect expression of the gene. Ethnicity appears to influence the association between certain RGS4 SNPs and schizophrenia [6], [7], [11], [25], and the ethnic background of subjects within the Victorian Brain Bank Network may differ considerably from those of the University of Pittsburgh and Maryland Brain Collection, where decreased RGS4 in the prefrontal cortex in schizophrenia has been reported [1], [13]. Therefore, although the present findings do not eliminate the involvement of altered RGS4 expression in conferring susceptibility to schizophrenia, they do suggest that altered cortical expression of RGS4 is not universal in subjects with schizophrenia.
Footnotes
Acknowledgements
The authors gratefully acknowledge the assistance of Geoffrey Pavey for the preparation of post-mortem tissue and William Doherty for his technical assistance. The study was supported by the funding grants NIH RO1 MH069696-01 and NHMRC project grant 3503441. Brian Dean is an NHMRC Senior Research Follow (400016).