
Abstract
Keywords
There is a widespread belief that the prevalence of depression is increasing. The sources of this belief can be found in the literature reporting increases in depression prevalence by birth cohort [1–6]; increasing numbers of patients being diagnosed with depression or presenting for primary health care treatment [7–9]; high prevalence rates among older adults [10], [11]; burden of disease studies showing that depression is one of the leading causes if not the leading cause of disability [4], [9], [12–14]; and studies showing increased and increasing excess costs associated with depression [15], [16], including disability, self-harm, ischaemic heart disease and depression-related suicide [17], [18]. Based on extrapolating 1990 prevalence and treatment outcome data, it is predicted that by the year 2020 major depression will be the second cause (behind ischaemic heart disease) of the global disease burden [9], partly because of changing incidence and prevalence rates and expected better treatment outcomes for other conditions [13], [19]. Collectively, these studies from many different perspectives have contributed to the belief that depression is on the increase.
The hypothesis of increasing depression prevalence primarily rests on birth cohort analyses of cross-sectional data. These analyses show that those born between World War II and about 1965, have higher probabilities of suffering depression symptoms and that the first occurrence of these symptoms is at younger ages when compared with older birth cohorts [1–7]. These findings, however, have not been fully supported by other recent research. Mattisson et al. showed that among re-interviewed participants in the Swedish Lundby study, the annual age-standardized incidence rate of depression for male (female) was 3.3 (5.5)/1000 in the period 1947–1972 compared with 2.8 (5.1)/1000 in 1972–1999 [20]. Based on three cross-sectional samples over a 40 year timeframe, the Canadian Stirling County study reported that current depression prevalence remained constant at approximately 5% and that minor variations over time were probably a function of changes in the language used to describe depression [21].
Importantly, and again contrary to popular belief, there is little evidence to support the stereotyping of old age as a time of depression. In fact, the literature shows the opposite: that it is younger adults with the highest prevalence rates, particularly females [7], [21–32]. This extensive literature makes it important to examine depression prevalences in detail in order to enhance its understanding.
At present there is no Australian study reporting on changes in depression prevalence over time using any of the study designs reported above the analysis of cross-sectional data, longitudinal re-interviewing or repeated cross-sectional surveys. The present study reports on the prevalence of depression over a 6-year period using a repeated cross-sectional survey design that overcomes some of the limitations of both cross-sectional birth cohort analyses and longitudinal re-interviewing.
Methods
Participants
The paper draws upon the 1998 and 2004 South Australian Health Omnibus Surveys (SAHOS). A full description of the SAHOS methodology can be found in the Wilson et al. study [33]. Briefly, the SAHOS is an annual user-pays population-based survey for health organizations. The surveys analysed in this study consisted of metropolitan and rural samples. The metropolitan samples were based on the collectors’ districts used by the Australian Bureau of Statistics in the 1996 and 2001 censuses, respectively. Sampling in both surveys was based on probability of selection proportional to size, based on every fourth household. The rural samples were selected from towns with a population of 1000 or more in the 1996 or 2001 censuses, using the same procedure as for the metropolitan area. This sample frame comprised approximately 80% of the South Australian rural population.
One interview was conducted per household and, when more than one person over the age of 15 resided in that household, the respondent was the person who last had a birthday. Interviews were conducted by trained and experienced interviewers. For reliability purposes re-interviews for selected questions were conducted on a random 5% (1998) and 10% (2004) of each interviewer's interviews.
For the 1998 SAHOS, of the 4400 subjects initially sampled, 4289 were eligible. Of these, 408 were non-contactable, 658 refused, and 213 were absent, too ill or did not speak English; 3010 interviews were conducted; a 70% response rate. For the 2004 SAHOS, of 4700 initial cases, 532 were non-contac table or inaccessible, 202 were absent, did not speak English or were too ill, and 945 refused. The number of participants was 3015, a within-scope response of 72%. The South Australian Health Omnibus Advisory Committee independently vetted all questions in the survey and gave its ethical approval. Informed consent consistent with the Australian National Health and Medical Research Council requirements was obtained.
Measures
Demographics
Data were collected for gender, age, birth country, relationship status, education attainment, workforce participation, and overall health status.
Due to sparse data (i.e. where the numbers in cells would violate the assumptions for stable analyses), demographic variables were recoded for use in the multivariate analysis. The classifications were: age (15–30/31–45/46–60/ ≥ 61 years), birth country (Australia/Other (where other refers to those born in the UK/Ireland, North-West Europe, South-East Europe, Asia, and Other), and education (primary or high or trade/certificate or diploma/degree).
Depression assessment
Depression assessment was undertaken using the mood module of the Primary Care Evaluation of Mental Disorders (PRIME-MD) instrument, which has demonstrated reliability and validity in primary health-care settings [34], [35]. It comprises of 16 questions related to symptoms of depression experienced nearly every day for the last 2 two weeks (categorized ‘yes’/'no’), and was embedded in the broader SAHOS. Scoring to determine depression caseness was undertaken at the data analysis stage using the PRIME-MD method for detection of DSM-IV diagnoses [36]. The PRIME-MD allows the identification of individual mood disorders, but for the purposes of these analyses respondents were classified as having major depression, other depressions or no depression. The DSM-IV definition of major depression is a disorder characterized by a depressed mood or loss of interest or pleasure nearly every day for the last 2 two weeks with at least five characteristic symptoms (change in appetite or weight, sleep, and psychomotor activity; decreased energy; feelings of worthlessness or guilt; difficulty thinking, concentrating, or making decisions; or recurrent thoughts of death or suicidal ideation, plans or attempts). Other depression includes dysthymia, other depression and partial remission of major depression, determined on the basis of having symptoms of depression that were not sufficient to fulfil the criteria for major depression. This classification is consistent with the reported trend effect in morbidity and impact on quality of life for the three groups, those with no depression showing the least morbidity and impact, those with major depression the highest and those with other depressions being intermediate [37].
Data analysis
Data were double-entered and verified. Missing data were collected by follow-up telephone interview. Data were then weighted to benchmarks derived from the 1996 and 2001 censuses and 2002 Estimated Resident Population [38] to provide estimates representative of the South Australian population in terms of age, gender and region (metropolitan, non-metropolitan), probability of household selection and household size.
Categorical data were analysed using X2 test and continuous variables with analysis of variance. Logistic regression was used to examine adjusted models of depression.
All analyses were carried out using SPSS version 14 (SPSS, Chicago, IL, USA).
Results
Table 1 provides participant details. As shown, there was no significant difference between the 1998 and 2004 surveys by gender, country of birth, relationship status or health status. The 2004 cohort was older (mean 1998 age = 44 years, SD = 19 years) compared with 2004 mean age = 45 years (SD = 19 years), F = 8.68, df = 1,6023, p < 0.01), and was more highly educated and was less likely to be homemaking and more likely to be retired.
Demographic characteristics
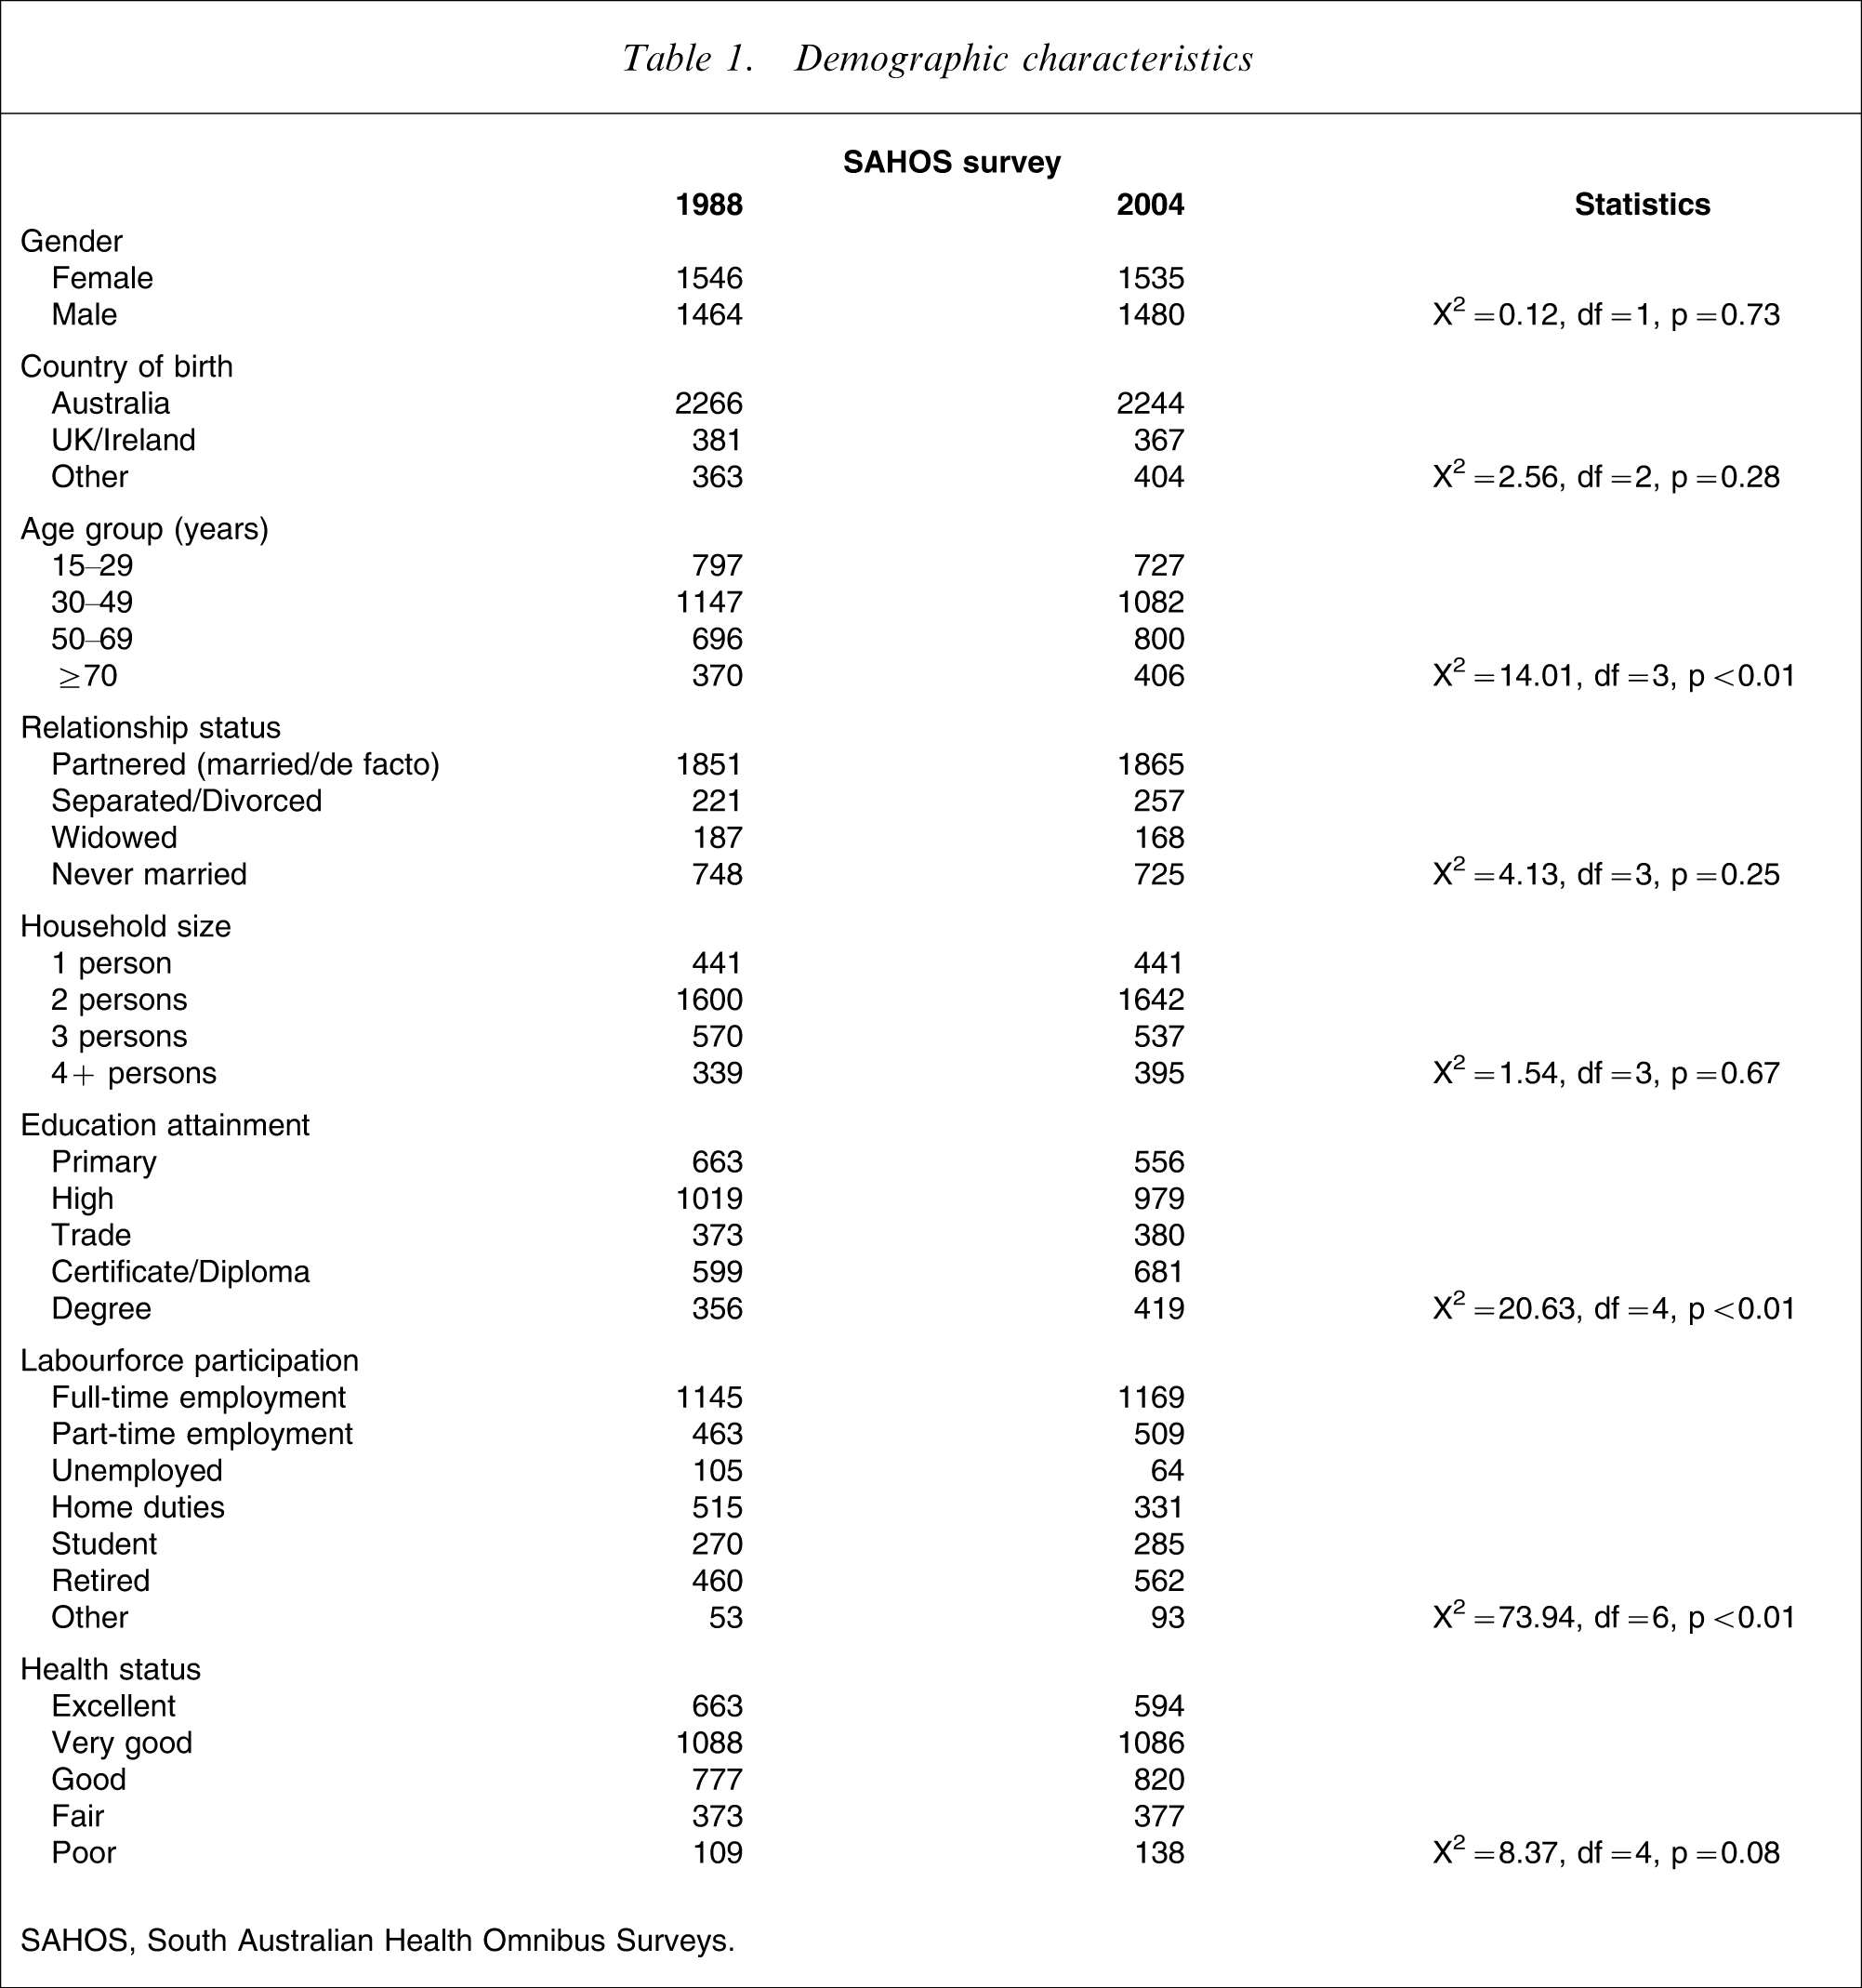
SAHOS, South Australian Health Omnibus Surveys.
Table 2 shows a univariate analysis of the proportions classified with depression for each of the two cohorts, by age group and gender. As shown in the table, there were no significant differences by gender by age group between 1998 and 2004. The largest differences in proportions were among females aged 15–29 and 30–49 years, both cohorts of which had a non-significant 4% increase in the proportion classified with major depression between 1998 and 2004. The only statistically significant finding reported in Table 2 is a decline in the proportion of those classified with other depression; this finding, however, was not confirmed in the multivariable analysis presented in Table 4.
Depression prevalence, by gender, age group and year, univariate analysis
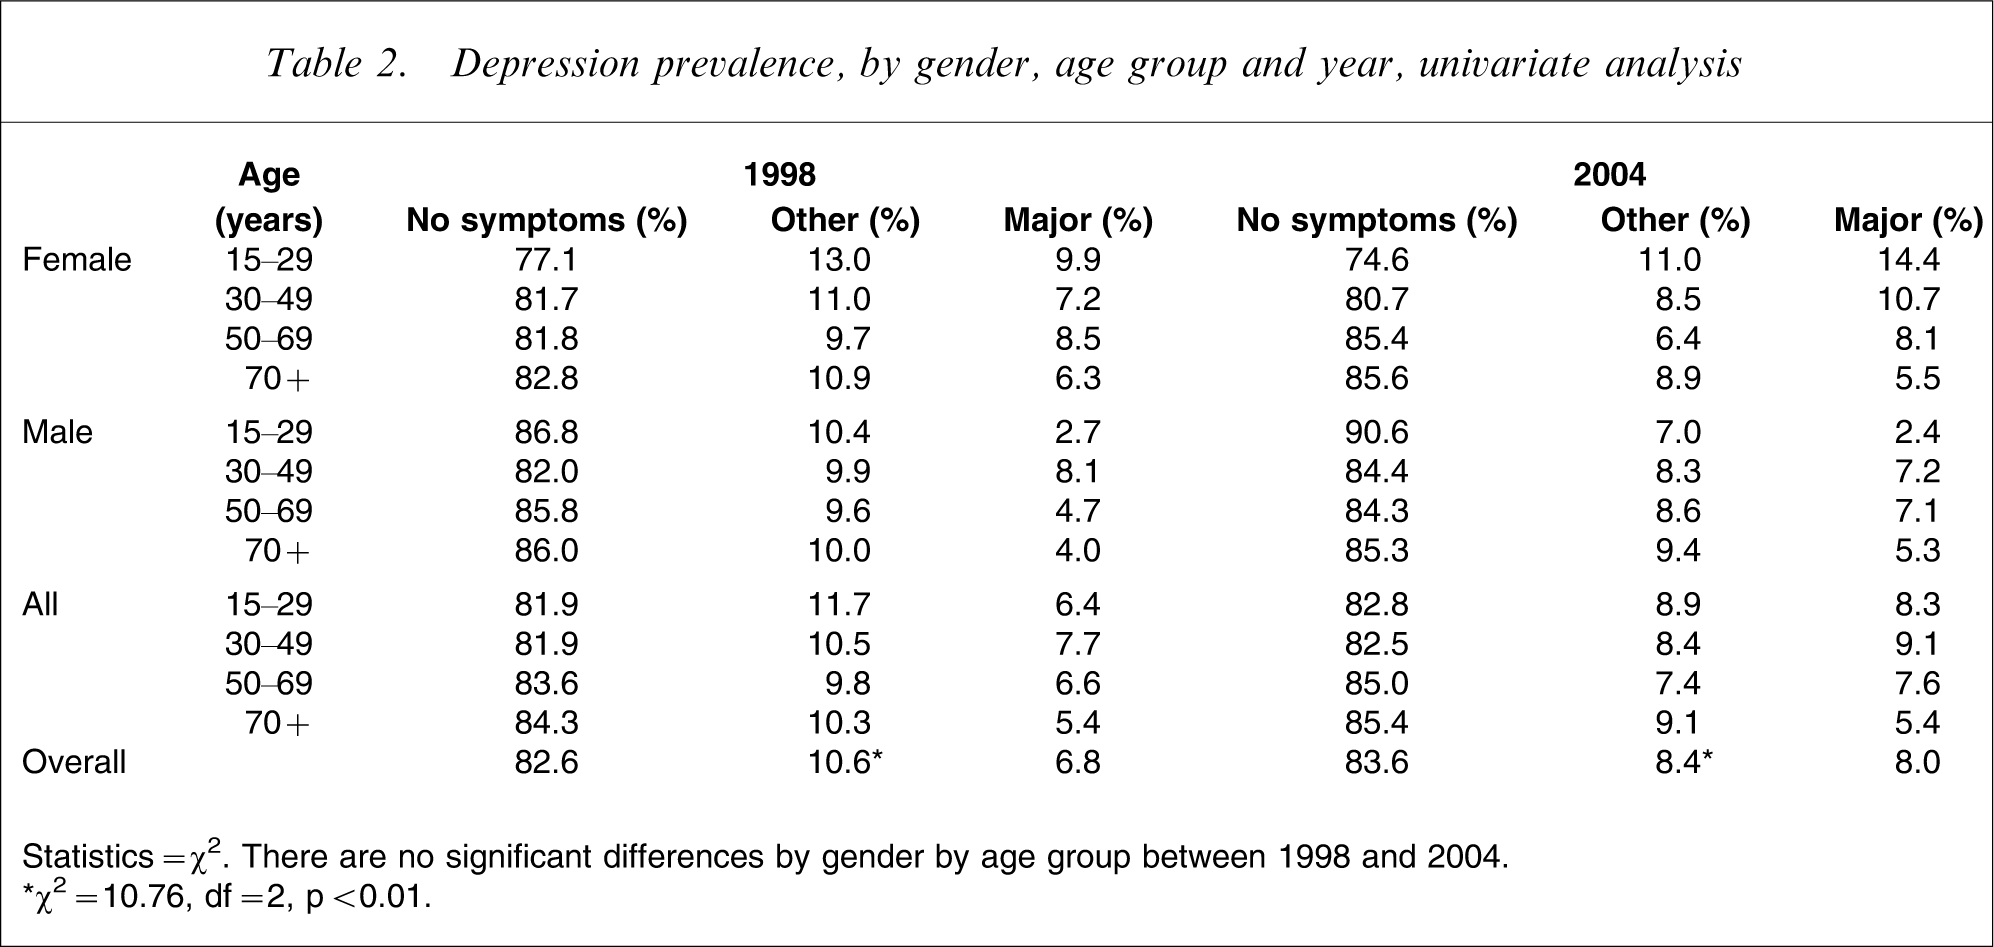
Statistics = χ2. There are no significant differences by gender by age group between 1998 and 2004.
∗χ2=10.76, df = 2, p < 0.01.
Examination of the relationship between depression classification and taking medication for depression showed that, among those with no symptoms of depression, in the 1998 cohort depression medication was taken by 1.6%, rising to 3.1% in 2004 (odds ratio (OR) = 1.98, 95% confidence interval (CI) = 1.32–2.97).
It is possible that the results in Table 2 were confounded by the differences in the samples reported in Table 1, and depression medication status. Table 3 shows a multivariable logistic regression model predicting major depression status, where the estimates over time are adjusted by differences in the cohorts.
Predicting major depression
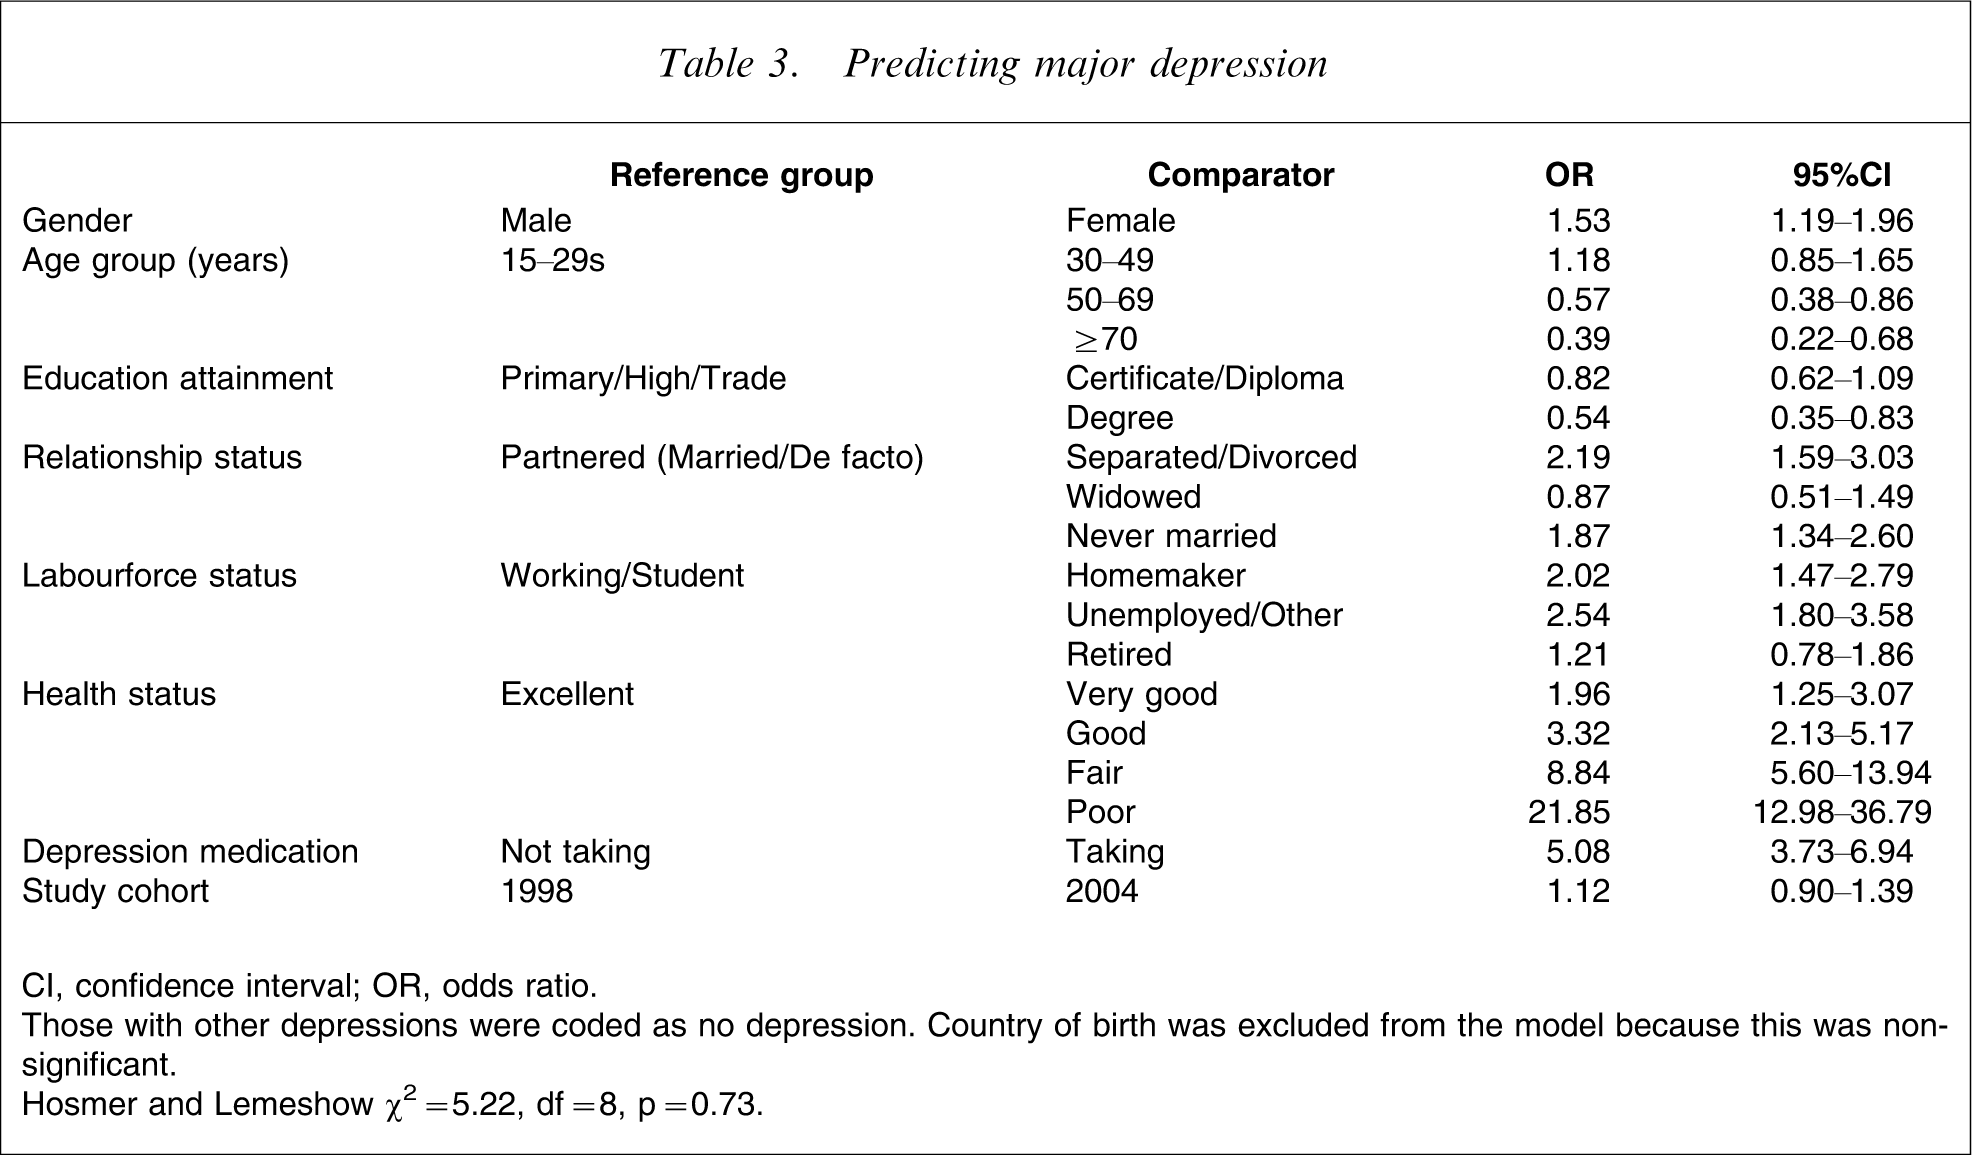
CI, confidence interval; OR, odds ratio.
Those with other depressions were coded as no depression. Country of birth was excluded from the model because this was non-significant.
Hosmer and Lemeshow χ2=5.22, df = 8, p = 0.73.
One variable excluded from the multivariable analyses in Tables 3–4 was household size. When we examined household size by depression we found a significant association. Those living alone were significantly more likely to be classified with both minor (excluding major depression cases) and major depression (excluding minor depression cases) than were those living with others (ORminor=1.52, 95%CI = 1.21–1.92; ORmajor=2.18, 95%CI = 1.72–2.76). However, the association between relationship status and household size showed that 97% of those who were living alone were not in a relationship (χ2=3,436.40, df = 9, p < 0.0001). Furthermore, of those living in a household with others and who were aged 15–19 years 53% had never partnered, suggesting that they were still living in the family home, most likely with their parents and/or siblings. We interpreted these findings to suggest that living alone or living with others was a function of a person's relationship and family status. We therefore excluded household size from the multivariate analyses because it would have been a confounder.
The significant predictors of depression, when compared with the reference groups, were being female (53% more likely to be classified with depression), being separated/divorced (2.2 times more likely) or having never married (87% more likely), being a homemaker (twice as likely), being unemployed (2.6-fold more likely), having very good overall health (twice as likely), good overall health (3.3 times more likely), fair overall health (8.8 times more likely) or poor overall health (21.9 times more likely).
The protective predictors were being older (those aged 50–59 years and those aged ≥70 years were 43% and 61% less likely to be classified with depression), and having completed a university degree (46% less likely).
An important finding was the higher proportion of females classified with depression when compared with males (Table 3). When examined by age group, however, in both the 1998 and 2004 samples this effect was confined to those aged 15–29 years (χ2 1998=19.81 and χ2 2004=40.24, both df = 2, p < 0.001; no other comparisons statistically significant).
As was expected, those taking depression medication were five times more likely to be classified with depression. To examine whether depression medication may have confounded the model (those without symptoms and who were taking depression medication may have unduly influenced the classification of depression), the model was re-run excluding depression medication. No significant changes to the model were observed, suggesting that the increase in depression medication between 1998 and 2004 played no significant part in ameliorating the prevalence of depression. The OR in the model excluding depression medication for year (2004 when compared with 1998) was 1.20 (95%CI = 0.97–1.48).
In short, there was no significant effect over time after adjusting for background variables. This adjusted multivariable finding is consistent with the univariate finding in Table 2.
The same analysis was conducted for other depressions, excluding those with major depression (Table 4). The significant predictors of other depression were, when compared with the reference group, being separated or divorced (69% more likely to be depressed), being unemployed/other (2.2 times more likely), having very good health (79% more likely), good health (2.4 times more likely), fair health (5.36 times more likely), poor health (11 times more likely) and taking depression medication (4.07 times more likely). The protective predictors were being older (aged 50–69 years and ≥70 years, both 43% less likely to be classified with other depression).
Predicting other depressions
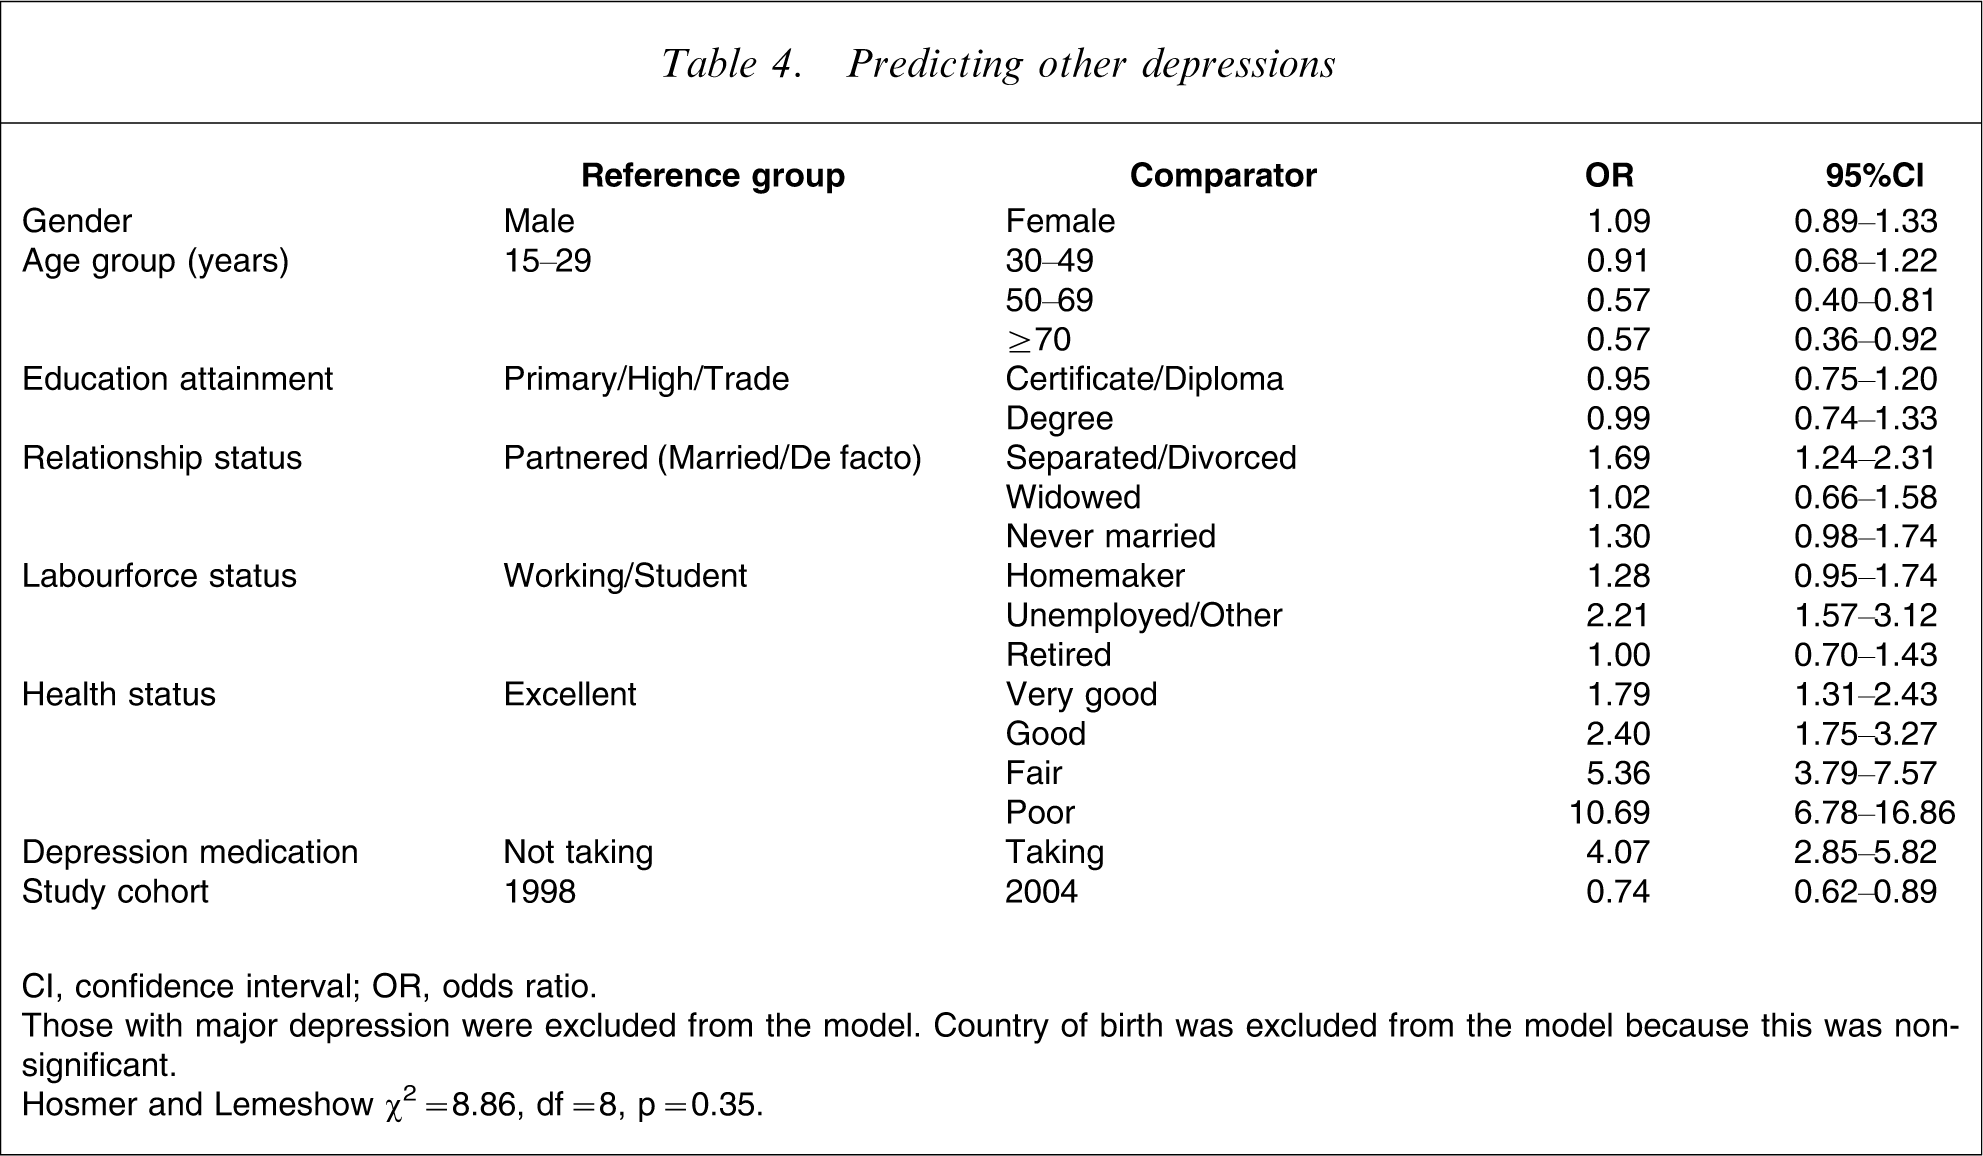
CI, confidence interval; OR, odds ratio.
Those with major depression were excluded from the model. Country of birth was excluded from the model because this was non-significant.
Hosmer and Lemeshow χ2=8.86, df = 8, p = 0.35.
Regarding the survey cohort, those surveyed in 2004, when compared with the 1998 cohort, were significantly less likely to suffer other depression, after adjustment for the other variables in the model. To examine the impact of depression medication on this finding, the model was re-run without this variable. No significant differences were reported for any of the variables in the model. The OR in the model excluding depression medication for year 2004 when compared with 1998 was 0.78 (95%CI = 0.65–0.93), compared with 0.74 for the full model in Table 4. A separate logistic regression analysis examined the relationship between current antidepression medication, depression classification and cohort year. The results showed a 90% increase in current antidepression medication (ORadj=1.91, 95%CI = 1.29–2.82) between 1998 and 2004, but no interaction effect between depression classification and cohort year. These two results suggest that the significantly increased consumption of current antidepression medication had no statistically significant effect on other depression classification between 1988 and 2004.
Discussion
This study examined depression prevalence over a 6-year period in South Australia. The two samples were drawn in the identical manner and were very similar in size, the instruments used and data collection methods.
The limitations of the study are that it was repeated cross-sectional rather than longitudinal, that the PRIME-MD may have misclassified cases, and that the time interval between 1998 and 2004 was too short to observe increases in depression prevalences. The repeated cross-sectional nature of the study, however, has the advantage that it allows for changes in the population to be reflected in the samples. In this case, the data were adjusted for potential differences through the use of multivariable analyses.
Regarding possible misclassification by the PRIME-MD, this would have affected both samples similarly. The PRIME-MD has demonstrated reliability and validity in primary health-care settings: Boyer et al. reported that when compared with physician diagnosis the sensitivity was 1.00 and the specificity 0.91 [34], [35]. Previous population-based prevalence studies have used other assessments including the Composite International Diagnostic Interview (CIDI) [27], [39]; psychiatric interviews [20], [40], the Hopkins Symptom Checklist-25 (HSCL-25) [5], the Research Diagnostic Criteria (RCD) or the DSM-III criteria [4] and the Diagnostic Interview Schedule (DIS) [7], [40]. In short, a wide variety of measures and/or interviews have been used in population prevalence studies. This diversity of measurement is consistent with Kendler and Gardner's contention that the classification of major depression is but a convenient cut-off along a continuum of symptoms [41]. Because there has been no direct head-to-head validation of these different measures (although most are based on either the DSM-III or the ICD-10) it is possible that different prevalence estimates are a function of measurement differences.
That the time interval may have been too short to detect increases in depression prevalence is unlikely given that significant decreases in other depression were observed (Table 2). It is acknowledged, however, that birth cohort studies showing increases in depression have typically compared retrospective rates over 30-year periods [1–7]. This observation raises the issue of study power to detect differences between the two cohorts. Based on sample size calculation for logistic regression [42], the study sample size would have been sufficient to statistically detect a difference of 16% compared with the observed difference of 12% in major depression.
Subject to these caveats, the findings showed that there was no significant increase in either major or other depression in South Australia between 1998 and 2004, as reported in our previous two papers [15], [16]. For major depression, this finding held for both the univariate analyses by gender and age group presented in Table 2 and the multivariable analyses presented in Table 3. The adjusted observed increase of 12% (Table 3) between 1998 and 2004 in major depression classification could have occurred by chance, subject to the caveat of study power. For other depression, on both the univariate and multivariable analyses (Tables 2 and 4) there was a statistically significant decrease in classification by 26% between 1998 and 2004. To our knowledge this is the first study reporting such an outcome, other than the longitudinal Swedish Lundby study, which reported lower incidence rates as participants aged. The authors attributed this to possible forgetfulness of mild episodes [20]. These findings are also consistent with the Canadian Stirling County Study, which collected data in three cross-sectional surveys conducted over a 40-year timeframe. Even acknowledging that there were variations between surveys, the researchers concluded that over the 40-years the rates of depression were stable, although there were gender and age re-distributions [21]. The results are also consistent with Sacker and Wiggin's finding that psychological distress remained stable in the UK between 1981 and 2000 [43].
The most likely cause of the reduction in other depression observed in the present study is the increased consumption of current antidepression medication (a 90% increase between 1998 and 2004), reflecting the hypothesis that these would ameliorate depression symptoms and that the main beneficiaries would be those with other depression. The sub-analysis of depression classification by current antidepression medication use reported here, however, did not support this hypothesis. Between 1998 and 2004 antidepressant medication rose 97% among those without symptoms, compared with a 73% increase among those classified with other depressions and a 63% increase among those with major depression. These findings raise the distinct possibility that the observed increase in antidepression medication was largely due to overprescription. The implication is that increased consumption of antidepression medication played no significant role in influencing depression prevalence at the community level – indeed it is consistent with Mulder's contention concerning the ‘medicalisation of unhappiness’ [44] and other recent findings concerning the lack of efficacy of antidepression medication [45]. Our findings are also consistent with those from an Italian study reporting no decline in hospital admission for depression despite increases in antidepressant medication consumption [46].
As shown in Table 2, the overall unadjusted prevalence of major depression was 7.4% (6.8% in 1998 and 8.0% in 2004), and for other depression it was 9.5% (10.6% in 1998 and 8.4% in 2004). These findings are consistent with, but slightly higher than, other Australian-based population studies into depression prevalence. The 1997 Australian National Survey of Mental Health and Wellbeing of Adults, using DSM-IV criteria and the CIDI, reported a 12 month prevalence of 5.1%, with 3.4% for males and 6.8% for females [27], [39]. Andrews et al. reported a 12 month prevalence for major depression of 6.7% and a 1 month prevalence of 3.3% [27]. Additionally, 1.3% of the population suffered from dysthymia (ICD-10 criteria) over 12 months and 1.1% over the last month. Re-analysis of the same data provided Henderson et al. with 12 month prevalences of 5.8% overall, and 7.4% and 4.2% females and males, respectively [29]. Although there are several possible explanations for these differences, including sampling methodology, response bias or response artefacts, or inclusion of ‘brief depression’ [47], Goldney et al. noted that they may be due to the CIDI exclusion criteria, which were designed to exclude those with symptoms due to medications, alcohol or drug use, a physical illness or injury, those who had not consulted a clinician, who considered their condition did not interfere a ‘lot’ with their everyday life and those who had taken medication for their symptoms [48]. None of these exclusions applied in the present study.
Consistent with other reports and reviews [1], [3], [6], [21–25], [30], [32], [39], [47], [49], females were significantly more likely to be classified as suffering depression when compared with males (Table 3). However, sub-analyses of this finding by age group showed that this was confined to those aged 15–29 years; there were no significant differences between males and females in any other age groups for either the 1998 or 2004 surveys. It should be noted that few previous studies reporting gender differences have broken these down by age groups. Myers et al. showed similar results in the US Epidemiologic Catchment Area study, although the peak years for females were between 25–44 years [22]; Kessler et al. reported results consistent with those of this study [23]. In their reporting of the results from the US National Comorbidity Survey they showed that the highest prevalence rate was among those aged 15–24 years although they did not break this down by gender. The only recent study reporting this appears to be the Stirling County study, which reported that the highest prevalence was among younger females [22]. Previously both Klerman, and Jorm, in review articles, had reported higher prevalences among younger females [7], [24]. Sacker and Wiggins reported the same finding for general psychological distress [43]. Three possible explanations are that: (i) this is due to differences in social roles [24]; (ii) young men are more likely to forget depression episodes and women to remember them [50]; or (iii) due to changes in mental health literacy younger females may be more likely to recognize depression symptoms earlier and seek treatment for these [15], [51]. All three possible explanations would be consistent the Wilhelm and Parker's observation that there may be a need for different classification definitions in epidemiological studies [50]. This finding is therefore important, suggesting that public health interventions may be most effective where they are age and gender cohort targeted.
That there was no significant increase in depression prevalence among older adults (Table 2) is consistent with the literature disputing the stereotyping of ageing [25], [26]. This may be partly due to the use of a standard diagnostic instrument, the PRIME-MD, which attempts to classify cases based on DSM-IV clinical criteria. This finding is consistent with Klerman's observation that depression increases in the elderly are associated with instruments that assess symptoms (older people report more symptoms) but not when assessments rely upon clinical classifications [7].
The statistically significant lower rates of both major depression and other depression among those aged ≥50 years may reflect that mental health (other than cognitive impairment, such as dementia) seems to improve over the lifespan [10], [28], [31], [52–56], perhaps due to a decrease in negative affect [57], leading to discounting of negative feelings that may be more important to younger adults. Certainly the findings from this present study are consistent with other reports showing that older adults have lower prevalences when compared with younger adults [22], [27–32], although this is not confirmed in all studies [58].
The finding of lower probabilities of depression classification among older adults has implications for the increasing depression hypothesis. Examination of the data by birth cohort by age of onset, as has been widely done in studies showing increases in depression [2], [3], [6], [7], [59], was not possible because age of first depression onset was not collected. The implication, however, is that discounting of negative experiences could partly explain birth cohort findings, particularly given that age of onset studies generally rely upon memory for age of first onset – a method that is notoriously inaccurate because it ignores memory effects that systematically distort recall of health problems [20], [47], [60–62], particularly where there is a long time between assessments, temporary exacerbation or remission of health conditions [63], and Hawthorne or placebo effects [64], [65].
Another possible explanation of differences between studies may relate to continued study participation in longitudinal studies, where as few as 50% of the original participants may be available for follow-up analyses [20]. The repeated cross-sectional design of this study overcomes this as an explanation of the study findings.
The key predictor of depression in the multivariable analyses presented in Tables 3 and 4 was overall health status, suggesting a direct relationship between health and depression. This finding is consistent with previous reports showing that prior physical health, disability and social support play major roles in the onset of depressive symptoms [66–68] and are strongly associated with current depression status [37], [69–72]. The other significant predictors (labourforce participation, education attainment and relationship status in Tables 3 and 4) are also consistent with the literature [32], [73], suggesting a complex web of social factors co-existing with, caused by or causing depression. We note that the univariate relationship between living alone and depression is also consistent with the literature [72], although the findings suggest it is confounded with relationship status. These findings suggest that mental health programmes aimed at treating depression need to go beyond simple mental health care if such treatments are to have population-wide impacts. It is possible that these relationships partly explain the very limited impacts reported above of antidepression medication: if the causes and associations of depression symptoms are not addressed, medication by itself may have limited effect.
Conclusion
This is the first Australian study to examine the increasing depression hypothesis. Although doubts about this hypothesis first surfaced over 20 years ago, the hypothesis still has widespread currency and has been used to predict the burden of disease in the future.
Using a repeated cross-sectional study design over a 6-year period, with more than 3000 participants at each wave, where the data were weighted to be representative of the South Australian population, no statistically significant increases in either major or other depressions were observed regardless of whether univariate or multivariable analyses were used. Indeed, the only over-time statistically significant finding over time showed a reduction in the proportion of cases classified with other depression.
The other significant findings were that current major and other depressions decreased with aging and that the cohort with highest levels of major depression were females aged 15–29 years.
The results of this study, whilst in need of replication over a longer period of time, would suggest that it is time for the conventional wisdom that depression is increasing to be reconsidered, and for a more realistic perspective, developed from evidence-based analyses, to be accepted.
Footnotes
Acknowledgements
This study was support by unrestricted grants from Ely Lily Australia, Janssen-Cilag, Lundbeck Australia, Organon Australia, Sanofi-Synthelabo, Wyeth Australia, Ramsay Health Care Australia and University of Melbourne. None of these organizations participated in the design of the study, the analysis of the data or in the preparation of the manuscript.