
Abstract
Several lines of evidence suggest that v-akt murine thymoma viral oncogene homolog 1 (AKT1; a serine-threonine kinase also known as protein kinase B, PKB, RAC, and PRKBA) is implicated in the regulation of intracellular signaling pathways that might be important to synaptic transmission and neuronal plasticity [1]. Moreover, AKT1 is an important component of a recently discovered neuronal signaling pathway that is activated by dopamine type 2 receptor agonists and that is distinctive from cAMP-mediated D2 signaling [2].
Emamian et al. provided evidence that AKT1 may be a susceptibility gene for schizophrenia in families of Northern European ancestry on the basis of convergent evidence for impairment of AKT1-glycogen-synthasekinase-3β (GSK3β) signaling [3]. Briefly, the Emamian et al. study showed that levels of AKT1 protein and phosphorylation of GSK3β at Ser9 in lymphocytes and frontal cortex were significantly lower in patients with schizophrenia (n = 28) in comparison with controls (n = 28). In addition, AKT1 knockout mice treated with amphetamine showed reduced prepulse inhibition, an impairment in sensorineural gating reminiscent of that seen in patients with schizophrenia. Moreover, phosphorylation of AKT1 and GSK3β were increased in mice after haloperidol treatment. In human samples (n = 335), haplotypes containing two of five single-nucleotide polymorphisms (SNPs; SNP1–5) in AKT1 were associated with schizophrenia. A three-SNP haplotype (SNP2-SNP3-SNP4, T-C-G) was significantly associated with schizophrenia (relative risk = 1.8, p = 0.0006) and a two-SNP haplotype (SNP2-SNP3, T-C) was associated with lower AKT1 protein levels.
There have been four published attempts at replication. In a sample of Japanese ancestry, Ikeda et al. genotyped the five SNPs used by Emamian et al. and an additional SNP (rs2498804) in a case–control sample of 507 Japanese schizophrenia and 437 control subjects [4]. They reported a positive association for SNP5 (p = 0.0037) and for haplotypes constructed from SNP5 (p = 0.00011 for the most significant haplotype, SNP3-4-5, C-G-A). Ohtsuki et al. tried to confirm the association of AKT1 haplotypes with schizophrenia in an independent Japanese sample consisting of 559 unrelated patients with schizophrenia and 567 controls [5]. The five SNPs studied by Emamian et al. were used in that study but there were no significant associations with schizophrenia. The frequency of the core risk haplotype reported by Emamian et al. (T-C for SNP2–3) did not differ significantly between patients with schizophrenia (0.141) and controls (0.154). Schwab et al. also investigated the same five SNPs analysed by Emamian et al. along with two additional SNPs (SNP1a, rs2498784; SNP2a, rs10149779) in a sample of 79 Caucasian sib-pair families [6]. A statistically significant over-transmission was reported for SNP3 (p = 0.027), SNP2 (p = 0.011) and SNP2a (p = 0.002) with the SNP1–SNP2a–SNP3 haplotype having the smallest p (p = 0.0013). Liu et al. genotyped these five SNPs in 218 co-affected schizophrenia Taiwanese families and found no association of both single locus and haplotypes of these SNPs with schizophrenia in this population [7].
Genetic analysis using endophenotypes in schizophrenia, although still under-utilized, can be a useful strategy in dissecting the complex genetics underlying this disease [8]. Endophenotypes are hypothesized to correlate with disease liability more directly, thus resulting in increased statistical power for a given sample size. Additionally, this approach can also help resolve difficulties in defining the boundaries of spectrum disorders such as schizophrenia, and better understand its clinical heterogeneity. Neurocognition is a plausible endophenotype for schizophrenia. Neurocognitive impairment is present at the first episode of psychosis, and represents a better predictor of outcome relative to any other symptom domain [9–12].
Investigating AKT1 and neurocognition is reasonable based on evidence for AKT1 involvement in memory formation from two main research findings: increased phosphorylation of AKT observed in amygdala after long-term potentiation and fear-conditioning training [13]; and increases in brain-derived neurotrophic factor-dependent phosphorylation of AKT1 in the hippocampus in parallel with spatial reference and working memory formation [14].
Therefore, the goal of the present paper was to investigate the association of genetic variation in AKT1 with neurocognition in patients with schizophrenia. The sample was drawn from the Clinical Antipsychotic Trials of Intervention Effectiveness (CATIE) study [15] and, to our knowledge, is one of the largest samples in which a broad assessment of neurocognitive function has been completed in schizophrenia.
Methods
Subjects
All subjects were participants in the CATIE project (NIMH contract NO1 MH90001), which was carried out between January 2001 and December 2004 [15]. Briefly, CATIE was a multiphase randomized controlled trial of antipsychotic medications involving 1460 unrelated persons with schizophrenia followed for up to 18 months, ascertained from a range of distinct clinical settings across the USA [15, 16]. Written informed consent (including an additional consent for genetic studies) was provided by all participants (patients or their legal guardians), and the complete study protocol was reviewed by Institutional Review Board at University of North Carolina and at participating study sites.
A preliminary diagnosis of schizophrenia was established by the referring psychiatrist. Final study diagnoses were independently re-assessed by CATIE personnel, using the Structured Clinical Interview for DSM-IV (SCID) [17] and all available information (including psychiatric and general medical files) along with one or more subject interviews.
Inclusion criteria were definite diagnosis of schizophrenia [17, 18], age 18–65 years, clinical decision that oral medication was appropriate, adequate decisional capacity, and provision of written informed consent. Exclusion criteria (see Table 2 in Stroup et al. for a complete list [16]): briefly, patients were excluded if they had received a diagnosis of schizoaffective disorder, mental retardation, or other cognitive disorders; had a history of serious adverse reactions to the proposed treatments; had had only one schizophrenic episode; had a history of treatment resistance (defined by the persistence of severe symptoms despite adequate trials of one of the proposed treatments or prior treatment with clozapine); were pregnant or breastfeeding; or had a serious and unstable medical condition. Individuals with psychoactive drug use disorders were included but only when there was positive evidence that schizophrenia was an independent diagnosis.
Peripheral venous blood samples were obtained and sent to the Rutgers University Cell and DNA Repository (RUCDR) where cell lines were established via Epstein Barr Virus transformation. Sample DNA concentrations were quantified and normalized via the use of Picogreen dsDNA Quantitation Kits (Molecular Probes, Eugene, OR, USA).
SNP selection, genotyping, and quality control
All genomic locations are based on the UCSC hg16 translation of National Center for Biotechnology Information build 34. The approved Human Genomic Organization name for ‘v-akt murine thymoma viral oncogene homolog 1’ is AKT1 (aliases RAC, PKB and PRKBA) and its coordinates are chr14:104,306,734-104,333,061. SNP selection mirrored that used by Emamian et al. [3]. We used TaqMan 5′ exonuclease assays (Applied Biosystems, Foster City, CA, USA) [19, 20] to genotype these five SNPs with probes and primers designed and supplied by Applied Biosystems (Foster City, CA, USA). To pass quality control, we required that each plate have: no-call rates ≤5.0%, a random pattern of no-calls, and all genotypes in Hardy–Weinberg equilibrium (HWE) when stratified by inferred ancestry (departures from HWE may be indicative of markers that should be further examined for genotyping accuracy problems). The overall no-call proportion was 0.013. Agreement between 48 duplicate samples per SNP was 100%. Genotyping was conducted blind to all clinical data.
Neurocognitive phenotypes
The analyses reported in the present study are from the CATIE baseline dataset. The construction, implementation, and analyses of the neurocognitive data from CATIE are described at length elsewhere [21, 22]. This battery evaluated aspects of neurocognition that are robustly associated with schizophrenia, that could plausibly improve with treatment, and which were practical to do. There were 24 individual scores from 11 neurocognitive tests that were grouped into five domain scores (processing speed, reasoning, verbal memory, working memory, and vigilance). The main dependent variable was the composite neurocognitive score (standardized average of the five domain scores) [22]. As exploratory analyses, we also analysed the five standardized domain scores.
Statistical analysis
Each of the AKT1 polymorphisms was assessed to determine if the observed genotype frequencies were consistent with expected Hardy–Weinberg proportions using Pearson's chi-square tests. Pair-wise marker-marker linkage disequilibrium was assessed using Lewontin's D’ statistic and Devlin and Risch's squared correlation statistic, ▵2, as implemented in the computer program Haploview (version 3.2) [23].
Population stratification
This is a potential limitation of association studies [24, 25] and represents a serious concern in CATIE given its explicit intent to ascertain a diverse, clinically representative sample [15, 16]. Stratification effects are more likely with fewer strata and larger samples [26–28]. There are two preconditions for population stratification to yield false-positive results [29, 30] both of which can be assessed: the phenotypic distribution and the marker allele frequency differ across ancestral strata. If there is substantial evidence that population substructure exists in the overall CATIE sample for the markers examined here, we default to stratified analysis. CATIE subjects were allowed to select multiple racial categories (White, Black/African–American, American Indian or Alaska native, Asian, Native Hawaiian or Pacific Islander, or Other) and were also asked if they were Hispanic or Latino. Inferred ancestry was defined as ‘Africa only’ if a subject endorsed Black/African–American only; ‘Europe only’ if a subject endorsed White only; and ‘Other’ if any other racial category was endorsed. The rationale for use of inferred ancestry as an index of population stratification is described at length elsewhere [31]. To examine for evidence of the first precondition for population stratification, we assessed whether there was evidence for association between the phenotypes of interest and inferred ancestry, after adjusting for covariates. We investigated for evidence of the second precondition by examining allele frequencies across race/ethnic categories. In addition, we performed tests of genotype×inferred ancestry interaction in order to assess whether there was evidence for different levels of genotype–phenotype association across race, using ANCOVA models in PROC GLM (SAS/STAT Software, version 9; SAS Institute, Cary, NC, USA). Evidence for an interaction would suggest that all association analyses should be stratified by race/ethnicity.
Genotype association
We used analysis of covariance (ANCOVA) models, implemented in SAS version 9.1 (SAS Institute), to test for association between individual AKT1 SNP genotypes and the outcomes, while adjusting for covariates. The continuous outcomes–neurocognitive composite score and the five domain scores (processing speed, reasoning, verbal memory, working memory, and vigilance)-were first examined for adherence to distributional assumptions, including approximate normality of conditional on covariates and homoscedasticity of the model residuals. For all outcomes, covariate adjustment was made for reading subtest of the Wide Range Achievement Test - 3rd Edition, Positive and Negative Syndrome Scale (PANSS) negative symptom scale scores, years since an antipsychotic was first prescribed, education, and any recent exacerbation. Models for composite neurocognitive score were additionally adjusted for age and clinically significant drug use. We used permutation tests to assess the overall statistical significance of our findings after correcting for multiple tests. Specifically, we randomly permuted the genotype vectors, preserving marker–marker linkage disequilibrium (LD), across subjects and utilized the minimum p obtained from the F-tests estimated from the ANCOVA models as the test statistic. We performed haplotype analysis using the R (version 2.1.1) [32] function haplo.score (contained in version 1.2.0 of the haplo.stats library) [33].
Project context
AKT1 was the second gene completed and analysed in the CATIE baseline sample, and all SNPs genotyped are reported. Additional genes are under investigation (see http://www.med.unc.edu/∼pfsulliv/downloads.htm for an updated list). We have attempted to follow published guidelines for association studies [25, 34, 35].
Results
Sample description
The sample for the present report is based on 641 CATIE subjects who provided DNA samples while the study was under way, and who had a valid baseline composite neurocognitive score. Demographic, clinical, and neurocognitive descriptors are shown in Table 1. The median age of the sample was 42 years and males comprised 73.8% of the sample. Most subjects were unmarried and unemployed, and the median years of formal education was 12 (equivalent to completion of high school). The sample was racially and, by inference, ancestrally diverse. Subjects had first received antipsychotic treatment a median of 13 years before study baseline. The median clinician global severity was 4 (moderately ill) and approximately one-quarter of the sample had recently been hospitalized or received crisis treatment. A sizeable minority of subjects had lifetime or current drug or alcohol abuse or dependence (46.2% and 31.1%, respectively).
Descriptive data for CATIE subjects included in the present report (n = 641)
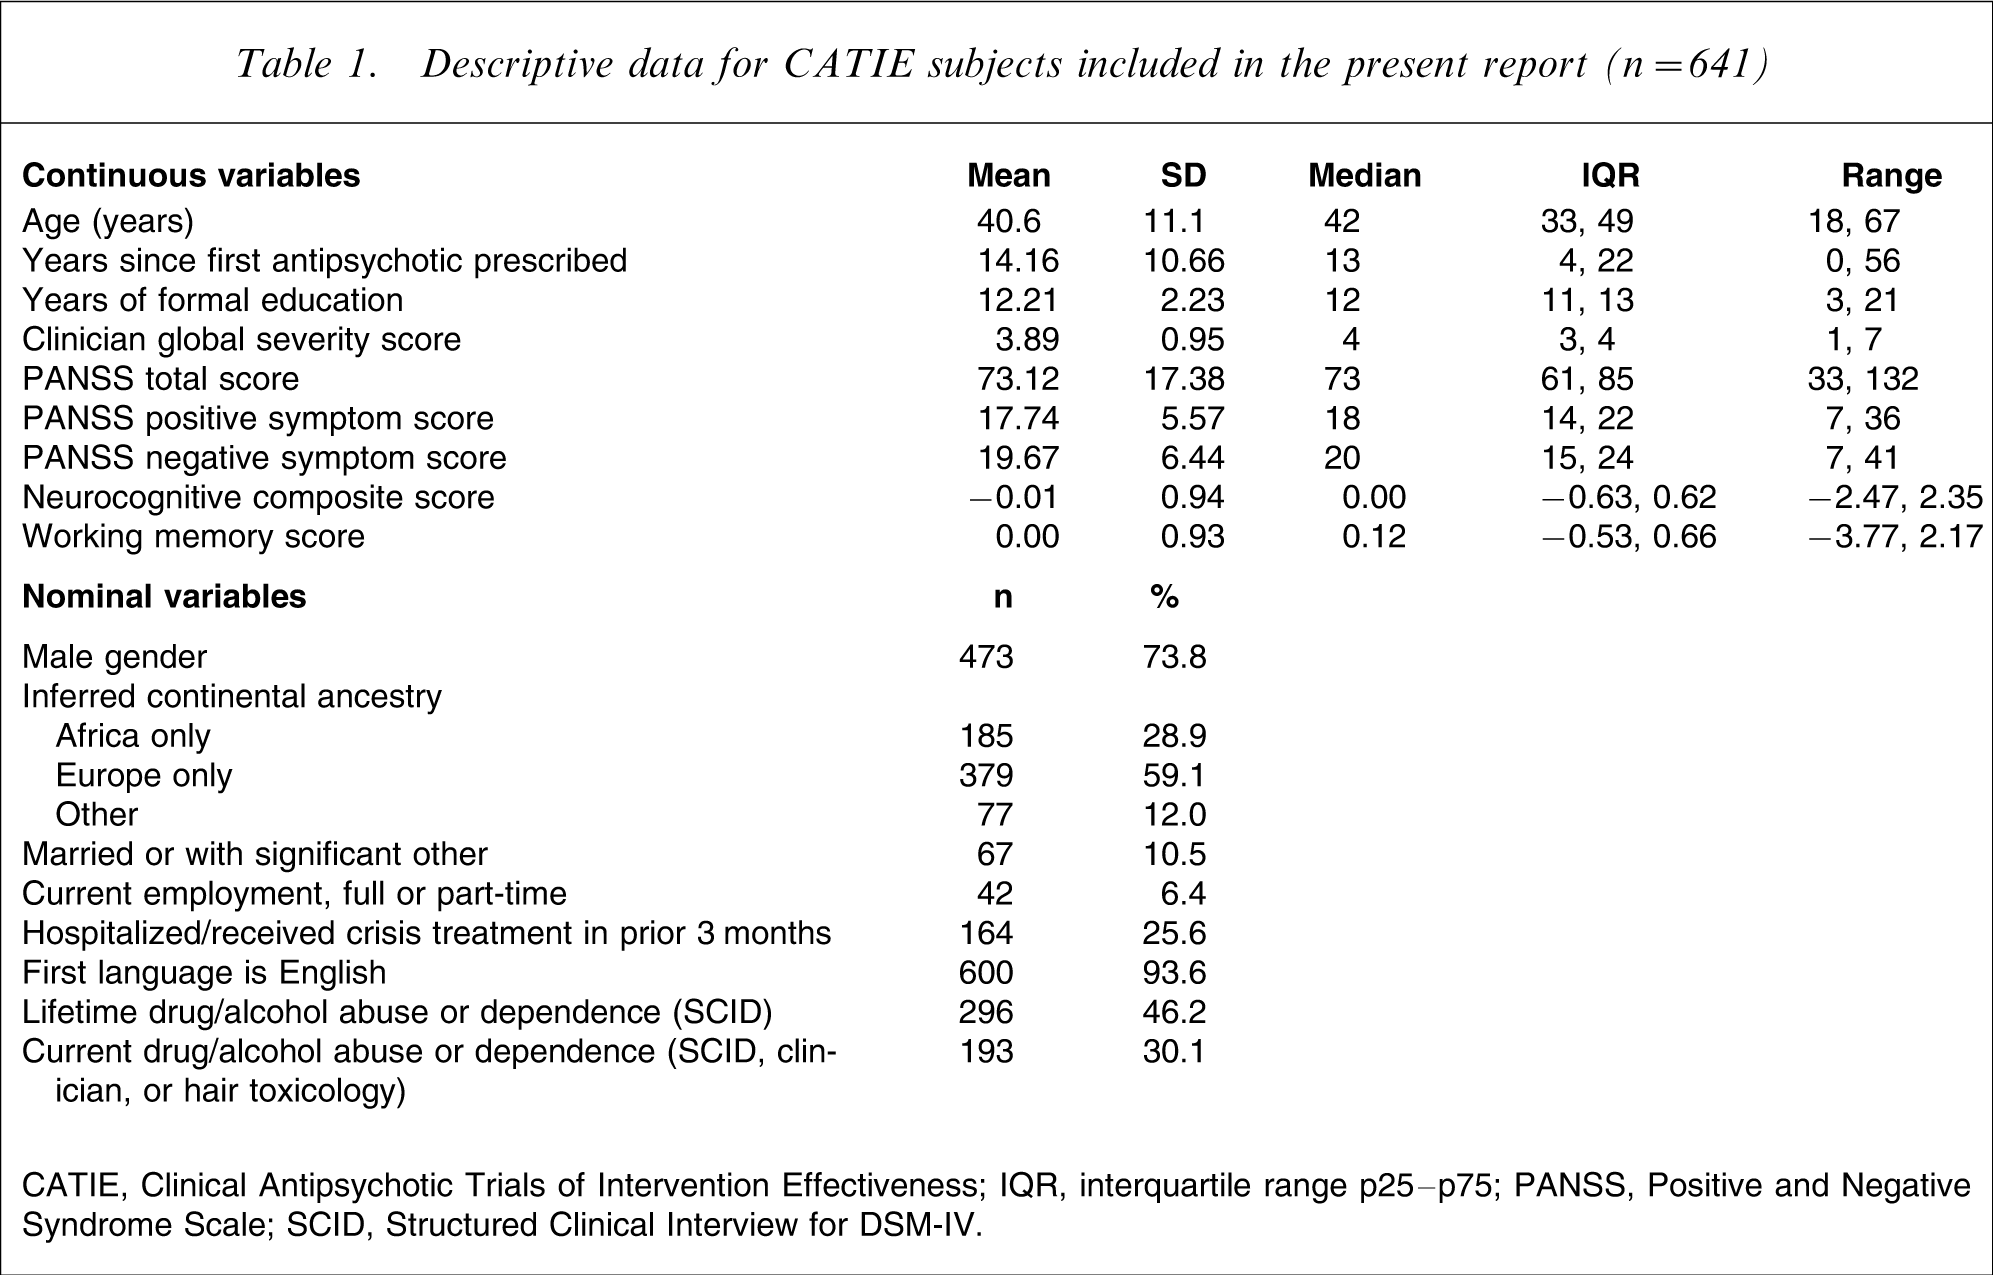
CATIE, Clinical Antipsychotic Trials of Intervention Effectiveness; IQR, interquartile range p25–p75; PANSS, Positive and Negative Syndrome Scale; SCID, Structured Clinical Interview for DSM-IV.
Regional map
Figure 1 depicts the genomic region of AKT1 and shows the location of the five AKT1 SNPs genotyped.
Depiction of the genomic context of AKT1. At the top are general genomic data along with an ideogram depicting chromosomal position. The topmost track shows the three AKT1 isoforms with the direction of transcription indicated by > (5’ → 3’) or<(5’ ← 3’), exons by vertical bars, and ‘U’ indicates the presence of an untranslated region. The next track shows the findings of the extant studies of AKT1 and schizophrenia. The next track shows single-nucleotide polymorphisms (SNPs) genotyped in the present study (grey, non-significant findings; black, significance at p < 0.05). All data map onto UCSC hg16/NCBI Build 34.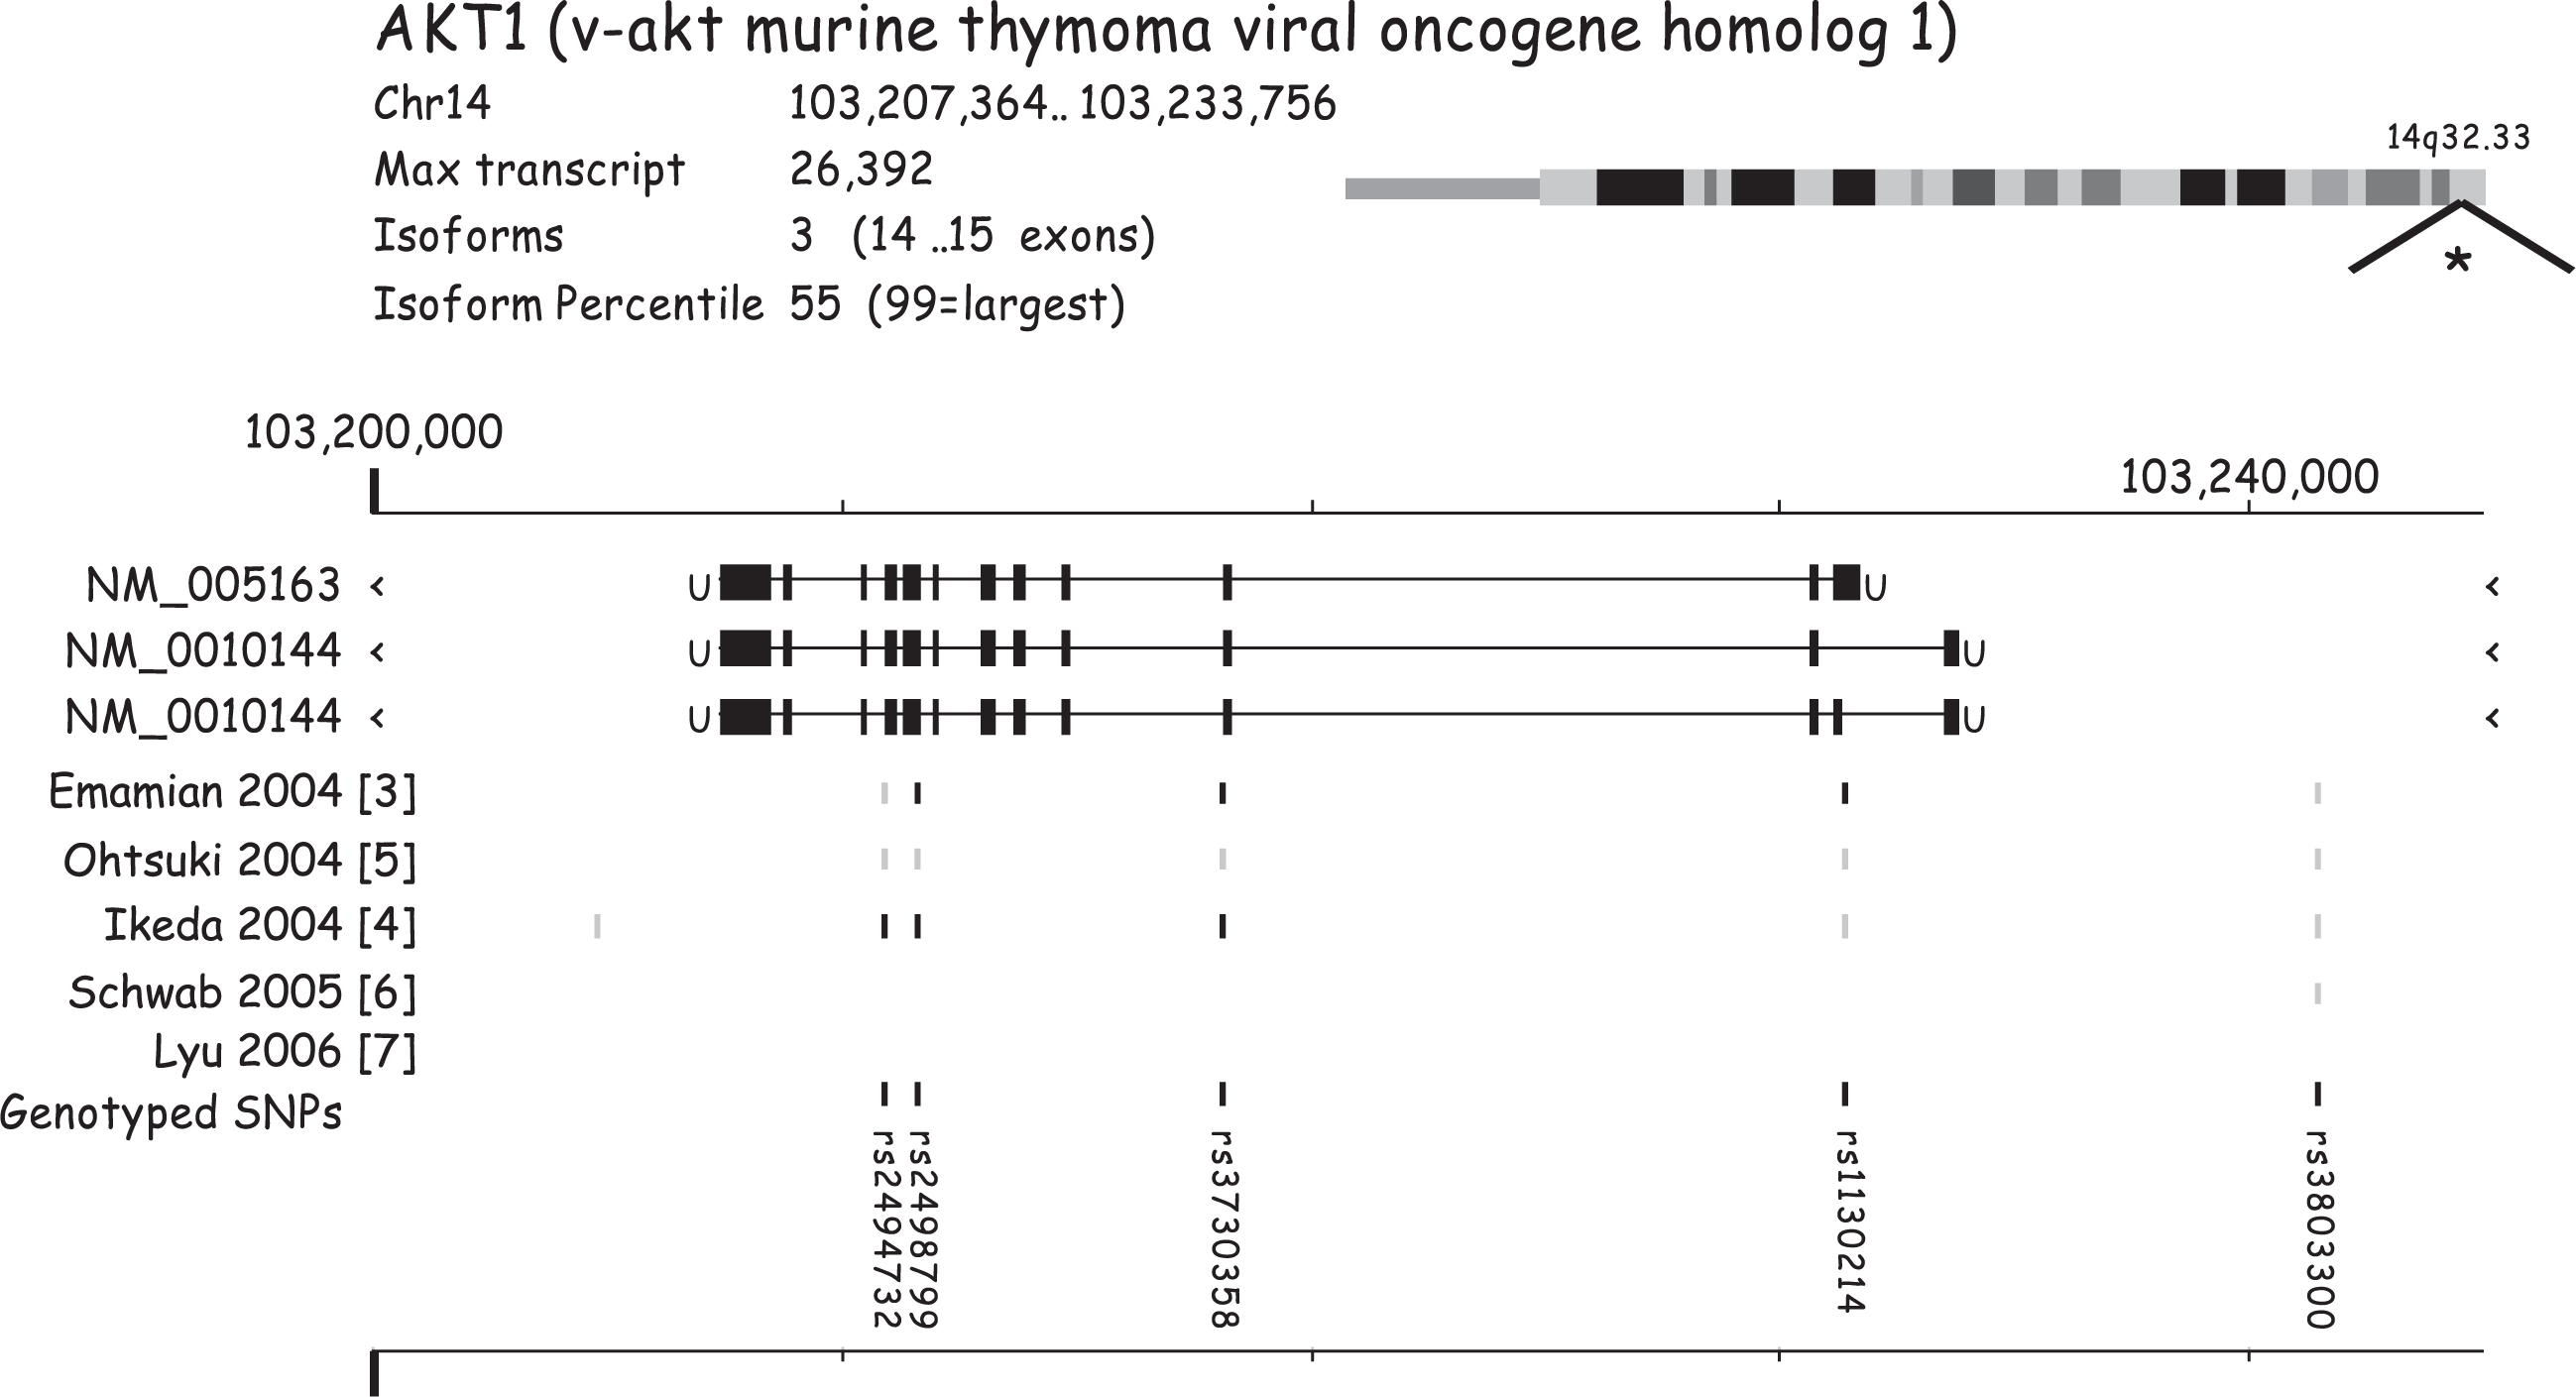
Genotype data
Table 2 summarizes the genotype data for five AKT1 SNPs. There were no deviations from HWE for any SNP at the p < 0.001 level although the p values for all subjects for rs2498799 and ‘other’ subjects for rs3803300 neared this threshold.
Genotype data for five SNPs in AKT1
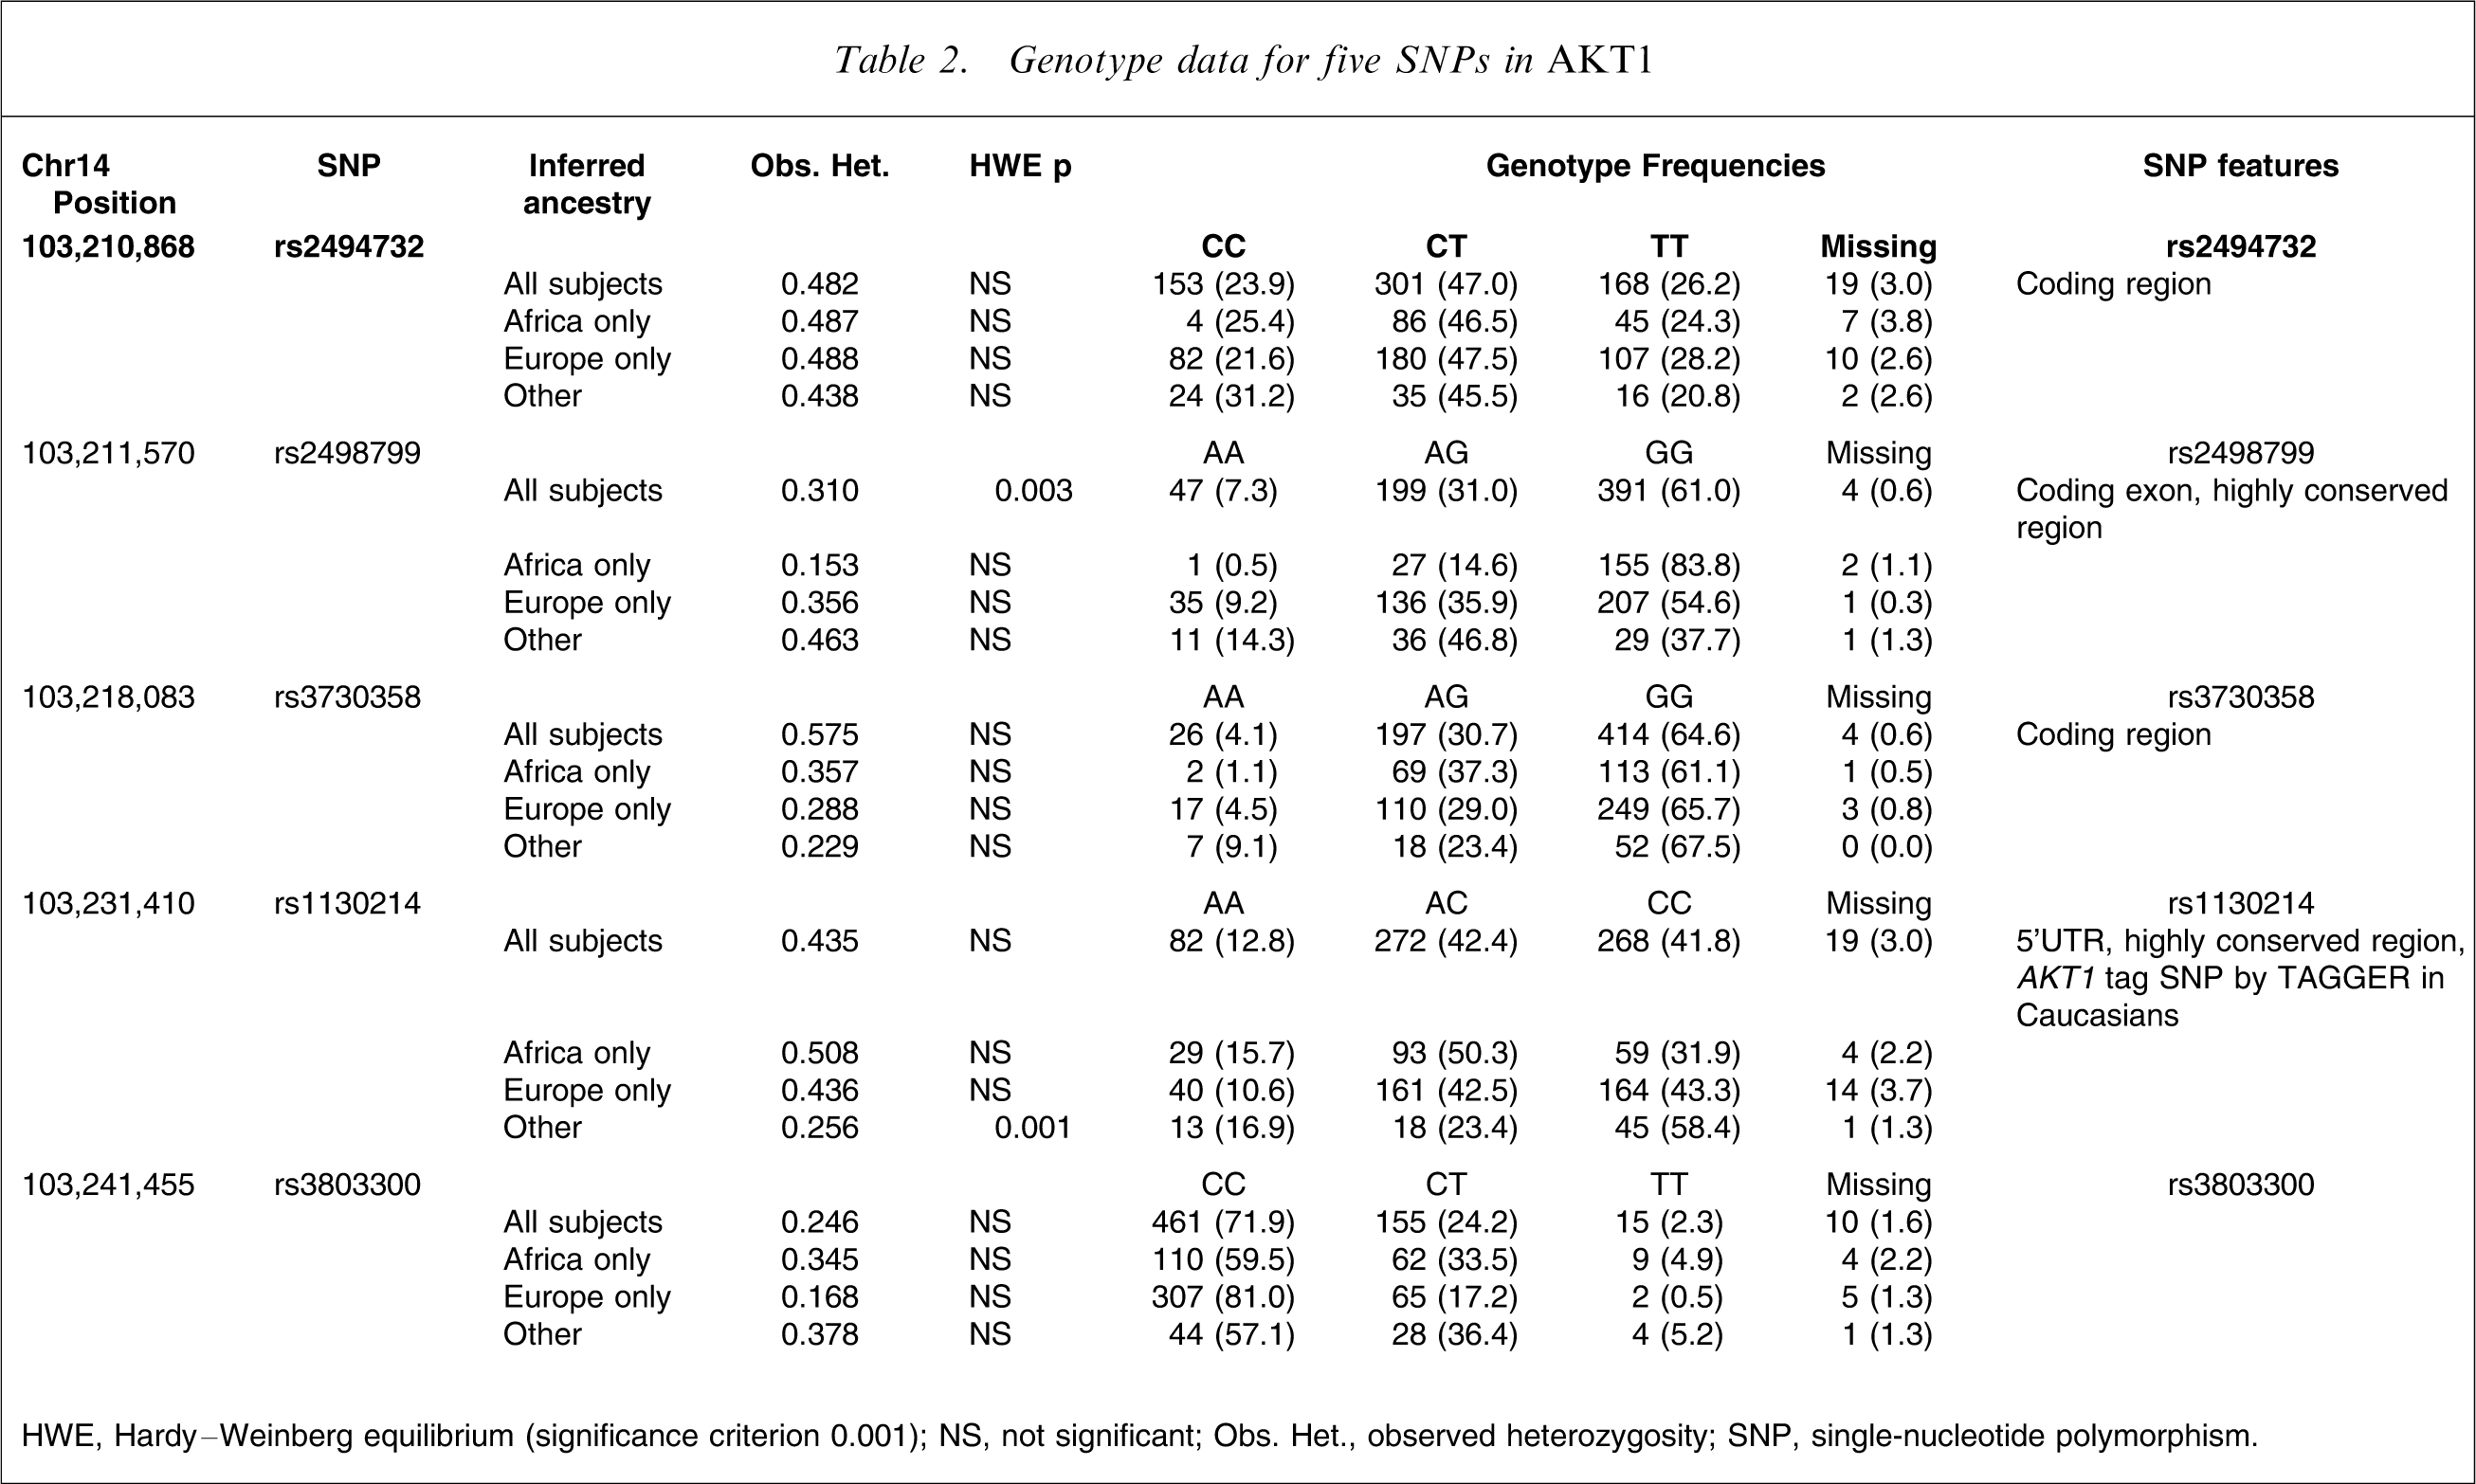
HWE, Hardy–Weinberg equilibrium (significance criterion 0.001); NS, not significant; Obs. Het., observed heterozygosity; SNP, single-nucleotide polymorphism.
Population stratification
After we adjusted the composite neurocognitive score for seven empirical covariates (reading subtest of the WRAT-3, PANSS negative symptom scale scores, years since an antipsychotic was first prescribed, age, education, any recent exacerbation, and no clinically significant drug use), there was no residual association with inferred ancestry (p = 0.68). We tested the second precondition for population stratification by estimating the interaction effects between each SNP and inferred ancestry. The dependent variable was the composite neurocognitive score. The independent variables were each of the five AKT1 SNPs in turn, inferred ancestry, SNP×ancestry interaction, and the appropriate empirical covariates (10 models in total). The p values for all 10 tests of interaction terms were >0.10. Based on these data, we judged that the second precondition for population stratification was not notably present for any of these AKT1 SNPs. Therefore, we performed all subsequent association analyses on the combined sample and adjusted for the main effects of race/ethnicity.
Testing for association
The neurocognitive composite score displayed an approximate normal distribution. We examined five ANCOVA models, one for each SNP adjusting for covariates (Table 3). There was no significant asymptotic or empirical evidence for association between any SNP and either dependent variable.
SNP associations from fully adjusted ANCOVA model
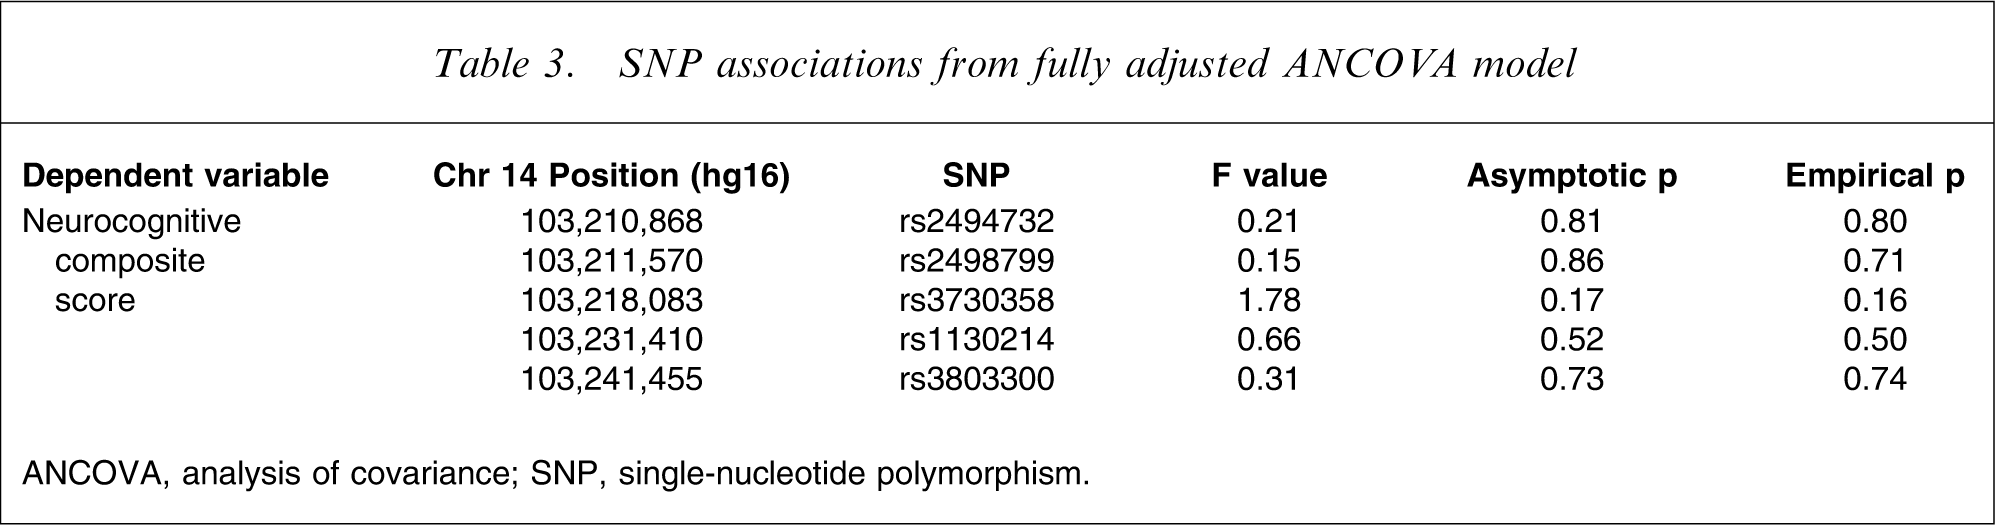
ANCOVA, analysis of covariance; SNP, single-nucleotide polymorphism.
We investigated the association of SNP haplotypes with the neurocognitive composite score (also adjusting for seven empirical covariates). We observed marginally significant evidence for association for the neurocognitive composite score with five-SNP haplotypes defined by rs3803300–rs1130214–rs3730358–rs2498799–rs2494732 (global score statistic 19.51, df = 9, permutation p = 0.02). This modest association was not consistent with previous haplotype associations from the literature [3, 4, 6]. However, it can be argued that the haplotype analyses are the most powerful analytic strategy. We believe this finding should be interpreted with caution and with cognizance of the possibility of a chance finding.
Exploratory analyses
We also analysed the five neurocognitive domain scores as exploratory analyses. Standardized scores for processing speed, reasoning, verbal memory, working memory, and vigilance were the components of the neurocognitive scores. There were 25 statistical tests for these variables (five SNPs×five domain scores), and none reached statistical significance.
Linkage disequilibrium
The five SNPs studied in the present report span a distance of 30.6 kb, and the patterns of LD are shown in Table 4.
Patterns of linkage disequilibrium for five AKT1 SNPs
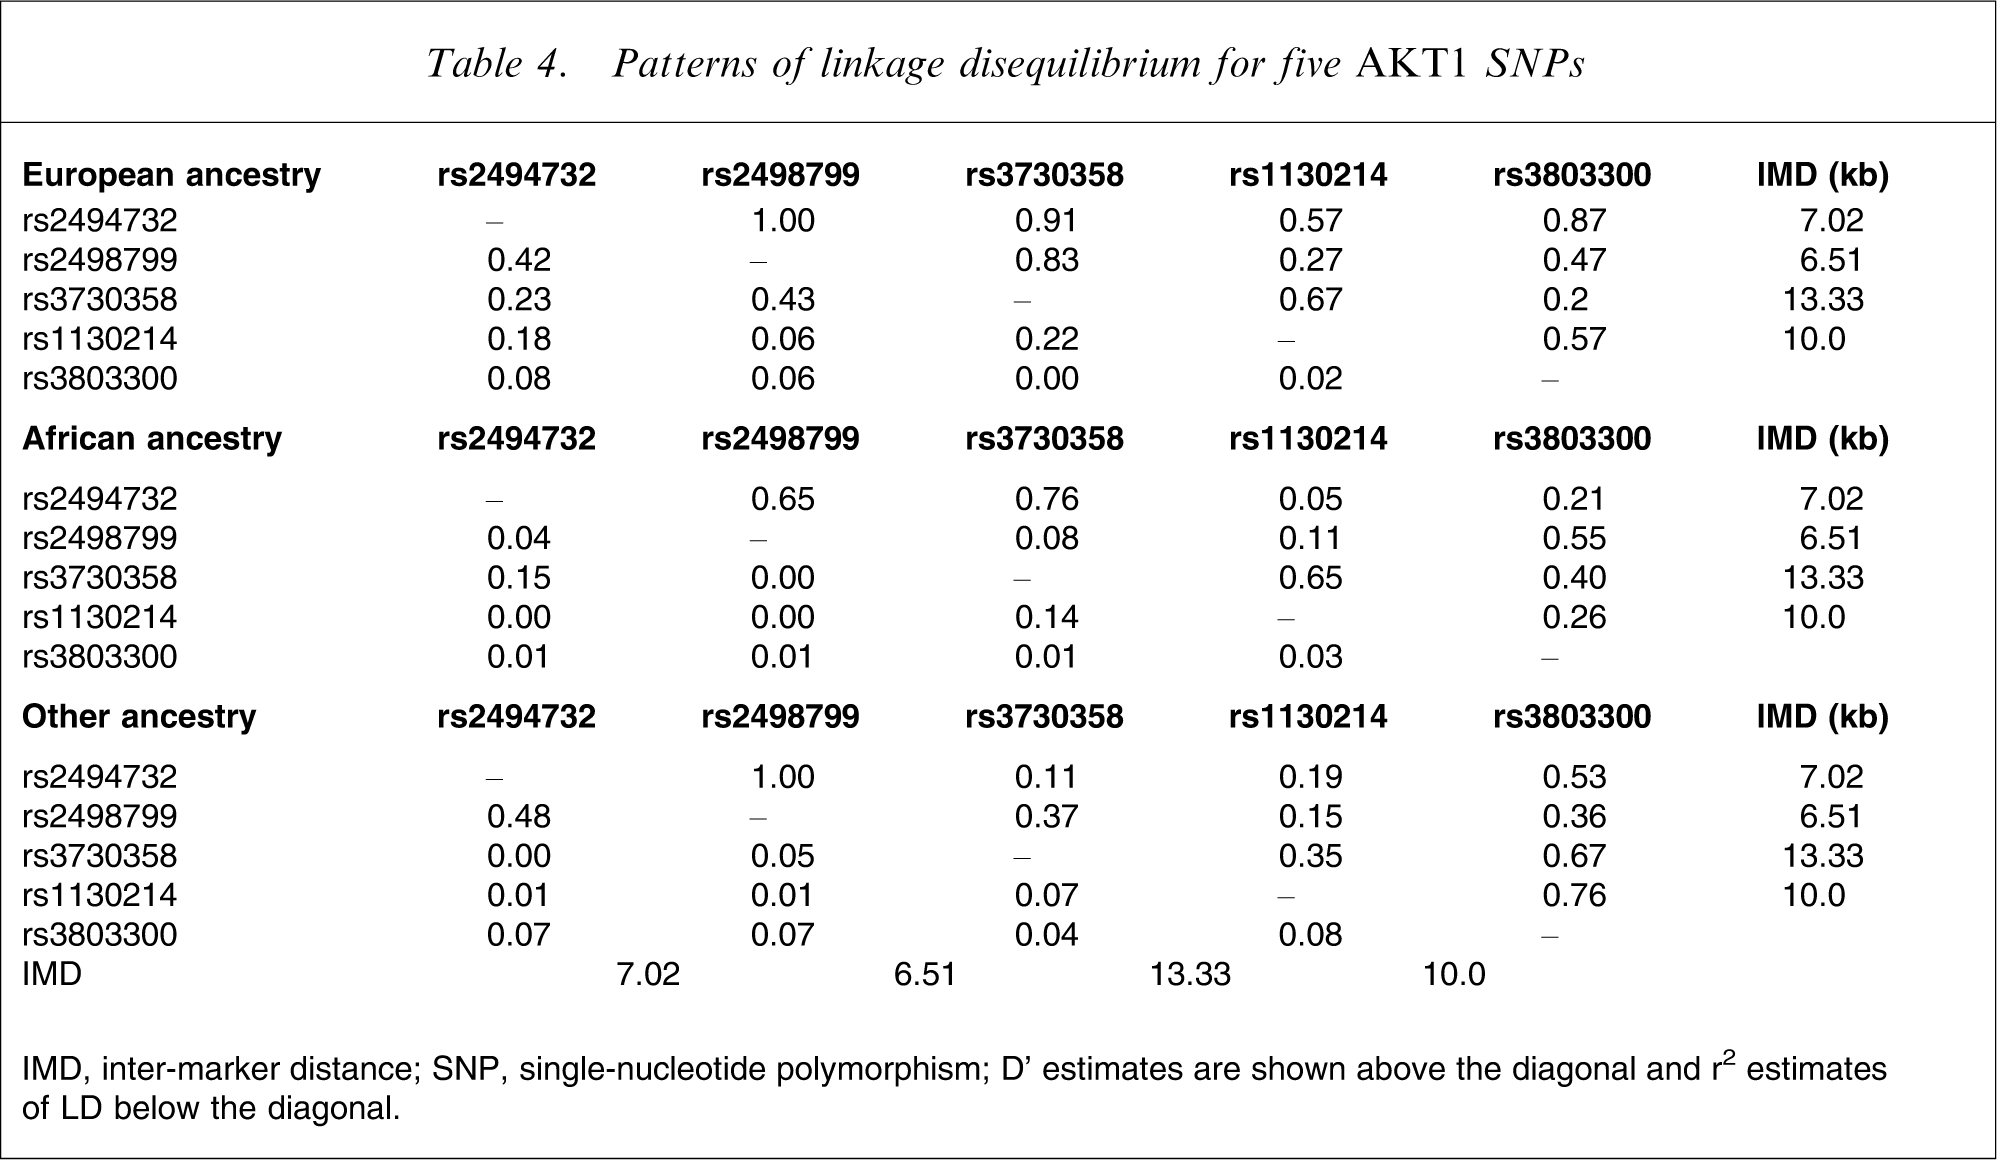
IMD, inter-marker distance; SNP, single-nucleotide polymorphism
D’ estimates are shown above the diagonal and r2 estimates of LD below the diagonal.
Discussion
The present study represents the first attempt to examine the relationship of genetic variation in AKT1 with neurocognition in a large sample of individuals with schizophrenia. Other studies have looked at the association of AKT1 with schizophrenia [3–7]. The involvement of AKT1 with neurocognition was suggested by the findings of Emamian et al. [3] (differences in prepulse inhibition in mice deficient for AKT1) along with data suggesting a role for AKT1 in working memory [21].
We obtained no evidence for associations between SNPs or haplotypes of the five SNPs reported by Emamian et al. [3] with a neurocognitive composite score in individuals with schizophrenia who participated in the CATIE trial [15]. Exploratory analyses of five neurocognitive domain scores (processing speed, reasoning, verbal memory, working memory, and vigilance) were all non-significant. Although this is one of the largest samples in which neurocognition has been investigated in schizophrenia, we cannot exclude insufficient power as an explanation for these negative results. Moreover, our results do not exclude genetic variation in AKT1 completely but rather only for the five SNPs that were genotyped along with variations in regions in high LD with these the SNPs that were genotyped. Therefore, we cannot exclude the possibility that different markers, alleles, or haplotypes than the ones we genotyped might be implicated, and more dense genotyping is warranted.
Additional alternatives should be considered. First, it is plausible that use of an endophenotype such as neurocognition represents an improved measure of the underlying disease liability. Some have argued that neurocognitive dysfunction is a defining feature of schizophrenia [36] and cognitive impairment may be the best predictor of poor outcome [9]. The genetic vulnerability for impaired neurocognition in schizophrenia may be related to other genes or other AKT1 alleles and haplotypes. Second, the relationship between genetic variation in AKT1 and neurocognition might be relevant only in normal individuals who are not affected with schizophrenia. In other words, the disease process might lead to ‘floor’ effects whereby the neurocognitive impairment in schizophrenia is so severe that any variation due to AKT1 is greatly attenuated. However, the CATIE neurocognitive composite score and each of the neurocognitive domain scores were normally distributed, which largely miligates against floor effects. Third, there may not be sufficiently variability in neurocognitive scores in case-only samples. Finally, our results may represent a true negative finding, meaning that AKT1 has no relevant role in the neurocognition of individuals with schizophrenia. Consistent with this interpretation, association studies of AKT1 in schizophrenia susceptibility are inconsistent. In the future, it might be better to do genetic analyses on individual test measures, as genes may be more likely to be expressed in more specific neurocognitive mechanisms than in domain scores.
Footnotes
Acknowledgements
The CATIE project was supported by NIMH contract NO1 MH90001 and the present study by NIMH R01 MH074027 (PFS). Dr Pinheiro was supported by the Conselho Nacional de Desenvolvimento Cientifico e Tecnologico (201093–2004/9) CNPQ, Brazil.