
Abstract
Schizophrenia patients have a wide range of cognitive deficits, which can be assessed using standardized neuropsychological tests [1–5]. The major classes of neurocognitive function, such as working memory and executive function, have been hypothesized to be core pathophysiological features of schizophrenia [6–10]. These impairments probably represent several underlying neurobiological deficits, which might respond differently to antipsychotic treatment [11]. Specific neurocognitive deficits can also be used as endophenotypes or intermediate phenotypes for molecular genetics studies of schizophrenia. Some studies have examined candidate genes for schizophrenia by using specific neurocognitive functions as endophenotypes, with some success [3,5,12,13]. In contrast, some studies have suggested that a general neurocognitive impairment, as opposed to specific neurocognitive deficits, is the core feature of schizophrenia [1,4,14,15]. Because of this divergence it is important to define the major separable cognitive domains in any set of clinical neurocognitive tests. Until now, however, there has been no consensus on the best structural model to use.
In general, because there are no solid theoretical grounds to support the impairment of specific neurocognitive domains in schizophrenia, researchers tend to use large sets of neuropsychological tests in order to examine multiple neurocognitive processes. Most of these neuropsychological tests yield several measures of interest that could result in type I errors because of multiple statistical comparisons. Consequently, investigators have usually selected a subset of variables, in line with previous studies. An alternative approach would be to group variables into factor-derived dimensions based on their latent neurocognitive architecture, in order to index their psychometric properties [16]. As an empirical technique, exploratory factor analysis (EFA) uses a mathematical algorithm to merge multiple indices into single factors, which can reduce data complexity and uncover latent structure within a set of variables. Confirmatory factor analysis (CFA) is a statistical strategy that can confirm factor structures, either based on previous findings, or on hypotheses and theories of neurocognition, and it also allows assessment of the fitness of a theoretical model. Thus, CFA is more flexible than EFA [17]. Moreover, CFA with maximum likelihood can usually be used to compare different population groups against an ideal model to determine if the factor structural profiles of probands with schizophrenia, parents, unaffected siblings and normal controls are the same or similar. Nuechterlein et al. reviewed the results of 13 factor analysis studies of schizophrenia and identified a model with seven separate factors: speed of processing, attention/vigilance, working memory, verbal learning and memory, visual learning and memory, reasoning and problem-solving, and verbal comprehension [11]. The majority of the studies reviewed did not use CFA for various reasons, such as small sample size. By using block principal component analysis, Jaeger et al. demonstrated a six-factor model that was stable longitudinally [16]. Their six-factor model included factors of attention, working memory, ideational fluency, learning, verbal knowledge and non-verbal functions, but did not derive distinct factors for executive functioning, verbal memory and motor functions, which were conventional neuropsychological domains in the previous literature.
There are limited CFA studies in schizophrenia, with earlier ones mainly focusing on analysing factorial components derived from Wechsler Adult Intelligence Scale-II-Revised (WAIS-II-R), or WAIS-III assessments [14,18]. Gladsjo et al. performed CFA in a group of patients and controls with a broader battery of neuropsychological tests [17]. They found that participants with schizophrenia and healthy controls shared the same/similar neurocognitive architecture but had different levels of performance. Genderson et al. performed the first ever CFA in a sample of patients, their siblings and healthy controls [19]. They identified a seven-factor model, including factors of verbal memory, working memory, visual memory, IQ/speed/fluency, executive function, attention and digit span. Their study also confirmed that patients, their relatives and controls have comparable fundamental neurocognitive structure, and that the difference among groups (patients, their siblings and controls) was mainly in the level of neuropsychological performance rather than the underlying cognitive architecture.
In the present study we performed EFA on a series of neuropsychological test data in a sample of Han Chinese first-episode schizophrenia patients, their relatives and normal controls. The factors derived from the composite sample were tested with CFA in each of the subsamples, and the factor scores were compared. Finally, in order to assess whether the factors of neurocognition represent potentially useful endophenotypes of schizophrenia, we estimated their heritability (the proportion of phenotypic variation in a population that is attributable to genetic variation among individuals).
Methods
Participants
A total of 1267 individuals participated in the study. The participants were 214 first-episode, drug-naïve schizophrenia patients, 296 of their parents, 230 of their unaffected siblings and offspring, and 527 healthy controls. As shown in Table 1, there were 149 fathers and 147 mothers out of 296 parents examined. Of 230 unaffected siblings and offspring, there were 72 offspring and 158 siblings. Participants with schizophrenia were prospectively recruited from inpatient and outpatient psychiatric units from Sichuan province and Chongqing municipality in South-western China. The ascertainment and screening procedures were followed as described previously [4,5]. All patients and relatives were interviewed by one of three psychiatrists (QW, WD and JY) using the Structured Clinical Interview for DSM Disorders-Patients (SCID-P) or Structured Clinical Interview for DSM Disorders-nonpatients (SCID-NP) [20]. First-episode patients were individuals who presented directly to psychiatric services for the first time because of psychotic symptoms. Diagnosis of schizophrenia according to DSM-IV criteria [21] was assigned on the basis of the interview and medical records. Clinical symptoms were rated using the Positive and Negative Symptom Scale [22] with subscales for positive (PANSS-P), negative (PANSS-N) and general psychopathological symptoms (PANSS-G). Age of illness onset was recorded as the first onset of any psychotic symptom, as related by the patients themselves and/or informants. All patients were drug naïve at the time of clinical and neuropsychological assessment. First-degree relatives were invited into the study if they had no known history of mental illness as reported by themselves or informant relatives. Four of the first-degree relatives (two mothers with anxiety disorder and two siblings with schizophrenia) were excluded from the study because they were diagnosed with psychiatric disorders on DSM-IV. A total of 527 healthy controls were recruited from the general community in Chengdu city, Sichuan province, China. All participants were interviewed using the SCID-NP by a qualified psychiatrist (JS). Participants from any of the groups (patients, relatives and controls) were excluded if they had a history of other mental illness, neurological disorders, head injury or substance use. All the participants were Han Chinese and provided informed consent. This study was approved by the Institutional Broad (IRB) of West China Hospital, Sichuan University.
Subject characteristics
PANSS, Positive and Negative Syndrome Scale. †F test: age: F=308.037, p<0.001. Post hoc: parents vs normal, p<0.001; probands vs normal, p<0.001; siblings/offspring vs normal, p<0.001; probands vs parents, p<0.001; siblings/offspring vs parents, p<0.001; siblings/offspring vs probands, p<0.21. ‡F test: education: F=29.344, p<0.001. Post hoc: parents vs normal, p<0.001; probands vs normal, p<0.001; siblings/offspring vs normal, p<0.001; probands vs parents, p<0.001; siblings/offspring vs parents, p<0.001; siblings/offspring vs probands, p<1.000. §χ2 = 4.310; p = 0.23. ¶χ2 = 7.759; p = 0.256.
Neuropsychological assessment
In keeping with our previous reports [4,5], a set of neuropsychological tests (Table 2) was selected in order to examine a comprehensive set of neurocognitive functions in schizophrenia, including Attention and Processing Speed, Learning and Memory, Verbal Function, Visuostructural Abilities and Executive Function. These tests were administered to all participants during one or two sessions, usually in the same day. All neuropsychological tests and measures used in the present study are discussed in detail elsewhere [4]. Briefly, we used Arithmetic, Digit symbol, Digit span, Stroop test and Trail-Making for Mental Activity (Attention and Processing Speed); Immediate and Delayed logical memory, Immediate and Delayed Visual Reproduction, Digit symbol and Information for Memory and Learning; Verbal fluency test, Information and Arithmetic for Verbal Function and Academic Skills; Block design for Visuoconstructive Abilities; and Wisconsin Card-Sorting Test–Modified (WCST-M) Tower of Hanoi for Executive function [4]. Of course, a given test may assess neuropsychological functions from more than one cognitive domain. In contrast to the previous studies, we did not include Trail-Making Test Part A because, in our initial analysis of 527 healthy controls, we found significant ceiling effects in performance of this task [4]. We also made another change by using measures of ‘time of completing items’ in Stroop Colour Test, both measures of ‘time of completing items’ and ‘corrected and error numbers’ in Stroop Colour–Word Interference Test instead of ‘items completed within 120 s’ as suggested in the study by Chen et al. [23].
Battery of neuropsychological tests used
SSS-RC, Wechsler Memory Scale–Revised in China; WAIS-RC, Wechsler Adult Intelligence Scale–Chinese Revised; WCST-M, Wisconsin Card Sorting Test–Modified.
Studies of the neuropsychological performance of the probands, their first-degree relatives and normal controls have been reported elsewhere [4,5]. Handedness was assessed on the Annett handedness scale [30]. Measures of neurocognition can be affected by age, sex and education attainment, and therefore each measure was used as a dependent variable with sex, age and years of education as independent variables in linear regression analysis. Standardized residual scores for all variables took the place of raw scores in successive analyses. Use of standardized residual scores provided demographic corrections for the neuropsychological test scores and facilitated the comparison of diagnostic groups that differed in terms of age, sex, and years of education. Standard residual scores are normally distributed with a mean of 0 and standard deviation of 1.
Statistical analysis
First, the neurocognitive data were subjected to an exploratory analysis (principal analysis followed by a varimax rotation). Analyses were conducted using SPSS version 12 (SPSS, IBMCorp. Chicago, Illinois, USA). The factor structures of the composite sample, probands, parents, unaffected siblings and off-spring, and normal controls, were examined using EFA. Each factor was labelled based on variables with loading score >0.5 and on what we believed best characterized the test loading on a particular factor, in line with previous studies [11]. The six common factor scores of composite samples were saved as new variables for successive analyses.
Second, a CFA with maximum likelihood was used to determine if the ideal model derived from EFA for the composite sample fitted the observed data from the probands, parents, unaffected siblings and offspring, and normal controls, respectively. Analyses were conducted using LISREL 8.7 for Windows [31], which is a Windows application for structural equation modelling. The standard that determined if the proposed model fitted the observed data for different groups relied on the evidence from three fit indices: root mean square error of approximation (RMSEA) <0.08 [32], non-normed fit index (NNFI) >0.9, and comparative fit index (CFI) >0.9 [27,33]. RMSEA is a summary of the standardized covariance residuals, weighted by model complexity. Values below 0.05 indicate a close fit relative to the degrees of freedom, while values below 0.08 indicate a reasonable error of approximation [14]. Like the RMSEA, the NNFI includes a penalty function for more complex models. Moreover, NNFI is relatively independent of sample size. Values below 0.9 indicate models with room for substantially improved fit [14,27]. Although the CFI does not include a penalty function for complexity, it is independent of sample size [34].
Third, the common factor scores of six neurocognitive domains were compared between probands, parents, siblings/offspring, and normal controls. We hypothesized that there would be different levels of neurocognitive ability between the four groups, so the data type has the features of a mixed linear model. Thus, the statistical analysis of the mixed linear model was used to determine whether the common factor scores describe the familiarity of the data. Age, gender and years of education were used as covariates. Analyses were performed using STATA version 8 (StataCrop., Texas, USA). Caution in interpreting p is required because of the number of statistical tests that were performed in the present study, which could result in type I error. Consequently, we adopted a conservative (sixfold) Bonferroni adjustment to p because six variables were analysed in the present study. Thus, to achieve statistical significance, p needed to be below 0.0083.
Finally, to estimate the heritability of each factor, we used a variance component model, in line with previous studies of neurocognitive endophenotypes of schizophrenia [35]. A standard quantitative genetic analysis was performed with the software SOLAR, version 4.1.5 [36]. The polygenic and null models were compared with likelihood ratio tests using the ‘maximize’ command of SOLAR, which provides estimates for the additive genetic component of the total variance.
Results
Demographic characteristics
Mean scores of age, years of education, the male: female ratio and handedness for all participants are listed in Table 1. There were significant differences in age and years of education among the four groups (age: parents>normal controls>siblings/offspring=probands’). There were no significant differences in sex distribution and handed-ness. Table 1 also lists the symptomatological characteristics and the duration of untreated psychosis.
Neurocognitive measures
The mean scores of neurocognitive measures are shown in Table 3.
Neurocognitive measures (mean±SD)
ArithC, arithmetic; DesignC, block design; DigitLC, digit symbol; DigitSBO, digit span back; DigitSFO, digit span forward; HanoiET, executed time of Tower of Hanoi; HanoiPT, planning time of Tower of Hanoi; InformC, information; LogicalIm, immediate logical memory; LogicDe, delayed logical memory; StrCT, Stroop Colour Test; StrCWEN, error numbers for Stroop colour–word test; StrCWRN, correct numbers of Stroop colour–word test; StrCWT, time of completed Stroop colour–word test; TmtbTi, time of completed Trial B; VerbalRN, verbal fluency test; VisualImD, immediate visual memory; VisuDeD, delayed visual memory; WcstC, correct categories for WCST-M; WCST-M, Wisconsin Card-Sorting Test–Modified; WcstPe, perseverative errors for WCST-M; WcstRT, correct numbers for WCST-M.
Exploratory factor analysis
EFA from the composite participants’ data yielded a six-factor model (Table 4). These factors were named general mental activity; sort and shift; attention and anti-interference; logical memory; reasoning and problem-solving/executive function; and visual reproduction. The total variance explained by the six-factor model was 63%. EFA still yielded a six-factor solution using each subsample (schizophrenia patients, parents, unaffected siblings and offspring, and normal controls) successively (Table 5). Seven factors, however, were yielded in parents, with the additional factor named Digit Span. Two factors (sort and shift; and visual reproduction) consisted of the same items in all samples. The other factors (general mental activity; attention and anti-interference; logical memory; reasoning and problem-solving/executive function) consisted of similar items, but were not identical. The total variance accounted for by the six/seven factors was 66% for probands, 66% for parents, 62% for siblings and offspring and 63% for normal controls, respectively. In addition, we found identical items between the composite and normal controls data for each factor. Summaries of the factor loadings, the variance explained for each group, and eigenvalues are given in Table 6.
Exploratory factor analysis for the composite data
AAT, attention and anti-interference; GMA, general mental activity; LM, logical memory; RPS, reasoning and problem-solving; SS, sort and shift; VR, visual reproduction. ArithC, arithmetic; DesignC, block design; DigitLC, digit symbol; DigitSBO, digit span back; DigitSFO, digit span forward; HanoiET, executed time of Tower of Hanoi; HanoiPT, planning time of Tower of Hanoi; InformC, information; LogicalIm, immediate logical memory; LogicDe, delayed logical memory; StrCT, Stroop Colour Test; StrCWEN, error numbers for Stroop colour–word test; StrCWRN, correct numbers of Stroop colour–word test; StrCWT, time of completed Stroop colour–word test; TmtbTi, time of completed Trial B; VerbalRN, verbal fluency test; VisualImD, immediate visual memory; VisuDeD, delayed visual memory; WcstC, correct categories for WCST-M; WCST-M, Wisconsin Card-Sorting Test-Modified; WcstPe, perseverative errors for WCST-M; WcstRT, correct numbers for WCST-M. Bold, items of one factor in per column. 0.815.
Exploratory factor analysis for all groups
ArithC, arithmetic; DesignC, block design; DigitLC, digit symbol; DigitSBO, digit span back; DigitSFO, digit span forward; HanoiET, executed time of Tower of Hanoi; HanoiPT, planning time of Tower of Hanoi; InformC, information; LogicalIm, immediate logical memory; LogicDe, delayed logical memory; StrCT, Stroop Colour Test; StrCWEN, error numbers for Stroop colour–word test; StrCWRN, correct numbers of Stroop colour–word test; StrCWT, time of completed Stroop colour–word test; TmtbTi, time of completed Trial B; VerbalRN, verbal fluency test; VisualImD, immediate visual memory; VisuDeD, delayed visual memory; WcstC, correct categories for WCST-M; WCST-M, Wisconsin Card-Sorting Test–Modified; WcstPe, perseverative errors for WCST-M; WcstRT, correct numbers for WCST-M.
Exploratory factor analysis for eigenvalues
AAT, attention and anti-interference; DS, digit span; GMA, general mental activity; LM, logical memory; RPS, reasoning and problem-solving; SS, sort and shift; V F, verbal fluency; VR, visual reproduction.
Confirmatory factor analysis
We used the composite sample/normal controls as the standard in CFA, and then tested whether the factor structure of probands, parents, and siblings/offspring was similar to the composite sample, see Table 7. The variables used in CFA were the same as in EFA and all latent variables (factors) were permitted to covary with each other.
Confirmatory factor analysis based on the composite data
CFI, comparative fit index; NNFI, non-normed fit index; RMSEA, root mean square error of approximation.
As noted previously, RMSEA, CFI and NNFI were used to assess if the six-factor solution fitted the data in each of the four subsamples. These indices confirmed the six-factor model (RMSEA<0.08, CFI and NNFI >0.9; Table 6). The RMSEA for normal controls, probands, parents and siblings/offspring was ≥0.08; the CFI and NNFI for all four subgroups were ≥0.09, except for NNFI in siblings/offspring (0.88).
The ideal factor structure speeified the same structural relationship among latent and observed variables for the schizophrenia patients, parents, unaffected siblings and normal controls. The pattern of loadings was free to vary. The pattern of factor loading, however, was fairly consistent across all groups, albeit the factor structure of siblings/offspring did not perfectly fit the ideal model.
Common factor score comparison and heritability
All comparisons are reported in Table 8. We found that, compared to controls, in each of the six neurocognitive domains, probands performed poorly. The siblings/offspring also performed more poorly than controls, with the exception of general mental activity and attention. Parents performed worse than controls only in logical memory and marginally worse in working memory. Probands performed poorly in attention and reasoning/problem-solving when compared to parents, and in all domains except visual reproduction when compared to siblings. There were no major differences in the six neurocognitive domains between siblings and parents. The age-, gender- and education-adjusted standardized z-scores for probands, parents and siblings in relation to controls are shown in Figure 1. Of the six neurocognitive factors, only logical memory was found to be significantly heritable (h2=0.337). Also, reasoning and problem-solving had a marginal heritability of around 0.188.
Comparison of neurocognitive factors
AAT, attention and anti-interference; GMA, general mental activity; LM, logical memory; RPS, reasoning and problem-solving; SS, sort and shift; VR, visual reproduction. ∗Significant differences with Bonferroni correction, p<0.05.
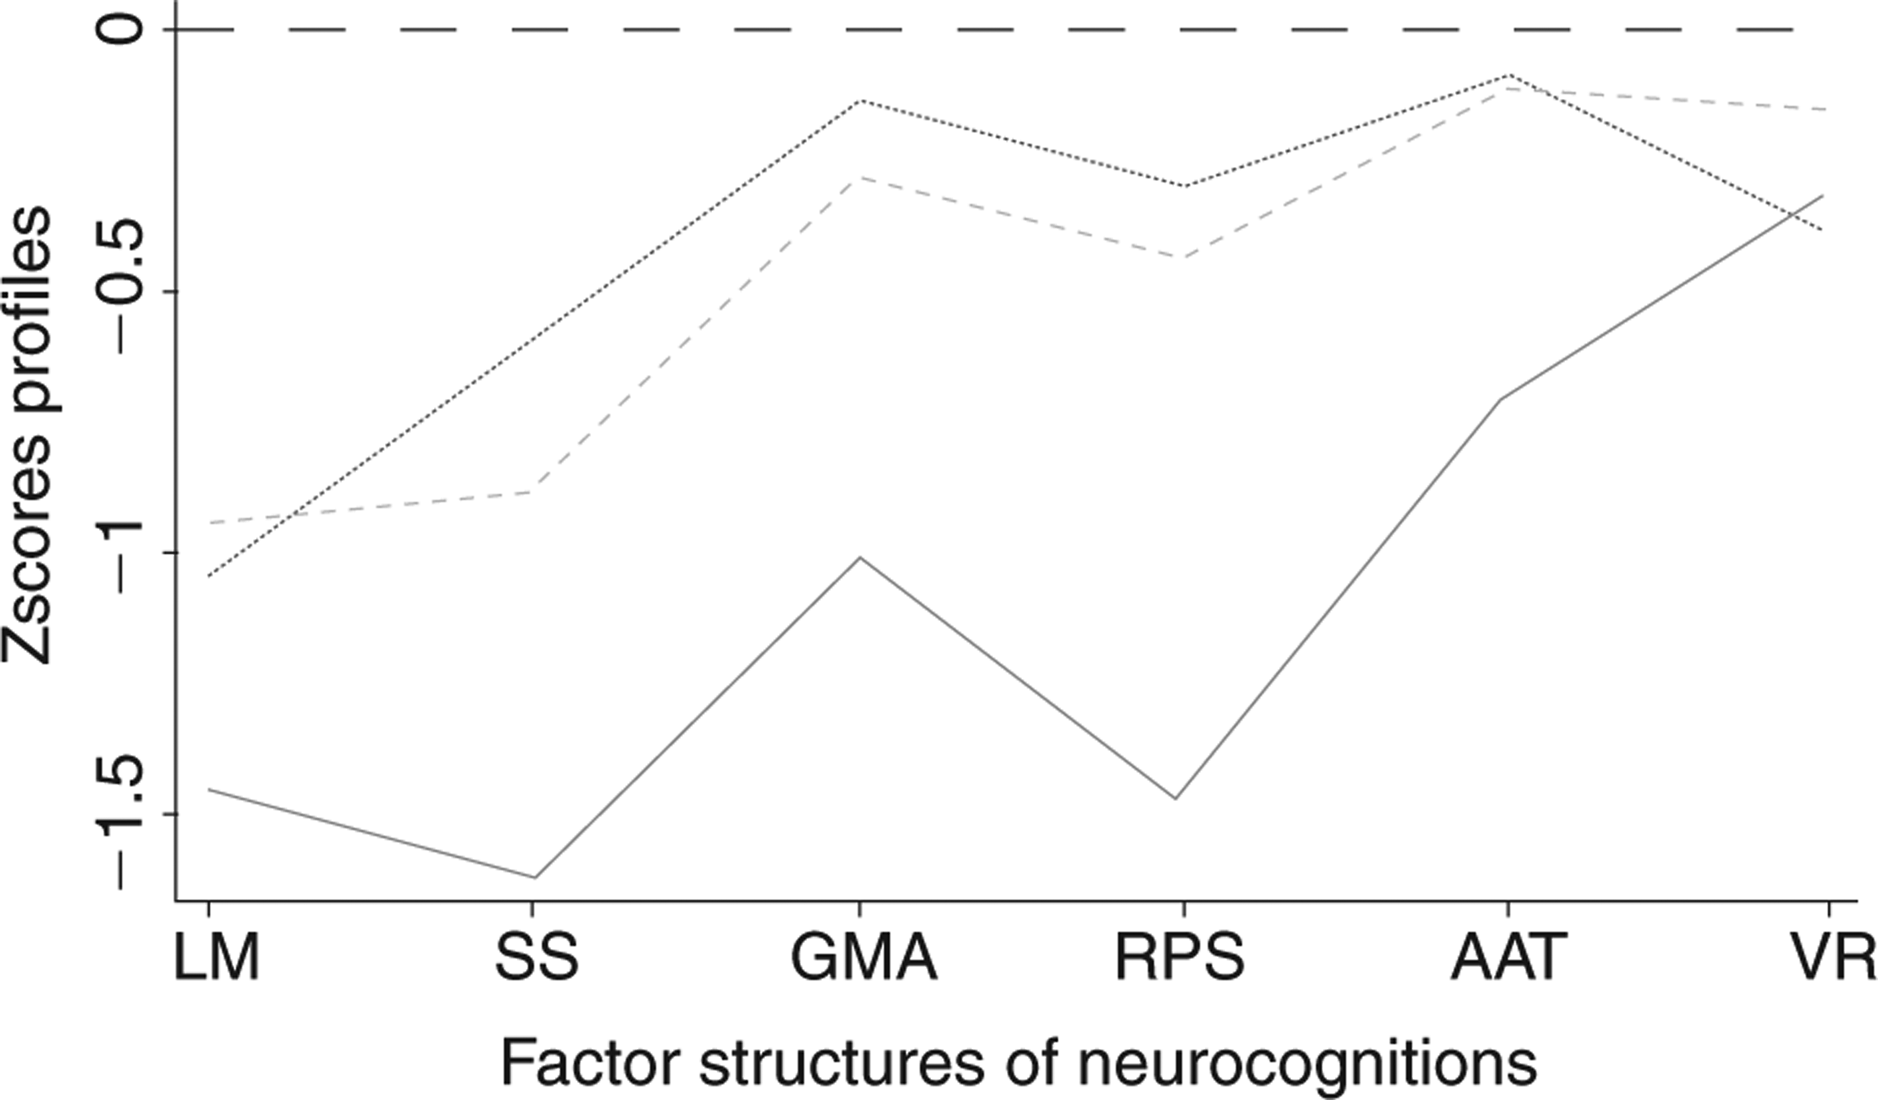
Factor structures profile of neurocognition (– –) Controls; (—) parents; (••••) siblings/offspring; (––) schizophrenia patients. AAT, attention and anti-interference; GMA, general mental activity; LM, logical memory; RPS, reasoning and problem-solving; SS, sort and shift; VR, visual reproduction.
Discussion
In the present study EFA was used to identify the factor structure of a comprehensive set of neuropsychological tests in schizophrenia patients, their parents, their unaffected siblings and offspring, and normal controls, both separately and as a composite group. We derived a six-factor model in all groups except parents. These latent factors represented six different neurocognitive domains, which can be defined as (i) general mental activity; (ii) the ability to sort and shift; (iii) attention and anti-interference; (iv) logical memory; (v) reasoning and problem-solving; and (vi) visual reproduction. Our findings are essentially consistent with those of the Nuechterlein et al. review of 13 factor analytic studies [11].
CFA with maximum likelihood was then used to confirm the factor structure identified on EFA and to compare factor models for different groups with the ideal model of the composite sample. We found that the factor structure of normal controls fitted perfectly, while probands and their first-degree relatives fitted well with the ideal model. In CFA, previous studies have used the ratio χ2/df as an index to assess the consistency of different groups’ factor structure. χ2/df<2 means that the model fits well, but it is important to note that the larger the sample size, the bigger the χ2. In the present study it was not be appropriate to use χ2/df as the index to assess the fit of the model due to the large sample size (total n=1267).
The present study demonstrates that the six-factor model can represent the common latent structure of neuropsychological performance in probands, parents, unaffected siblings/offspring and normal controls. Although it was not identical, the model fitted the data very well in each of these four groups. In brief, on CFA the present findings support a similar structure model of neurocognitive functions among schizophrenia patients, parents, siblings/offspring and normal controls.
In a previous study consisting of some of the participants included in the present study, we found that discrete neurocognitive deficits were present in the families of probands [4,5]. The probands were more severely impaired than their siblings/offspring, and the parents were the least impaired. When the six common factors were compared between the four groups of the present study, we reached similar conclusions: a hierarchy in cognitive performance deficits depending on the relatedness to probands. Patients performed more poorly than siblings/offspring in general mental activity, sort and shift, attention and anti-interference, logical memory, planning and problem-solving, but not in visual reproduction. Overall we found that, in most factor scores, relatives of probands with schizophrenia performed better than the probands themselves, but worse than controls.
It has been suggested that use of quantitative trait rather than categorical phenotype has substantial advantages with greater statistical power, therefore smaller sample sizes are needed for genetic mapping. In the current study, in accordance with previous reports [14,17,19], we observed that probands, siblings, parents and normal controls had similar profiles, but differed in the severity of their neurocognitive deficits. The present results supported the notion that quantitative, rather than qualitative, changes between schizophrenia patients and their biological relatives may explain cognitive dysfunctions in schizophrenia. These quantitative patterns of neurocog-nitive deficits may represent endophenotypes, denoting varying degrees of vulnerability to schizophrenia depending on the level of genetic vulnerability, which is indexed by the degree of kinship of an individual to an affected relative [4,5].
Endophenotypes, which are thought to be intermediate in the pathway of causality from genes to disease, are presumed to be closer to the susceptibility gene actions than diagnostic phenotypes and thus are useful for the detection of genetic association or linkage of the disease [31,37,38], although this view is controversial, with some arguing that these traits are no less complex genetically than the diseases themselves [39]. Gottesman and Gould summarized a number of criteria for identifying useful endophenotypes in psychiatry, that is, the endophenotype should be (i) associated with illness in the population; (ii) heritable; (iii) state independent; (iv) found in affected family members and co-segregates with the illness; and (v) more prevalent in non-affected family members than in the general population [13]. With regard to the first, fourth and fifth criteria, we, along with previous studies, confirmed that cognitive dysfunctions are indeed pervasive in schizophrenia over a wide array of ability domains [4,5]. Despite this, however, further research is needed to clarify the nature of these impairments (e.g. selective versus generalized impairment, within-group heterogeneity, associations with symptoms etc.). With regard to the third criterion, that is, the state-independency of the endophenotype, studies are less consistent. Generally, findings indicate that cognitive deficits are independent of the clinical symptoms of psychosis [40–45]. In addition, there is evidence from birth cohort and high-risk studies that some neuropsychological deficits are present in childhood long before the onset of frank psychosis [38,45,46]. Our own study found no significant association between neurocognitive deficits and clinical symptoms (PANSS scores) [4,5]. Most studies, however, including our own, were cross-sectional and assessed patients when they were acutely unwell. A longitudinal follow-up design with repeat assessments to determine stability of neurocognitive deficits is warranted. In addition, studies designed to test the specific factor structure in a group with other psychiatric disorders (e.g. bipolar disorder) are needed.
A validated endophenotype should be heritable according to the second criterion given in the previous section [13]. Heritability is an important index that represents the proportion of phenotypic variation in a population that is attributable to genetic variation among individuals. Thus, potential endophenotypes should have significantly higher heritability in order to be a validated endophenotype. In the present study logical memory was the most significant heritable factor. This result is consistent with previous studies [47], which suggested that logical memory is possibly a useful endophenotype for future genetic studies.
Some differences in the factor structure between this study and previous reports were noted. Specifically, some investigators have found that verbal comprehension is a single factor, but in the present study the measure of verbal comprehension used (number of correct animal words in 60 s) is in most cases included in general mental activity. In any case, although verbal comprehension has been identified in previous studies, it was not recommended for inclusion in a cognitive set for clinical trials in schizophrenia due to the extreme resistance to change that characterizes over-learned verbal skills [11].
As noted in previous studies, the WCST-M is commonly used to examine reasoning and problem-solving [48–50] but also attention/vigilance [11]. Additionally, the Tower of Hanoi or Tower of London is typically used to examine reasoning and problem-solving, but the present study suggested that there may be different domains of executive functions measured by the WCST-M and the Tower of Hanoi. In the present study we presumed that the WCST-M mainly examined sort and shift, and the Tower of Hanoi mainly evaluated the supervisory attention system, which results in the inability to formulate a goal, to plan, and to choose between alternative sequences of behaviour to reach a particular goal. Some previous studies have also found that executive functions could be divided into separable components [51,52]. Some investigators have recommended that the continuous performance test (CPT) be used as the standard test for attention/vigilance [11,53]. It is a limitation of the present study that the battery of neuropsychological tests did not include the CPT, due to the small number of participants who completed the test.
In the present study the factor of general neurocognitive activity accounted for 25–32% of the test variance in normal controls, siblings/offspring, parents, and probands, and its eigenvalue was far bigger than that of all other factors. Moreover, the eigenvalues and variances explained by all the other factors were small, with no obvious difference. This pattern supported the notion that a generalized cognitive deficit in schizophrenia accounts for the majority of the overall variance [14,53]. A different opinion, that the deficits seen in schizophrenia span a number of cognitive domains, has been suggested by some investigators [9,19,49,54]. Dickinson et al. found support for a model that accommodates both separable cognitive factors and general cognitive ability [14], which is consistent with the present results.
A number of studies have found that measures of neurocognitive functions are influenced by the effects of neuroleptic and anticholinergic medication [1,55,56]. In addition, institutionalization and chronicity of illness served as confounders and affected the tests of neuro cognitive functions in probands. One of the strengths of the present study was the investigation of a large sample of first-episode, drug-naïve schizophrenia patients, which avoids the confounding effects of medication and chronicity of illness and identifies neurocognitive deficits early in the course of schizophrenia [1,56–58]. The selection process, however, of first-episode drug-naive schizophrenia patients may confound the research results due to the state-dependent effects derived from unstable clinical performance.
In conclusion, the present study supports a similar factor structure of neurocognition between Han Chinese probands with schizophrenia, their parents and siblings/ offspring and normal controls. The detection of neurocognitive dysfunctions among relatives of patients indicates that they can serve as endophenotypes of schizophrenia. Logical memory in particular, which has been found to be the most heritable, is possibly a useful target for future genetic studies.
Footnotes
Acknowledgements
We acknowledge Xiehe Liu, Yingcheng Wang, Jinhua Sun, Jing Yao for their assistance in data collection. This work was partly funded by National Nature Science Foundation of China (30530300 and 30125014, TL), the National Basic Research Program of China (973 Program 2007CB512301, TL), NARSAD Independent Investigator Award (TL), NARSAD Young Investigator Award (EV), the Wellcome Trust (International Collaborative award to TL, DAC and XL), and the State Scholarship Foundation of Greece (EV).