
Abstract
Study Design
A prospective cohort study.
Objective
Decompression and fusion of cervical vertebrae is a combined procedure that has a high success rate in relieving radicular symptoms and stabilizing or improving cervical myelopathy. However, fusion may lead to increased motion of the adjacent vertebrae and cervical deformity. Both have been postulated to lead to adjacent segment pathology (ASP). Kinematic magnetic resonance imaging (MRI) has been increasingly used to evaluate range of motion (ROM) of the cervical spine and ASP. Our objective was to measure ASP, cervical curvature, and ROM of individual segments of the cervical spine using kinematic MRI before and 24 months after monosegmental cage fusion.
Methods
Eighteen patients who had single-level interbody fusion were included. ROM (using kinematic MRI) and degeneration, spinal stenosis, and cervical curvature were measured preoperatively and 24 months postoperatively.
Results
Using kinematic MRI, segmental motion of the cervical segments was measured with a precision of less than 3 degrees. The cervical fusion did not affect the ROM of adjacent levels. However, pre- and postoperative ROM was higher at the levels immediately adjacent to the fusion level compared with those further away. In addition, at 24 months postoperatively, the number of cases with ASP was higher at the levels immediately adjacent to fusion level.
Conclusions
Using kinematic MRI, ROM after spinal fusion can be measured with high precision. Kinematic MRI can be used not only in clinical practice, but also to study intervention and its effect on postoperative biomechanics and ASP of cervical vertebrae.
Introduction
Decompression and fusion of cervical vertebrae is a combined procedure that has a high success rate in relieving radicular symptoms as well as in stabilizing or improving cervical myelopathy. 1 Despite this high success rate, the potential short- and long-term sequelae from the fusion as well as the impact of the fusion on adjacent segment pathology (ASP) are of concern. 2 , 3 It is thought that by eliminating motion through segment fusion, the load is shifted to the adjacent segments, thereby producing hypermobility and possible earlier disk degeneration. 4 , 5 Several human cadaveric and clinical studies have been performed in which changes in cervical spinal load and motion on the levels adjacent to the spinal fusion have been studied. 6 , 7 , 8 , 9 , 10 , 11 However, no clear pattern has been shown, which may be the result of the radiologic tools used to measure ROM. Originally, the kinematics of the cervical spine were investigated using conventional film radiographs. In the last few decades, this imaging has been extended with the use of kinematic magnetic resonance imaging (MRI).12 13 Combining standard and kinematic MRI enables the assessment of the anatomical, pathologic, functional, and position-dependent factors related to the cervical spine.
The purpose of this study is to apply kinematic MRI assessment to measure the motion of individual segments of the cervical spine before and 24 months after monosegmental cage fusion. In addition, the stage of degeneration, grade of spinal stenosis, and change in cervical curvature will be measured.
Materials and Methods
Study Design
From 2006 to 2009, 18 patients who had an anterior single-level anterior decompression and cage (PEEK Cervios chronOS, Synthes, Oberdorf, Switzerland) were prospectively and consecutively included in the study. The mean age of these patients was 50.4 years (standard deviation, 7.7). Per cervical level, the frequency of fusions was C3–C4 = 1, C4–C5 = 4, C5–C6 = 9, and C6–C7 = 4. The exclusion criteria for the study were age below 18 years, previous cervical spine surgery, contraindication for MRI (pacemaker, cerebral clip, claustrophobia, among others), and inability to follow the instructions during the examination because of limited cognitive ability. The study was approved by the Arnhem-Nijmegen Medical Ethical Review Board (no. 2004/251), and all participants provided written informed consent before participating in the study.
Data Collection
The preoperative radiologic evaluation consisted of an anteroposterior and a lateral plain view of the cervical spine, followed by standard and kinematic MRI cervical vertebrae study (see the following details) under the supervision of the investigating radiologist (M.O.). All the examinations were repeated 24 months postoperatively.
Surgical Technique
All patients had a standard left-sided anterior approach to the cervical spine. The omohyoid muscle remained intact. After segmental exposure, the intervertebral disk was removed with rongeurs and the end plates were prepared with a curette. The intervertebral disk height was restored, and exposure was obtained with a Caspar retractor. Anterior decompression was completed with Kerrison rongeurs including taking down the posterior longitudinal ligament to expose the dura. After complete decompression, a trial cage was inserted and the position was verified with a C-arm. The PEEK Cervios cage was prefilled with chronOS and introduced into the intervertebral disk space. After removal of the Caspar retractor, the cage was impacted to obtain a final stable position between the vertebrae; the position was checked with the C-arm. The wound was closed in layers after leaving a high vacuum drain in front of the spine. After surgery, the patients used a cervical soft collar for 6 weeks.
Radiologic Imaging and Assessment
Magnetic Resonance Imaging Equipment and Protocol
All patients were examined on 1.5-Tesla MR Intera (Philips Healthcare, Best, the Netherlands) in a supine, neutral position and also on a kinematic device (CHAMCO Inc., Cocoa, Florida, United States), which allows incremental flexion and extension of the cervical spine. The MRI protocol for neutral imaging consisted of sagittal turbo spin echo (TSE) T1-weighted sequence with repetition time/time echo (TR/TE) 400 ms/14 ms; field of view (FOV) 275 mm2; flip hook 90 degrees; slice thickness 3 mm; number of signal averages (NSA) 4; matrix 304 × 512; sagittal TSE T2-weighted sequence with TR/TE 2,960 ms/120 ms; FOV 275 mm2; flip hook 90 degrees; slice thickness 3 mm; NSA 4; matrix 304 × 512; axial fast field echo sequence with: TR/TE 829 ms/18.41 ms; FOV 305 mm2; flip hook 25 degrees; slice thickness 3 mm; NSA 4; matrix 256 × 512 for preoperative scan and axial TSE T2 for postoperative scan because of metal artifacts. Magnetic resonance protocol during kinematic imaging consisted of a sagittal TSE T2-weighted sequence with parameters: TR/TE 1,575 ms/100 ms; FOV 245 mm2; flip hook 90 degrees; slice thickness 5 mm; NSA 2; matrix 256 × 512 in 40-degree flexion to 30-degree extension.
Measurement Technique
Two experienced observers (M.O. and M.J.) independently performed semiautomated segmental motion measurement using a custom-developed interactive computer program. This measuring method is based on the superimposition method described by Penning. 14 Two experienced radiologists graded in consensus pre- and postoperative images for stage of degenerative disk disease, degree of spinal stenosis, and cervical curvature. Results are reported for the level of fusion and for the levels cranial (+) and caudal (−) to the fusion level.
Outcome Parameters
Segmental Motion
Segmental motion was defined as the amount of rotation in the sagittal plane that occurs between the vertebrae in 40-degree flexed cervical spine and 30-degree extended spine. A reliable method for measuring segmental motion was first described by Penning. 14 Conventional radiographic films were used in this method. The film with the cervical spine in flexion was covered by the film with the cervical spine in extension. After exact superimposition of images of vertebral body and spinous process of C7, a line was drawn along one edge of the overlying film on the underlying film. This process was repeated for C6 and a second line was drawn, and so on. The angle between the first two lines indicated the segmental motion between C7 and C6. According to Penning's method, we measured the segmental motion of each vertebral level preoperatively and 24 months postoperatively on the kinematic MRI images using interactive computer software developed in house. From each flexion and extension MRI scan, the midsagittal image was manually selected. Using the software, all the vertebral bodies were delineated in both extension and flexion midsagittal images. Next, the two images of each vertebra were superimposed. If needed, observers could rotate and translate the two overlying images until the vertebra was exactly superimposed. This process was repeated for each vertebra, after which the segmental motion of each vertebra was automatically determined.
Stage of Degenerative Disease
A “degenerative cascade” classification was used to determine the stage of degenerative disease of the cervical levels in the standard MRI.15 This MRI-based classification consists of three stages: stage I, discogenic changes; stage II, spondylosis with disk changes and osteophytic formation; and stage III, stabilization consisting of the disk changes, osteophytic formation, and hypertrophy of the ligamentum flavum.
Spinal Stenosis
The degree of spinal stenosis was graded according to the classification of Muhle et al. 16 This classification consists of four grades: grade 0, normal; grade 1, partial obliteration; grade 2, complete obliteration; and grade 3, anterior and posterior cord impingement (“pincer effect”). This grading scale was used to assess the cervical stenosis in the extension position in the standard MRI at the preoperative and 24-month postoperative visits.
Cervical Curvature
The cervical curvature was classified according to the principle suggested by Guigui et al and by Batzdorf and Batzdorff, in which type 0 is a normal lordotic curvature, type 1 is a straight cervical curvature, and type 2 is a kyphotic cervical curvature. 17 , 18
Statistical Analysis
To quantify the repeatability of the segmental motion measurements obtained with the kinematic MRI, the 95% prediction limits of agreement were calculated on the 24-month postoperative measurements of ROM for the cervical levels C2–C3 to C6–C7 of all subjects. To test for difference in segmental motion between levels and the effect of the fusion, a two-way factorial analysis of variance (with one factor as repeated measure) was used. To test for difference in outcome parameters (stage of degeneration, spinal stenosis, and cervical curvature) between preoperative and 24-month postoperative measurements, a Fisher exact test was used. To test if the data had a normal distribution, a Shapiro-Wilk test was performed. The level of significance for all statistics was set at p < 0.05.
Results
Repeatability of the Segmental Motion Measurement
Results for the repeatability of the ROM measurements using kinematic MRI are shown in Table 1. The 95% prediction limits of the segmental motion measurements for the observers had a maximum value of 3.4 degrees. However, when results of the two trained observers were combined, these limits were less than 3 degrees. Therefore, for the rest of this study, the values used for the segmental motion were the mean results of the two trained observers.
95% prediction limits (degrees) of segmental motion measurements at different levels of the cervical spine in the sagittal plane
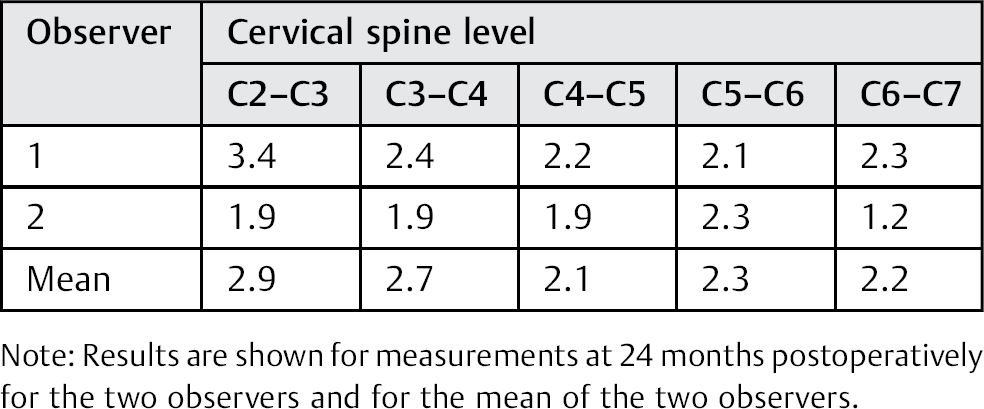
Note: Results are shown for measurements at 24 months postoperatively for the two observers and for the mean of the two observers.
Segmental Motion after Cervical Spinal Fusion
The results for segmental motion, grouped for the four levels cranial (+) to the three levels caudal (−) in relation to the fusion level, are shown in Fig. 1. Twenty-four months postoperatively, the ROM at the fusion level was reduced by 5 to 2 degrees (p < 0.0001). Comparison between the individual levels showed that the two levels cranial and caudal of the fusion level had a significantly higher ROM (range 4 to 7 degrees) compared with fusion level (p < 0.0001), level +1 had a higher ROM compared with the levels more cranial (p < 0.0001), and level −1 had a higher ROM compared with levels +3 and +4 (p < 0.001). This result was not different between preoperative and 24 months postoperative values.
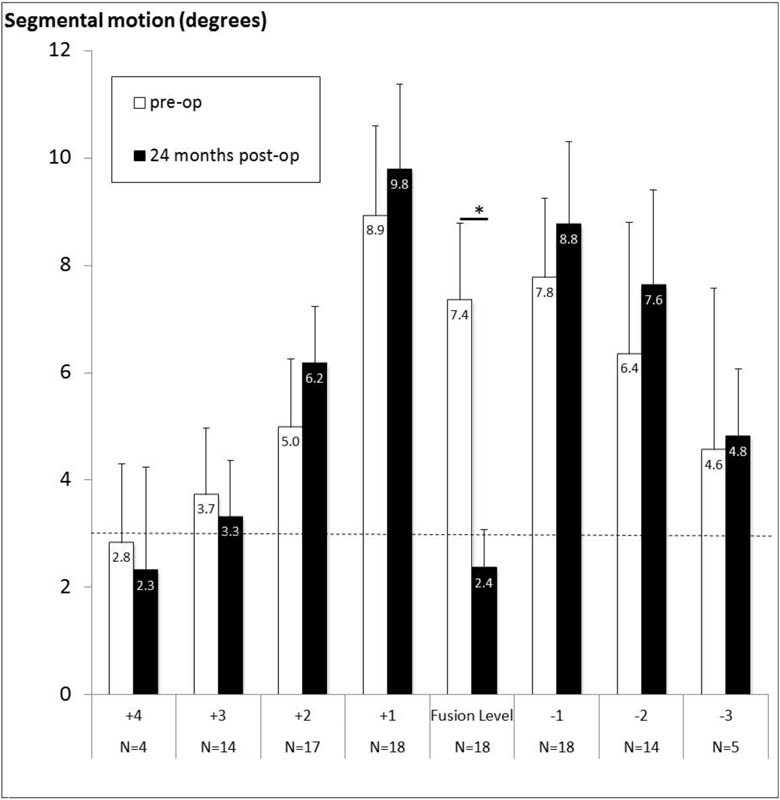
Segmental motion in degrees from four levels above (+) to three levels below (−) the fusion level. Results are shown for the repeated measures preoperatively and 24 months postoperatively. Note that with increasing level (±) with respect to fusion, the number of subjects (N) decreases. The mean value for the corresponding number of subjects is shown, as well as the error bars of the 95% confidence intervals. The horizontal dashed line shows the measurement accuracy of 2.9 degrees. *Significant difference between repeated measures.
Degenerative Cascade Classification and Spinal Stenosis
The results for degenerative classification and spinal stenosis of the levels adjacent to the fusion level are shown in Table 2. Both preoperatively and 24 months postoperatively, there was a significantly different distribution in the number of cases with and without degeneration (p = 0.001) and spinal stenosis (p = 0.0045) for the various adjacent levels. The highest number of ASP was focused around the fusion level.
Frequency of cases with adjacent-level degeneration and stenosis
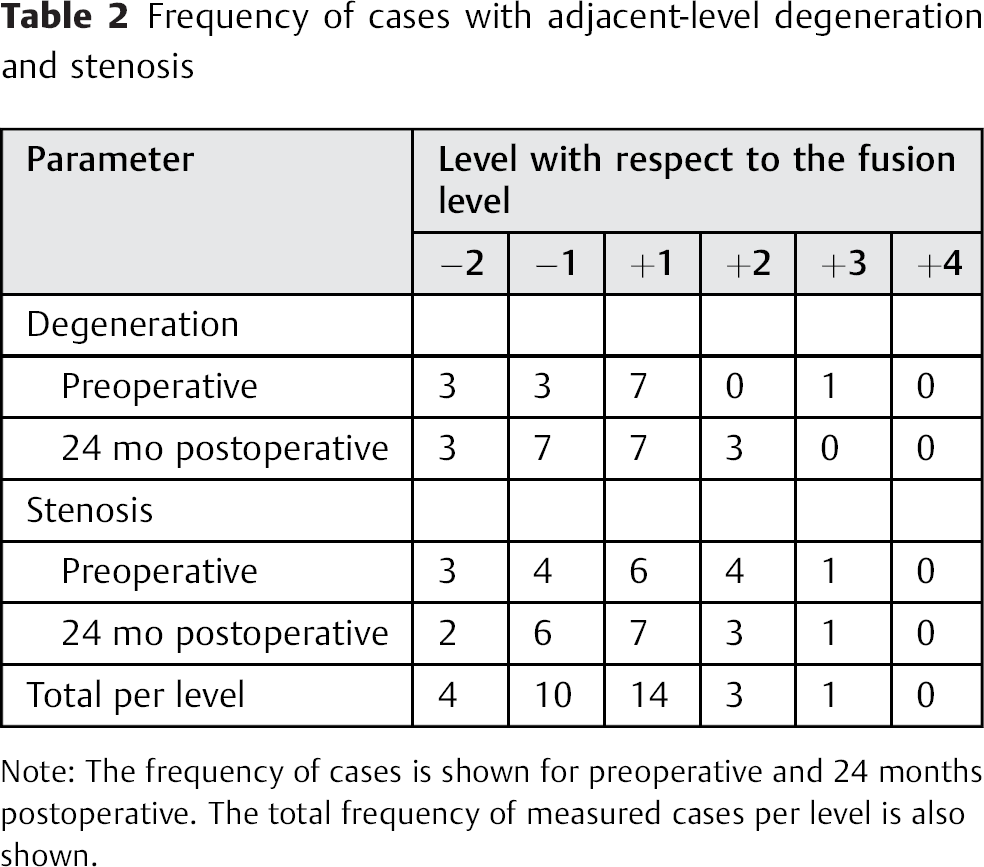
Note: The frequency of cases is shown for preoperative and 24 months postoperative. The total frequency of measured cases per level is also shown.
Cervical Curvature
The cervical curvature scores are shown in Table 3. After spinal fusion, 13 cases (72%) were fused in lordosis, whereas 4 cases were fused in neutral position and 1 in kyphosis. However, this postoperative distribution was not different from the preoperative values (p = 0.45). The group with lordosis showed no differences for ROM compared with the group of neutral position and kyphosis taken together.
Frequency of cases per neck curvature score (lordosis, no curvature, and kyphosis)
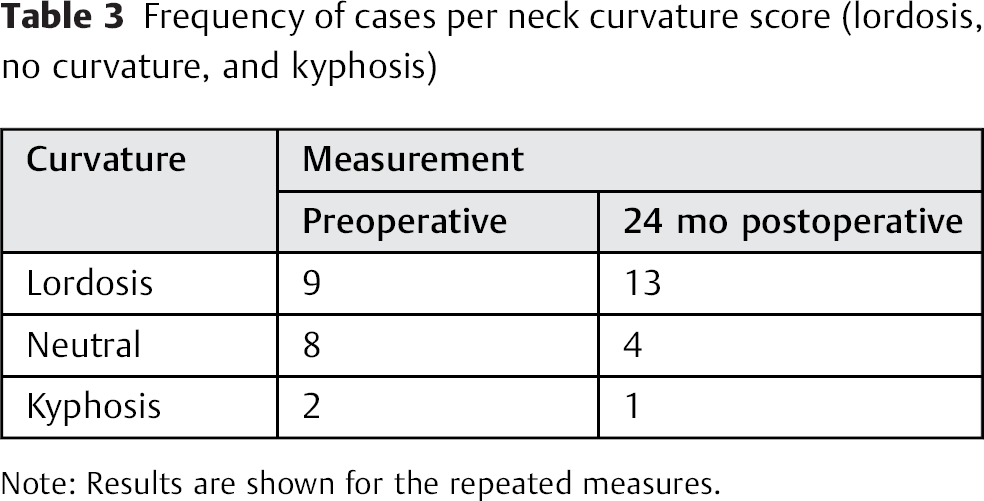
Note: Results are shown for the repeated measures.
Discussion
This study using kinematic MRI to measure ROM showed that segmental motion of the cervical spine can be measured with a precision of less than 3 degrees. After spinal fusion, as expected, ROM decreased at the fusion level. The fusion did not increase the ROM of the adjacent levels at 24 months postoperatively. But pre- and postoperatively, the ROM at the levels immediately adjacent to the fusion level was higher than those further away.
In this study, we used a new computer-aided method based on Penning's method to measure segmental motion of the C2–C7 preoperatively and 24 months after monosegmental spinal fusion on the base of the kinematic flexion-extension MRIs. The precision of our computer-aided measurement method is similar to data reported in the literature for standard conventional radiography. 19 Therefore, we conclude that our computer-aided method is a precise tool for measuring sagittal plane cervical rotation. It can be used in future research to study pre- and postoperative biomechanics of the cervical spine.
The ROM of the fusion level after surgery decreased substantially to 2 degrees, which is similar to the values reported in the literature. 10 , 20 Because 2 degrees is lower than the measurement error, we consider the fusion to be stable. (Note that fusion was not based on X-ray or CT imaging, which was not part of the protocol.) The ROM was significantly higher at the levels immediately adjacent to the fusion compared with those further away, which was not different from the preoperative situation. This result has been reported by others for results at 2 year postsurgery. 8 , 9 , 21 In contrast, a small but significant increase in ROM of 2.6 degrees at adjacent levels 24 months after fusion has also been reported by Kelly et al. 10 These contrasting findings may be the result of a difference in measurement technique: kinematic MRI in our study versus standard radiographs used by Kelly et al. Interestingly, Kelly et al noted that changes of postoperative ROM were associated with postoperative time of follow-up, suggesting that with a longer follow-up after fusion, ROM in the adjacent levels increases. Biomechanical studies performed on cadaveric cervical spine showed that at the levels adjacent to the fusion, 6 but also at the levels located further from it, 7 ROM increased immediately after fusion (changes ranging from 1 to 5 degrees). These studies were performed in a controlled environment, with goniometers attached immediately to the spine. The effect of fusion in vivo will likely be different, with factors such as adaptation over time and tissue conditions influencing outcome. We conclude that changes in ROM after fusion in the adjacent levels are relatively small up to 2 years after fusion.
Both preoperatively and 24 months postoperatively, a higher number of cases with degeneration and stenosis at the levels immediately adjacent to fusion level was found. There were almost no cases with degeneration and stenosis at further than two levels above or below the fusion. For comparison, the majority of in vivo studies focused on the levels immediately adjacent to the fusion, and therefore it is difficult to support this finding. 2 , 3 , 22 Further study on the relation between ROM and ASP is needed.
The majority of cases (72%) were fused in lordosis, which is similar to the data reported in the literature (66 to 82%). 23 We found no differences for ROM between the lordosis group and the deformity group (i.e., neutral or kyphosis). Malalignment of the cervical spine after fusion has been shown to be related to the development of ASP. 2 , 3 , 24 Confounding factors such as age, sex, smoking, preoperative alignment, ROM, and fusion level may all contribute to this relation. 25 In the long term, malalignment may be a risk factor in the development of ASP in the cervical spine after fusion.
This study has four limitations. First, the number of subjects is relatively low, which was caused by the low number of patients eligible for the study. But with the calculated 95% prediction limits of the ROM that are smaller than 3 degrees, we were able to detect a difference in ROM after fusion. Second, we did not study one constant level of cervical spinal fusion, which is also related to the number of inclusions per year and would have made inclusion even more difficult. But with the range of fusion levels in this study, our results are more generalizable, and we also present data concerning levels further away from the fusion, which is not common in literature. Third, we do not have long-term results. Such data is important for proper insight into how the fusion affects the biomechanics and degeneration in the longer term. 10 , 25 Also for ROM, an increase after the 24-month follow-up can be expected, and with the kinematic MRI assessment, such long-term data would be valuable. The focus of our study was primarily on assessing the precision of the kinematic MRI assessment. Fourth, cervical ROM was measured supine, which is expected to be different from ROM in the erect position as a difference in posture can affect ROM. 26 , 27 Active supine rotation has been shown to be greater than that in the upright position, 26 which may also be the case for flexion/extension. When extrapolating, the expected results of the patient seen at postoperative checkup may therefore be smaller than when measured in upright position.
In conclusion, using our computer-aided measuring method with kinematic magnetic resonance flexion-extension images, ROM after spinal fusion can be reproducibly measured. This method can be used not only in clinical practice to follow individual patients postoperatively, but also to study intervention and its effect on postoperative biomechanics of the cervical vertebrae. After fusion, the ROM does not increase at the levels immediately adjacent to the fusion. Preoperatively and postoperatively, the levels immediately adjacent to the fusion have the highest ROM. Follow-up after 5 to 10 years using our method for kinematic MRI assessment of ROM after anterior cervical decompression and fusion is a logical next step.
Disclosures
Marina Obradov: none
Menno R. Bénard: none
Michiel M. A. Janssen: none
Patricia G. Anderson: none
Petra J. C. Heesterbeek: none
Maarten Spruit: Chairman (AOSpine TK Cervical Expert Group)
Footnotes
Acknowledgment
We would like to thank Jan Veryser with his help on grading ASP and cervical curvature on the radiologic images.