
Abstract
Symptomatic disc degeneration is a complex pathological condition that involves a cascade of events and is not totally understood. In this context, animal models gain an important role, allowing for better understanding of the degenerative process and therapeutic interventions. There are several models with different methods of evaluation of experimental disc degeneration (EDD), including imaging, biochemical, genetics, and histological approaches, but no real gold standard has been set. The authors aim to evaluate EDD by means of automated morphometric analysis and to determine values for differentiating normal and degenerated discs by this method. The criteria mean and total cellular area, mean and total cytoplasm area, and total nuclear area of cells in the nucleus pulposus were able to differentiate the condition of degeneration (p < 0.05). In conclusion, by applying the histomorphometric analysis of EDD, the authors could present an objective measure of EDD changes within the nucleus pulposus, reducing the evaluator bias in future studies and presenting highly sensitive and specific criteria for EDD.
Symptomatic disc degeneration is understood as an early and pathological change on the structural and biological properties of the intervertebral disc (IVD) 1 once the degenerative process itself is part of physiological aging. 2 There are several definitions to symptomatic disc degeneration, all referring to a cascade process affecting not only the IVD itself but the vertebral end plate and facet joints. 3 Although there is constant evolution on the understanding of this process, several pathological steps of this cascade remain obscure. 4 , 5 This leads to a poor understanding of the clinical correlation, with a lack of efficient and standardized clinical management of its symptoms.6, 7 ,8, 9 , 10
Animal models of disc degeneration have allowed for a better understanding of the pathological mechanisms and for testing of therapeutic interventions. 11 , 12 There are several models of experimental injury available, including stab wounds to the disc, needle punctures, enzyme injection, mechanical torsion and distraction, among others. 13 , 14 , 15 One of the most reproducible and most commonly used methods is multiple needle punctures to the IVD. 16 Evaluation of experimental disc degeneration (EDD) is far from standardized with studies using radiographs, tomography, magnetic resonance imaging, and biochemical and histological analysis, 11 , 14 , 15 , 16 , 17 limiting comparison between different experiments and combination of efforts among research centers. Histological evaluation could be considered a gold standard for EDD evaluation and grading. Imaging studies only give indirect evaluation, and biochemical analysis has a great range of variations that limits its cost-effectiveness. 18 Even in histological analysis, there is great variation in preparing and reading the IVDs specimens, with several studies using subjective methods that are examiner-dependent and have low reproducibility. 19 , 20 There is a lack of standardized evaluation that could give absolute values to EDD and allow for an efficient, reliable way to evaluate therapeutic interventions.
This study aims to:
Develop a standardized and automated way to evaluate EDD, thus eliminating the subjectivity of previous grading methods for EDD;
Determine the specificity and sensitivity of such measurements.
Methods
Experimental Disc Degeneration
This project was approved by the Ethics Committee on the use of Animals of the Pontifical Catholic University of Parana (No. 252, 180/07), following the applicable regulations. For this study, 13 New Zealand male white rabbits, around 1 year old and weighting between 3.5 and 4.5 kg, were used. The following surgical procedure has been validated by the authors in previous studies. 17
Each animal received preoperative anesthesia with intramuscular ketamine chlorhydrate at 5% (20 to 25 mg/kg) and xylazine (0.15 mg/kg). A venous line was established at the left auricular vein.
After anesthetic induction confirmation, the animals were positioned on right lateral decubitus, and routine preparation of skin and draping was performed. A 5-cm lateral approach between the iliac crest and the last rib was performed, followed by blunt dissection of muscles and retroperitoneal exposure of the entire lumbar spine, with further dissection of the five most caudal IVDs (L2–L3 to L6–L7). The first two lumbar discs (L1–L2 and L2–L3) were left without dissection for control purposes.
The three most caudal IVDs were punctured manually three times with a 18-gauge needle, on a 5-mm depth, controlled by a bent on the needle, and was kept in each position for 5 seconds. The retroperitoneal space was washed with saline solution, and the muscle layers, as well as the skin, were sutured.
Twelve weeks after the procedure, the animals were euthanized with an overdose of pentobarbital (90 mg/kg), and the lumbar spine was dissected for histological preparation and morphometric analysis.
Histological Analysis
The specimens were fixed in formalin for 48 hours, followed by decalcification with EDTA at 20% for 25 days. The IDVs were then dissected out from the vertebral bodies, dehydrated, and fixed in paraffin. Six-micron cuts were performed on a transverse fashion, parallel to the puncture sites. The sections were stained using Sirius red, fast green, and hematoxylin-eosin (HE). The specimens underwent standard microscope evaluation, previously validated by the authors, followed by color morphometric analysis.
Color Morphometric Analysis
For this analysis the authors used the software Image Pro Plus® V.4.50 (Media Cybernetics, Silver Spring, MD), following digitalization of optic microscope imaging with an Olympus BX50 couplet (Olympus, Tokyo, Japan) to a digital camera. Three randomly chosen fields of the nucleus pulposus of each slide were analyzed with 1000× magnification.
The software then identified different-colored structures within the nucleus pulposus (cell nucleus, cytoplasm, extracellular matrix) in each field of each slide, based on a previous calibration, where the color density of each structure (cellular nucleus and cytoplasm) was determined by a pathologist (Fig. 1).
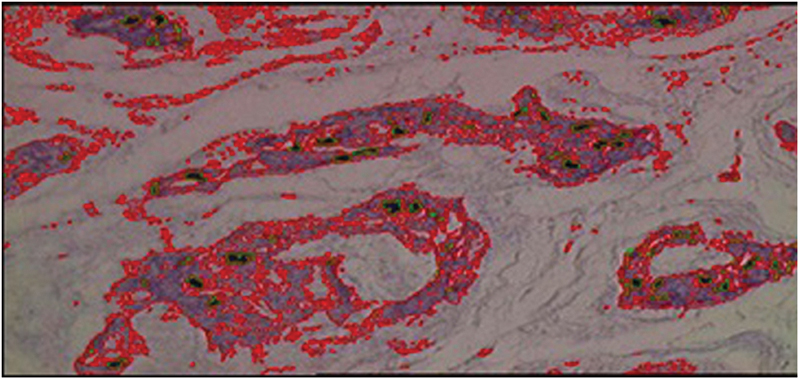
Nucleus pulposus, 1000× magnification, with cytoplasm in red and cell nucleus in green.
The software then measured such specific areas in units of square micrometers, generating a proportion of cellular area versus extracellular matrix inside the nucleus pulposus. This process was done three times in each slide of the 61 IVDs studied. At the end of such process, average values for cellular area, nucleus, and cytoplasm area were obtained for both degenerated and control (nondegenerated) discs. The data were then divided in the following subcategories:
Mean cellular area, obtained by marking both cell nucleus and cytoplasm within the nucleus pulposus, first by the average of each evaluated visual field, followed by the sum of three random fields in each IVD;
Total cellular area, obtained by the simple sum of all cellular area within the nucleus pulposus (nucleus and cytoplasm) of all the examined fields in each IVD;
Mean cell nucleus area, obtained by marking only the nucleus area of the cells inside the nucleus pulposus and calculating their mean among all fields studied;
Mean cell cytoplasm area, obtained by marking only the cytoplasm area of the cells inside the nucleus pulposus and calculating their mean among all fields studied;
Total cell nucleus area, obtained by the simple sum of all nuclear area (not counting cytoplasm area) of the cells inside the nucleus pulposus;
Total cell cytoplasm area, obtained by the simple sum of all cytoplasm area (excluding nucleus area) of the cells inside the nucleus pulposus.
Statistical Analysis
Statistical analysis aimed to differentiate values obtained for the two groups (normal and injured) and to establish values to be used in future studies.
The values were expressed through averages, mean values, and standard deviations for each of the IVDs. Comparison between injured and control discs used Student t test for dependent samples, followed by the Shapiro-Wilk test, with p < 0.05 indicating statistical significance. Furthermore, for evaluating the sensibility and specificity for differentiating injured from control discs, a receiver operating characteristic (ROC) curve was applied to each of the diagnostic criteria used, establishing therefore diagnostic end points for each situation.
Results
There was one death during the postoperative period, and this animal was therefore excluded from the study.
After retrieval of the specimens and histological preparation, 61 IVDs were obtained. Following the initial histological examination of the HE slides according to previously validated criteria (vessels crossing the annulus fibrosus, nucleus pulposus extrusion, and significant rupture of the annulus), 19 IVDs were considered as degenerated, accounting for 31% of the sample. Seventeen IVDs had vessels on the nucleus (89% of the degenerated discs), 79% had extrusion of the nucleus, and all had rupture of the annulus, as illustrated in Fig. 2.
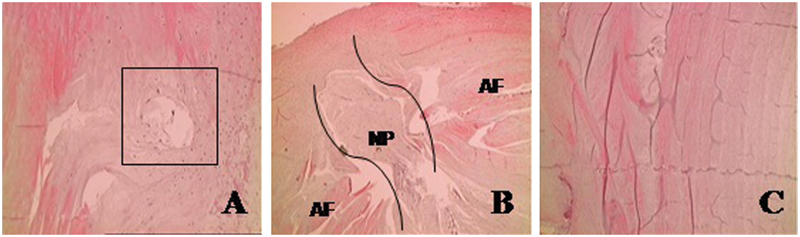
Criteria for histological degeneration: (A) vessels on the nucleus pulposus (NP); (B) extrusion of the nucleus; (C) rupture of the annulus (AF). (Hematoxylin and eosin, 200×.)
The control discs showed intact structure, with minor changes at the external layers of the annulus and slight subjective reduction in cell content; these IVDs were termed “noninjured” according to the previously mentioned criteria.
After color morphometry and statistical analysis of the data obtained, a comparison of degenerated and control group was performed.
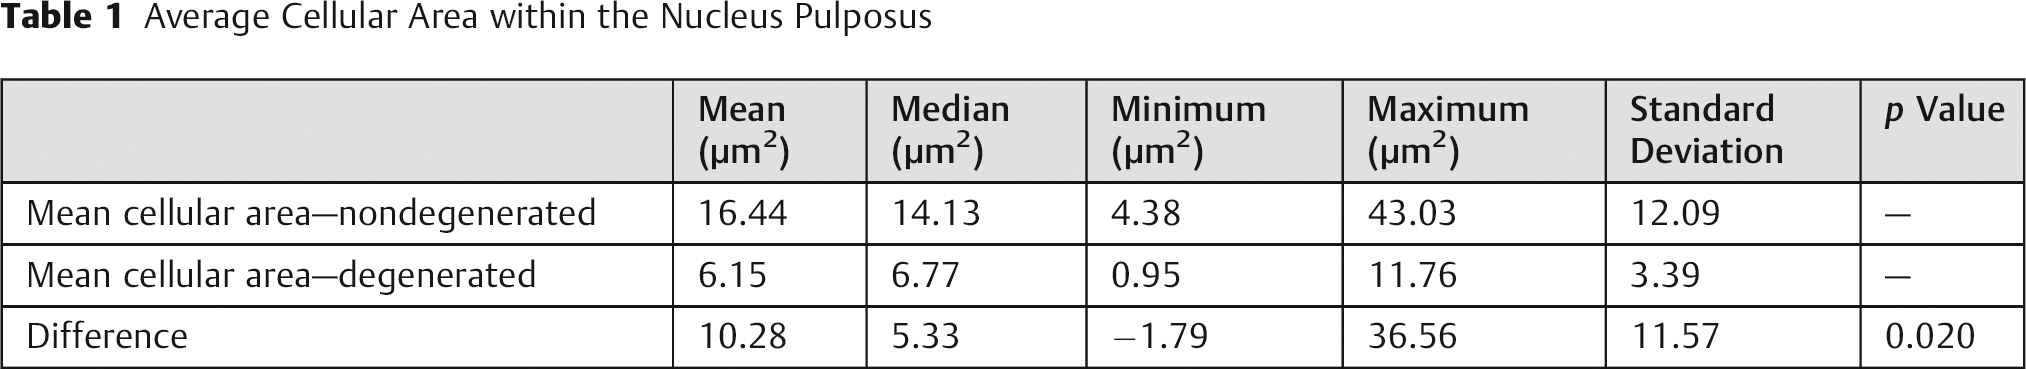
The results for mean cellular area are presented in Table 1. The statistical significance (p < 0.05) showed objectively that EDD presents with reduced cellular area, meaning smaller cells in the degenerated group when compared with the control IVDs. The ROC curve (Fig. 3) validates this measurement as highly sensitive and specific for disc degeneration.
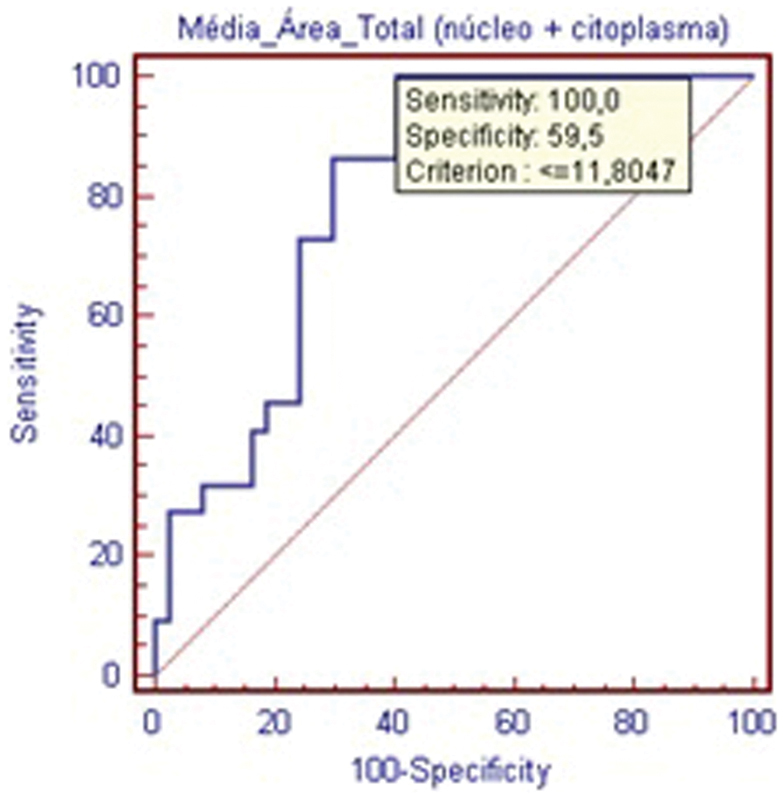
Receiver operating characteristic curve—mean cellular area within the nucleus pulposus.
Average Cellular Area within the Nucleus Pulposus
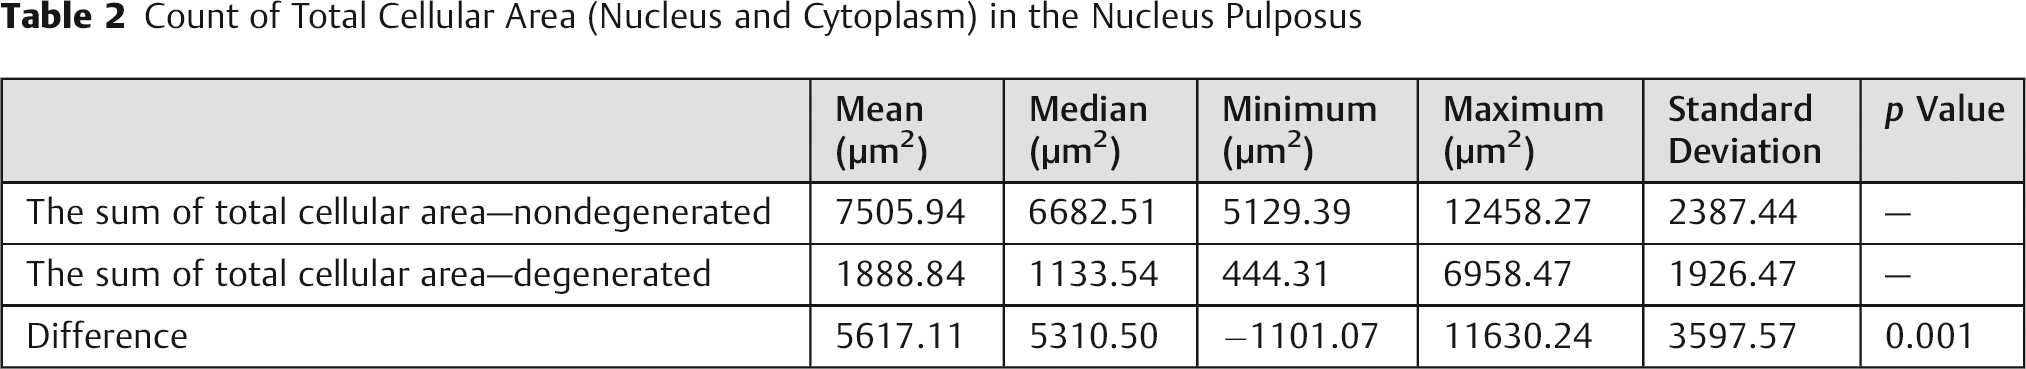
The sum of total cellular area is presented in Table 2. The statistically significant difference (p < 0,001) represents an important reduction in cell number in the degenerated specimens. The ROC curve (Fig. 4) validates this criterion as highly sensitive and specific for IVD degeneration.
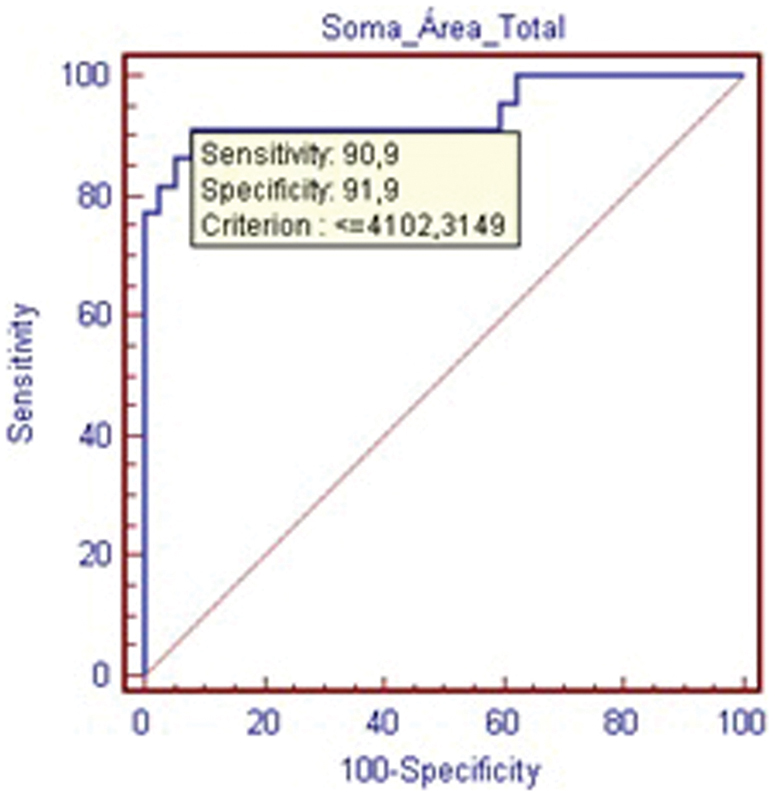
Receiver operating characteristic curve—count of total cellular area within the nucleus pulposus.
Count of Total Cellular Area (Nucleus and Cytoplasm) in the Nucleus Pulposus
The results for mean cellular nuclear area are presented in Table 3. The absence of statistically significant difference (p > 0.05) means that cellular nucleus size is not reduced in comparison to the control group. The ROC curve (Fig. 5) shows that it is not possible to differentiate between degenerated and control disc using this criteria.
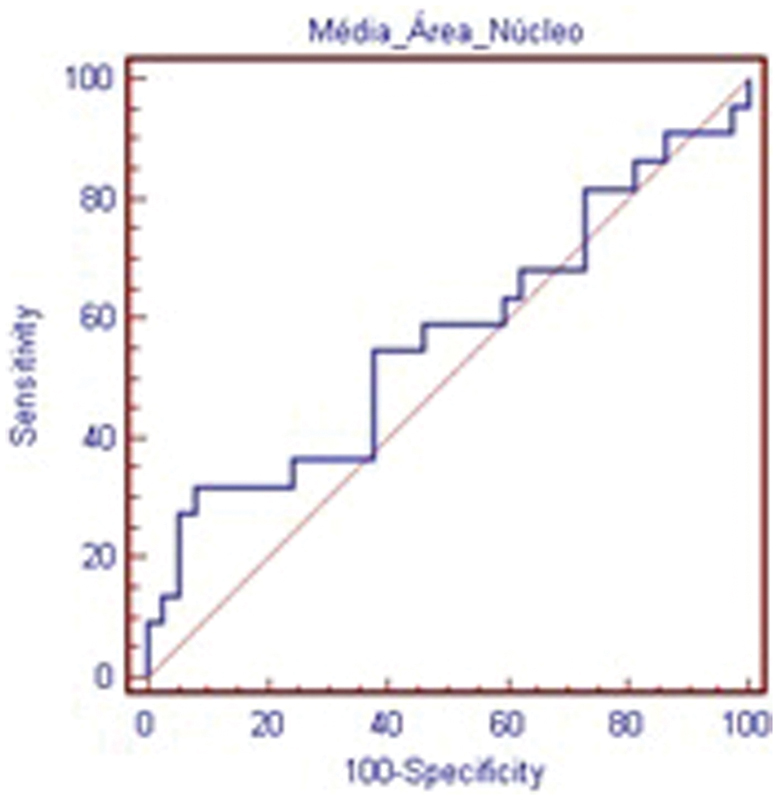
Receiver operating characteristic curve—mean of nuclear area within cells in the nucleus pulposus.
Mean of Nuclear Area within Cells in the NP
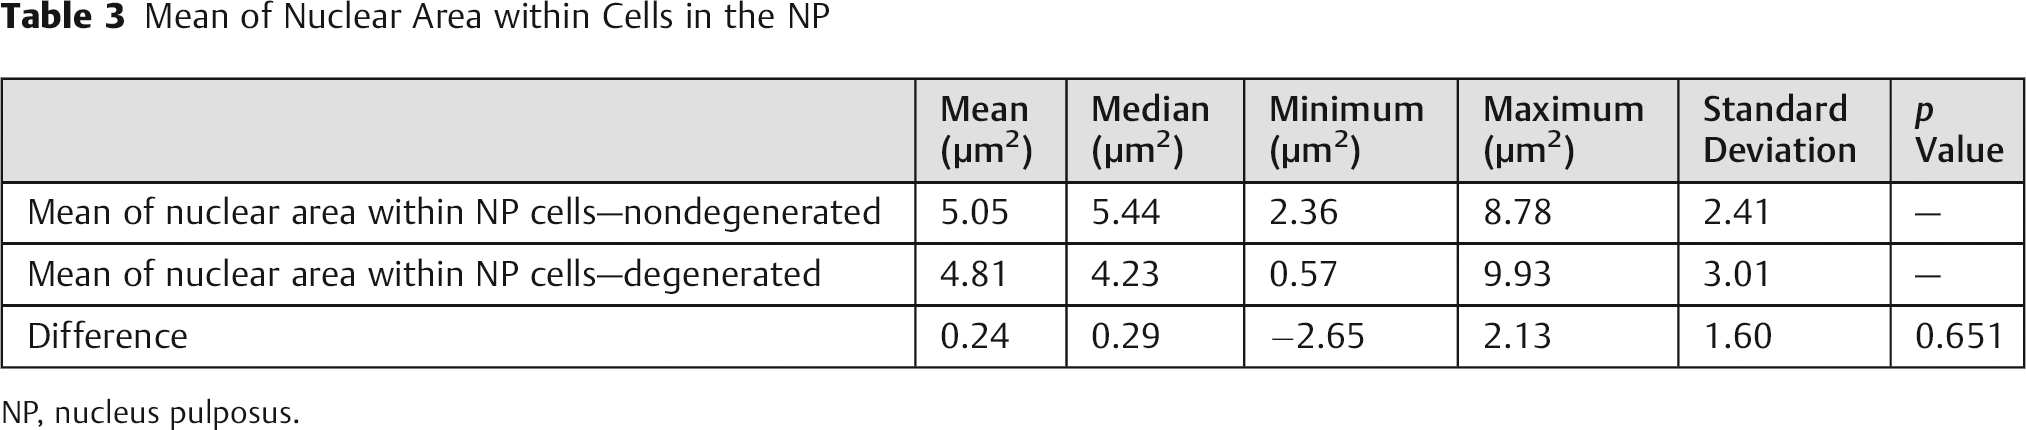
NP, nucleus pulposus.
The results for total cellular nuclear area are presented in Table 4, corroborating the findings of reduction in the number of cells in the degenerated group (p < 0.05) as identified by the total cellular area criteria. The ROC curve (Fig. 6) shows that this criterion is highly specific, but with a lower sensitivity in comparison with total cellular area.
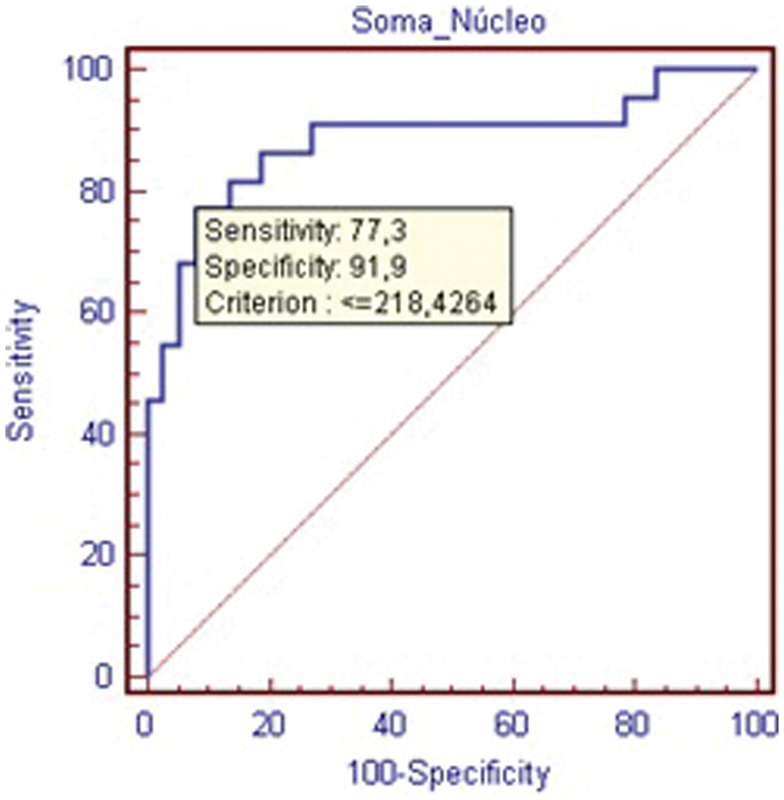
Receiver operating characteristic curve—count of nuclear area within cells in the nucleus pulposus.
Count of Nuclear Area within Cells in the NP
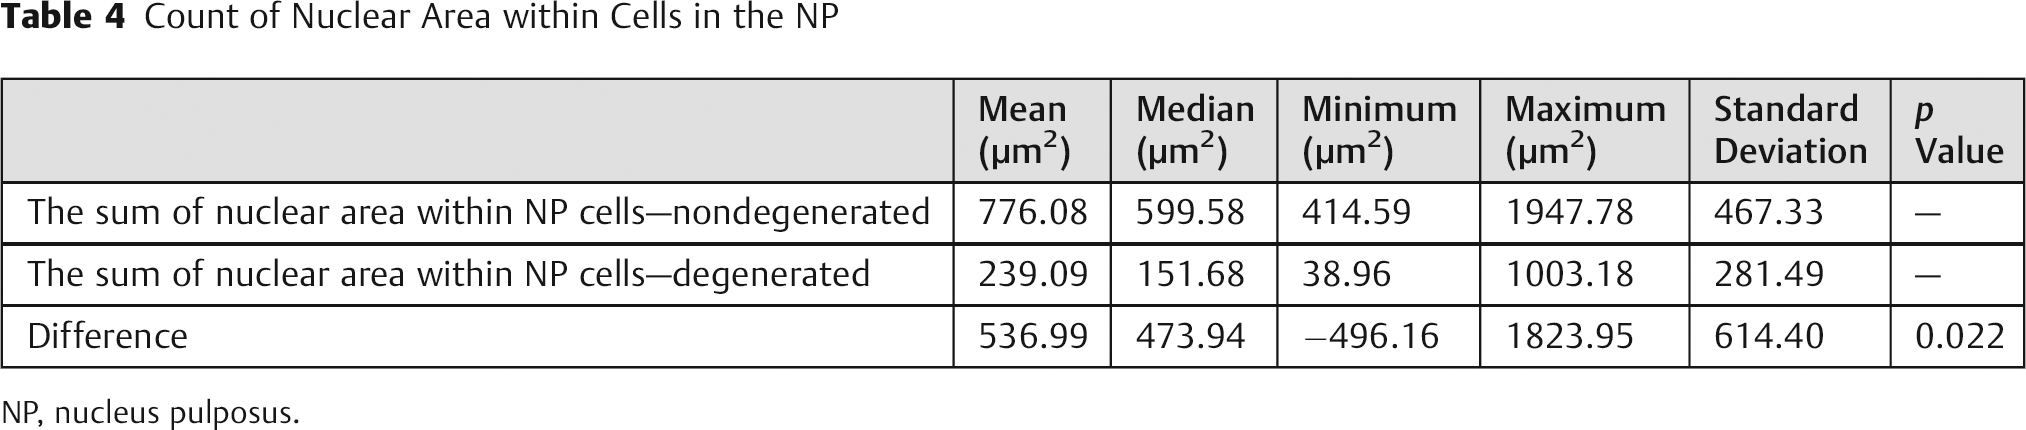
NP, nucleus pulposus.
The measurements for cellular cytoplasm area corroborate the previously mentioned data, with significant differences for both mean and total area measurements, as shown in Tables 5 and 6, and the ROC curves, as shown in Figs. 7 and 8.
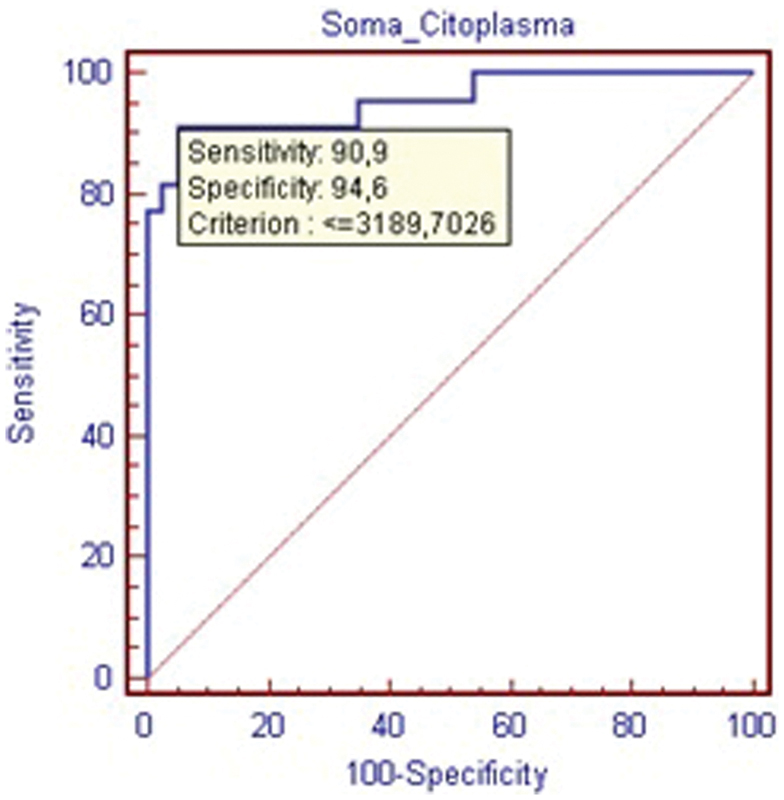
Receiver operating characteristic curve for the sum of all cytoplasm area within the nucleus pulposus cells.
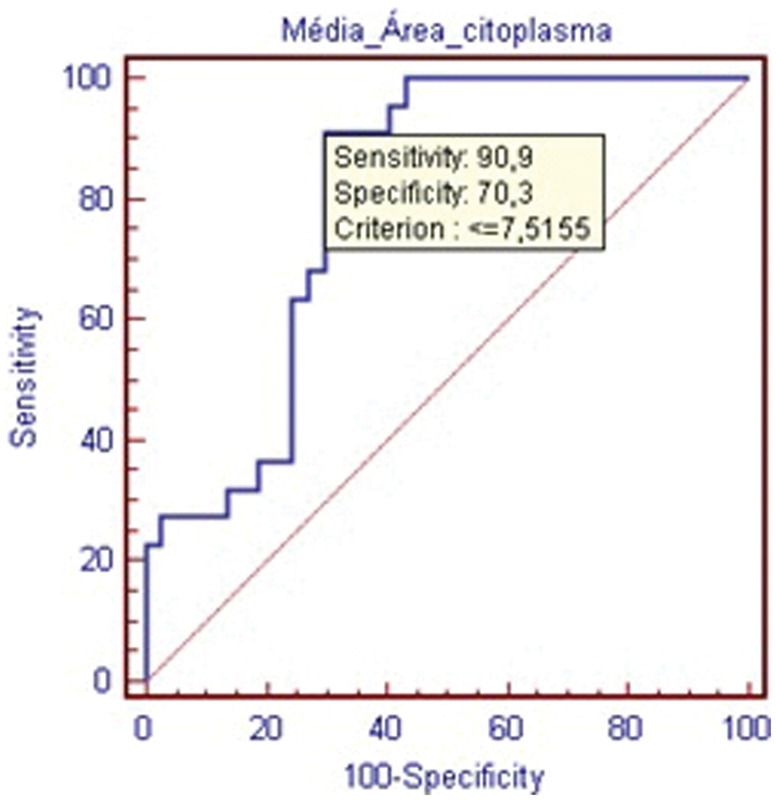
Receiver operating characteristic curve for the average cytoplasm area within the nucleus pulposus cells.
Mean of Cytoplasmic Area within NP Cells
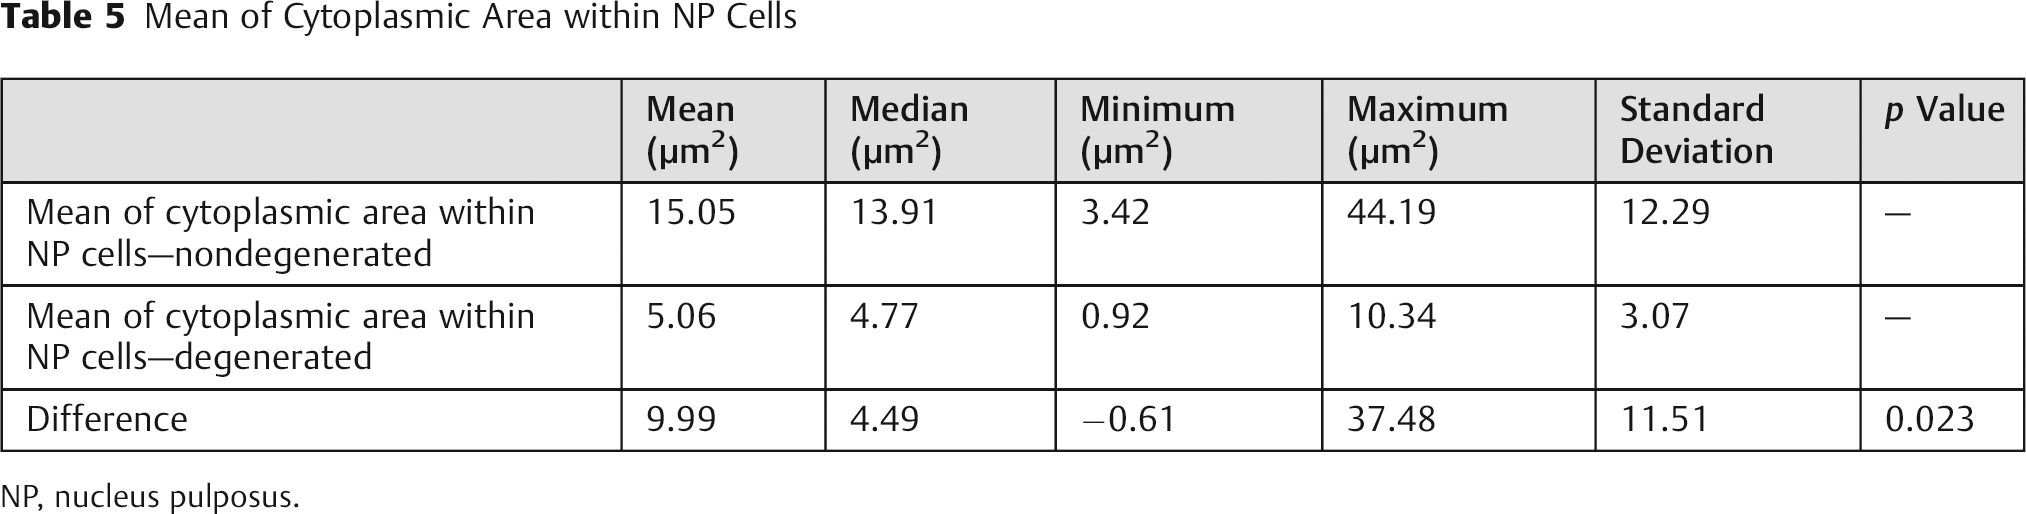
NP, nucleus pulposus.
Count of Cytoplasmic Area within NP Cells
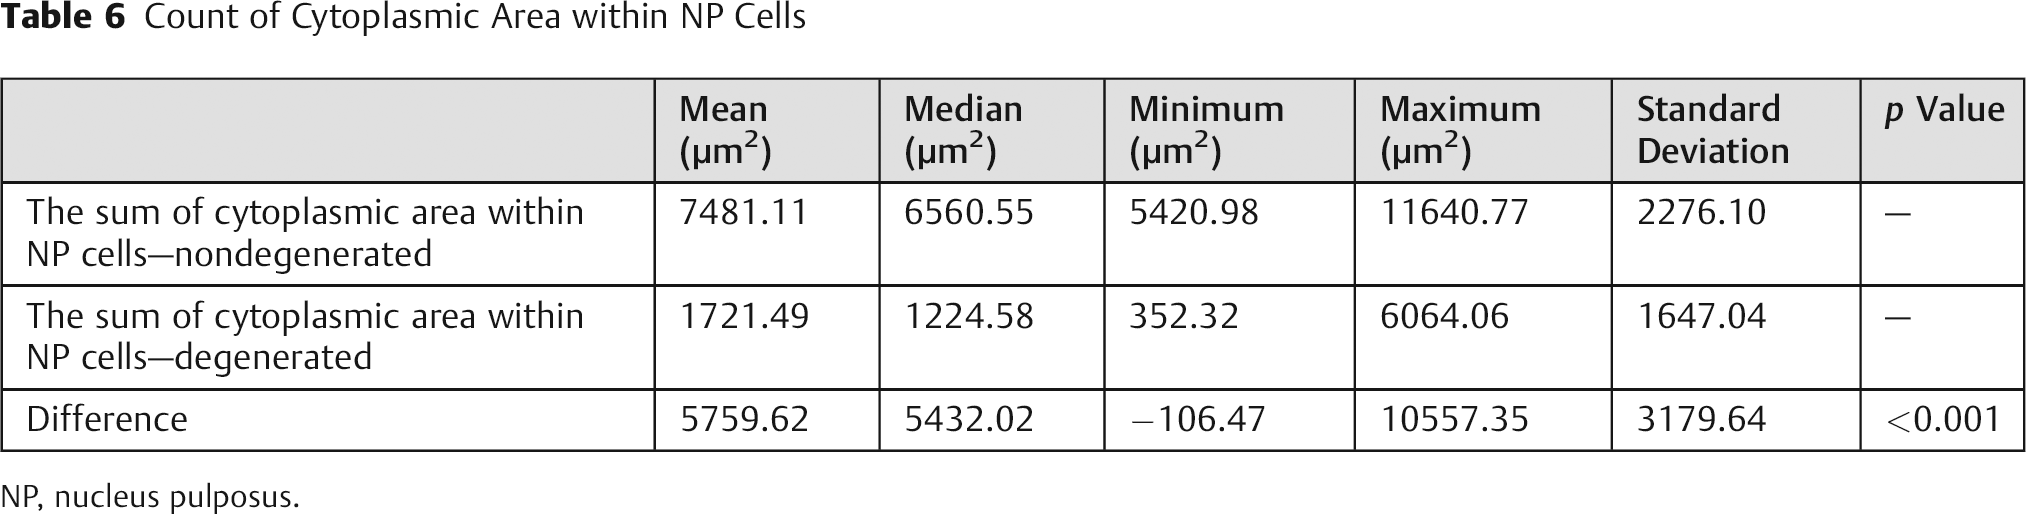
NP, nucleus pulposus.
Discussion
There is still controversy regarding the best method for producing and evaluating EDD. Several studies use multiple methods ranging from imaging studies, biomechanical essays, and biochemical characteristics of the IVDs, but histological analysis is still the most commonly used method and is considered a gold standard for differentiating degenerated and nondegenerated discs. 1 , 4 , 5 , 9 , 13 , 14 , 15 , 16 , 17 , 18 , 19 , 20 , 21 The main drawback of histological analysis is the interobserver and intraobserver variation on the reading, which would be minimized by an automated analysis.
Color morphometry has been used for studies on bone regeneration in orthopedics and odontology 22 , 23 and allows for quantification of cell number and size, in an automated fashion. Some authors have also studied cartilage matrix damage by this method.
The degenerated IVDs have several histological characteristics: reduction in cell number, changes in cellular and extracellular morphology, rupture of annulus fibrosus, neovascularization, and bone formation. Although some studies have attempted to standardize histological evaluation, there are no current objective data for quantifying such changes, limiting the understanding of degeneration and the development of strategies to control the pathological changes involved with abnormal disc degeneration (Table 7). 15 , 16 , 18 , 21 , 24 , 25
Studies Involving Experimental Disc Degeneration and Its Corresponding Method of Histological Evaluation
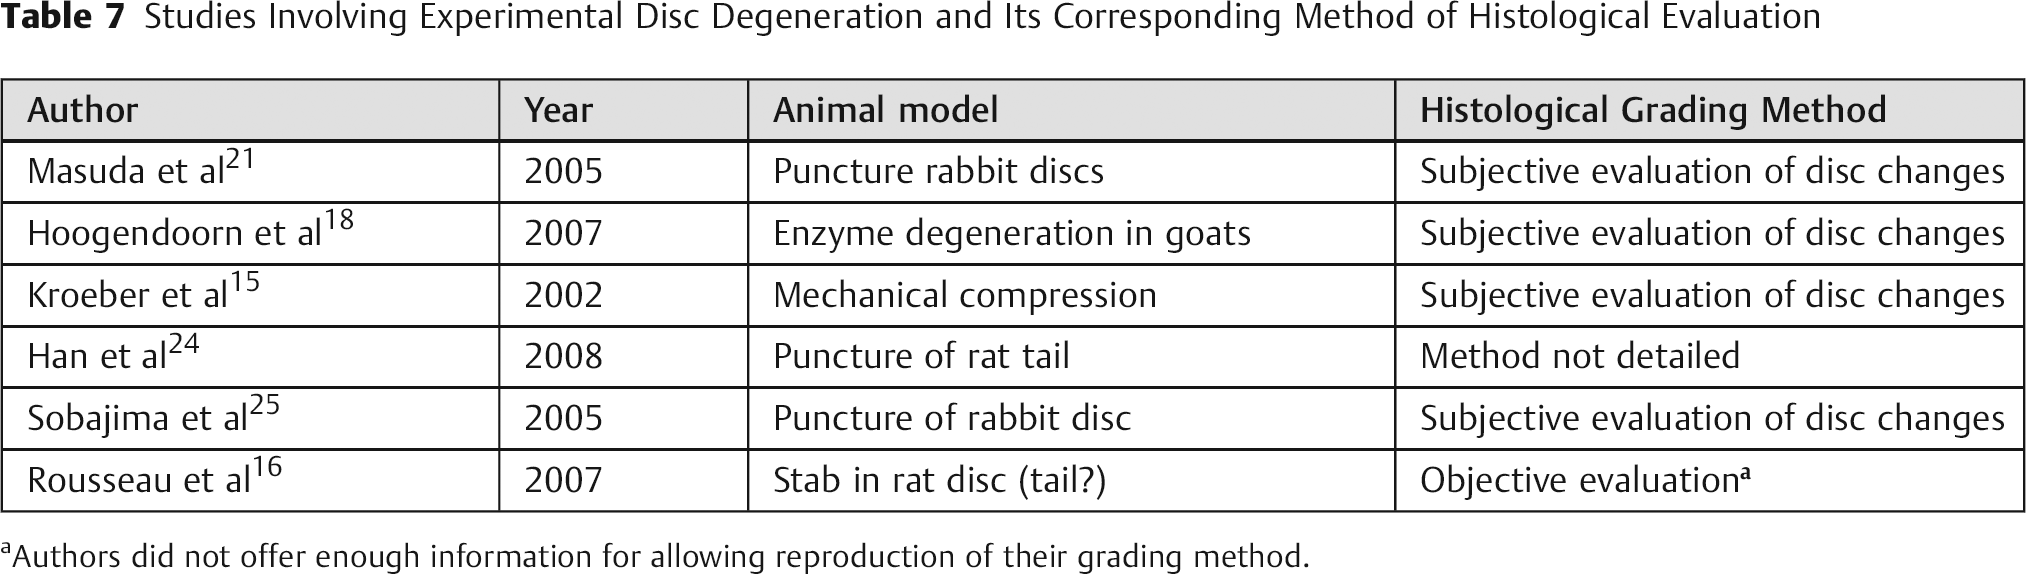
Authors did not offer enough information for allowing reproduction of their grading method.
The use of automated analysis allows for delimitation of cell size, as well as its components, and objective comparison between normal, degenerated, and possibly treated IVDs. This would also allow comparison between different research centers, avoiding repetition of research objectives due to different tissue evaluation.
Another difference in the present study is on the axis of tissue analysis. Although most studies use sagittal cuts including the vertebral end plates, the authors have used transverse cuts, focusing on the nucleus pulposus and annulus fibrosus, thus trying to reduce damage to the cells due to the differences in consistency between bone and disc during the cuts.
Some authors have tried to measure cellular density, 26 but morphometry is simpler and possibly more reproducible, as it considers different cell shapes and establishes minimal dimensions to be counted according to the purpose of the study.
The findings on this study give absolute values to data only suggested before. The reduction on the amount of cells, as well as nucleus size, together with the maintenance of cytoplasm size only conflicts with the findings of Rousseau et al, 16 who suggest measuring increase in cellular dimensions with disc degeneration.
Once the different shades have been identified, the analysis is no longer influenced by the examiner. Although errors on color differentiation are possible, they can be corrected by the examiner, and in this study they have occurred in statistically insignificant percentages.
In conclusion, the authors presented an objective measure of EDD changes within the nucleus pulposus. The automated reading by morphometric analysis may reduce evaluator bias in future studies, and the criteria used are highly sensitive and specific for EDD.
Disclosures
Emiliano Neves Vialle, None
Luiz Roberto Gomes Vialle, None
André de Oliveira Arruda, None
Footnotes
Acknowledgments
The authors are grateful to the Laboratory of Experimental Pathology and their team, and the Laboratory of Surgical Techniques and their team, for their support during the course of this project.