
Abstract
The General Health Questionnaire (GHQ) is an extensively researched and well-validated instrument for the identification and measurement of psychological problems [1–10]. It comes in a range of versions based on the number of items used. All of these versions have been subject to factor-analytic procedures as researchers try to identify whether scaled versions can add anything to the utility of the questionnaire.
The purpose of this paper is to review the factoranalytic research that has been carried out with regard to the GHQ-12. One weakness in much of factor analysis research is the failure of researchers to explore the replication of factor structures across research settings. In this paper we report on the results of our analysis of the correspondence between the different factor models that have been developed. To extend this analysis we utilized data drawn from a service evaluation research project in Tasmania to conduct a confirmatory factor analysis of the various models.
Literature review
The GHQ is a very well established instrument for the assessment and detection of psychological morbidity in the general population [1, 3, 5, 6, 9]. Initially developed to evaluate the mental health status of patients of general practitioners in the UK, the GHQ has been adapted and used in a multitude of studies throughout the world [7, 11–14]. It has been translated into a range of languages and its validity and reliability across cultures has been thoroughly assessed [15–31].
The scale was initially 60 items in length but, over the years, a range of shortened versions have been developed including the GHQ-30, the GHQ-28, the GHQ-20, and the GHQ-12. The longer versions of these have been identified as being useful both in directly assessing degree of psychological morbidity and as measures of outcome for clients receiving mental health services [3, 4, 6, 32, 33]. The shorter version (GHQ-12) has generally been used as a screening instrument and is particularly recommended for use in two-phase epidemiological surveys [34–38].
Originally the GHQ was scored in a bi-modal fashion (0-0-1-1) although this has been criticized as leading to an under-identification of respondents with existing psychological problems [39]. Goodchild has suggested a corrected scoring where negatively worded items are scored (0-1-1-1) and positively worded items are scored as in the original [40]. It has also been suggested that a Likert scoring (0-1-2-3) would be the most appropriate for statistical purposes [1, 41–43].
From the time of the introduction of the GHQ, in 1972, there have been efforts to evaluate whether it is a unitary measure or whether there are some underlying factors and the versions of the GHQ are based on factor analyses of the 60-item scale. The hope for many researchers has been to use the GHQ as both a general measure of psychological distress and as an indicator of specific psychological problems [8, 18, 24, 44–51]. The GHQ has been found to be strongly unitary but a number of factors have been derived from a number of the different GHQ formats. The number of factors that have been identified varies between studies but consistent factor names have been used. The most common factors identified are specific symptom factors for anxiety and depression, factors related to coping, feelings of incompetence, somatic complaints, sleeping difficulties, and social functioning [46, 47, 52–56].
We conducted a search of the literature through a number of potentially relevant databases for papers relating to the factor analysis of the GHQ12. The databases searched were: (i) PsycINFO, 1872-1966-2002/08–2002/ 09; (ii) Medline, 1966/1976–2002/11; (iii) RURAL; (iv) Social Work Abstracts, 1977–2002/09; (v) CINAHL, 1982/1988–2002/08; (vi) Allied Health and Complimentary Medicine Database, 1985–2002/11; and (vii) Australian Medical Index. Only 30 references matched a combination of the search terms used and these were then evaluated as to suitability for inclusion in the review. The search terms used is best described by the following definitive statement: (‘GHQ 12’ OR ‘General Health Questionnaire 12’) and (‘factor analysis’ OR ‘confirmatory factor analysis’ OR ‘CFA’). Our criteria for including a paper in this review were: (i) that the paper should report on exploratory or confirmatory factor analyses of only the GHQ12; (ii) that the main aim of the paper should be to present the analysis of the factor structure; and (iii) that there be enough data reported to reconstruct the factor structure.
Although the GHQ-12 was originally conceived as a unitary screening measure for psychological problems there have also been efforts to identify whether it has a multidimensional structure [57, 22, 58–61]. A range of studies using principal component analysis (PCA) and factor analysis (FA) have identified factors that account for 46–64% of the variance. Although some authors use the terms PCA and FA interchangeably it should be noted that the two methods rely on quite different assumptions about the data and we have used the terms to refer to distinct analyses. The majority of studies have used PCA with orthogonally-rotated factor solutions. A number of studies have reported oblique factor solutions [60–62]. The various studies have reported either a twofactor or a three-factor solution.
Martin [63] reports the only confirmatory factor analysis of the GHQ-12 that we have been able to find. He developed a three-factor model based on a content analysis of the GHQ items and compared this model to a single factor model, a positive/negative items two-factor model, and the models developed by Graetz [62] and Worsley et al. [57]. Martin's analysis supports the model that he derived but it should be noted that he used a relatively small population of university students and their relations and he utilized a non-standard 5-point Likert scale for scoring.
Most studies have identified a factor of mixed depression and anxiety, commonly referred to as ‘dysphoria’, although Farrell [58] identified separate factors for anxiety and depression. All of the studies identified a factor of ‘social functioning’ and, in the three factor models, ‘loss of confidence’ is specified as a factor. These factors reflect a subset of the factors that have regularly been identified in factor analyses of the larger scales. On the basis of a content analysis Martin [63] suggested three factors of ‘self-esteem’, ‘stress’ and ‘successful coping’.
An examination of the item loadings for each of the factors that have been identified shows that there are considerable differences between the scales (Table 1). Using Cattell's s Index [64] it is possible to calculate the similarity between factor loadings on variables between studies. The matched factors for the various studies are presented in Table 2 and it can be seen that there is very little replication of the derived factors. The factors identified by Worsely et al. [57] are most consistently reproduced in partial replications by Graetz [62], Daradkeh [22], Martin [63] and Politi [60]. There are isolated similarities between factors derived by Martin [63], Graetz [62], Politi [60] and Daradkeh [22].
Item loadings for factors
Matched factors with s Index = 0.70
The studies of the factor structure for the GHQ-12 are quite heterogeneous in terms of subject population, gender, and culture. They have also utilized different ways of scoring the GHQ including the original, the corrected, and the Likert methods. This heterogeneity makes it quite difficult to evaluate what may be contributing to the lack of agreement between the factor models. However, the failure to replicate the structure of the GHQ-12 complicates decisions about how to use the GHQ-12 as an instrument. All things being equal it would be important to be able to assess the relative ‘accuracy’ of the models before using the proposed factor structures in further research.
Shek [45] made a similar observation in relation to the GHQ-30 and Siegert et al. [65] observed that there was a remarkable lack of replication in research on the factor structure of the GHQ. Although they were referring specifically to the larger versions of the GHQ, they considered that the confusion about the structure was mainly due to general confusions about the use of factor analysis rather than an underlying weakness in the GHQ. Siegert et al. described and advocated a procedure for replicating factor analyses across research samples to provide evidence of consistent factors [65]. However, there appear to have been few attempts to use their statistical procedure by other groups [66].
Other approaches to replication or confirmation of the factor structure of the GHQ have been reported. Huppert [46, 67] identified a stable and replicable structure in the GHQ-30 using a large population and repeated factor analyses of random groups. Shek [45] reported an analysis of the Chinese version of the GHQ-30 using confirmatory factor analysis (CFA). Chan [68] reported on a CFA of the Chinese versions of the GHQ-28 and the GHQ-20.
The Tasmanian study
The data presented were gathered as part of a larger project evaluating the effectiveness of different mental health service delivery models to a rural population in Tasmania, Australia [69, 70]. In the first stage of a twophase epidemiological survey, for a 1-month period, clients waiting to see their GP were asked to complete the ‘How Are You Feeling Survey’. This was a survey designed for the study and included basic demographic information, information about the person's medical condition or reason for consultation with the GP, and the twelve-item version of the General Health Questionnaire (GHQ-20).
Subjects
At the conclusion of the first stage of the research 490 patients from five general practice surgeries agreed to complete the survey. Although no measure of refusal was included in this research, the anecdotal reports from reception staff suggested that approximately half of all people who were asked agreed to complete the survey.
Within this sample the age ranges were: 16–25 years, n = 55 (11.2%); 25–35 years, n = 69 (14%); 35–45 years, n = 105 (21.4%); 45–65 years, n = 178 (36.3%); 65– 75 years, n = 56 (11.4%); and 75 + years, n = 20 (4.1%). The gender distribution was 157 (32.0%) male, 320 (65.3%) female and 13 (2.6%) unknown. Occupational status was: 113 (23.3%) employed; 48 (9.8%) unemployed; 118 (21.4%) retired; 33 (6.7%) were disabled; 52 (10.6%) indicated home duties; and 35 (7.1%) indicated some other status.
Measures
In the first stage of the research the only clinical measure used was the GHQ-20. This was used to screen for possible psychological problems and also constituted an outcome measure at follow-up. The GHQ-20 contains all of the items from the GHQ-12 and this enabled the researchers to establish a comparison for cutting scores on both measures. The data from the GHQs were entered onto a database designed for this study and a number of scores were derived including Goldberg's original scoring, the corrected scoring, and a Likert style of score ranging from 0 to 3.
Models
The first step in a confirmatory factor analysis is the development of models of the relationships between the variables and the hypothesized factors. This was done by mapping the reported item-loadings against the derived factor structure for each of the studies in Table 1. In addition, because of the strongly unitary nature of the GHQ a unitary factor model was constructed. These models were constructed using the Path Tool in the structural equation modelling module of STATISTICA [71]. Each of the factorial models assumed that the factors were correlated but did not specify item-residual correlations.
Methods
Factor analysis
Factor analysis is essentially a procedure for reducing the complexity of data by attempting to identify an underlying set of relationships between variables. It is a statistical method that had not been widely used until the advent of computer-based computation because of the size and complexity of calculations that needed to be undertaken. Conceptually there are two broad approaches to data reduction using factor analytic techniques. The first and most widely utilized is ‘exploratory’ factor analysis. With this approach the data to be analysed is approached from an atheoretical position and the factors that are extracted are identified and named ‘post facto’. The second approach is ‘confirmatory’ factor analysis. Using this approach a model of the relationships between the variables is constructed and the statistical procedure consists of an analysis of ‘fit’ between the data and the model. This approach is theory or hypothesis-driven and models are constructed on the basis of expected relationships [72, 73].
There is some debate about the relative merits of these two factoranalytic methods. There are certainly some that take the position that a ‘confirmatory’ factor analysis is more powerful, partly because of the underlying mathematics and partly because of the correspondence between data modelling and the ‘scientific method’. However, a balanced approach to these two statistical procedures is to recognize that they are complementary. Exploratory factor analysis can be used to ‘mine’ data to develop hypotheses, which can then be subjected to hypothesis testing utilizing the confirmatory methods [74].
An analysis of the GHQ-12 using confirmatory factor analysis would provide evidence for deciding between the different factorial models of the instrument that have been developed over the past twoand- a-half decades of research. As several different models can be developed from the factor analyses reported in various studies the relative ‘goodness-of-fit’ between these models can form the basis for evaluating which model(s) may provide the best description of the relationship between the items on the GHQ-12.
Cattell's s Index
The s index is a method for making comparisons between factors in scales made up of the same variables. The loading of any variable on a factor can be considered as statistically meaningful in a positive direction, negative direction or not statistically meaningful. A variable can be classified into a 3 (Factor a: Positively salient, Hyperplane, Negatively salient) · 3 (Factor b: Positively salient, Hyperplane, Negatively salient) contingency table by comparing the loadings on each factor. The similarity between the factors is then calculated by a calculation involving the cell frequencies.
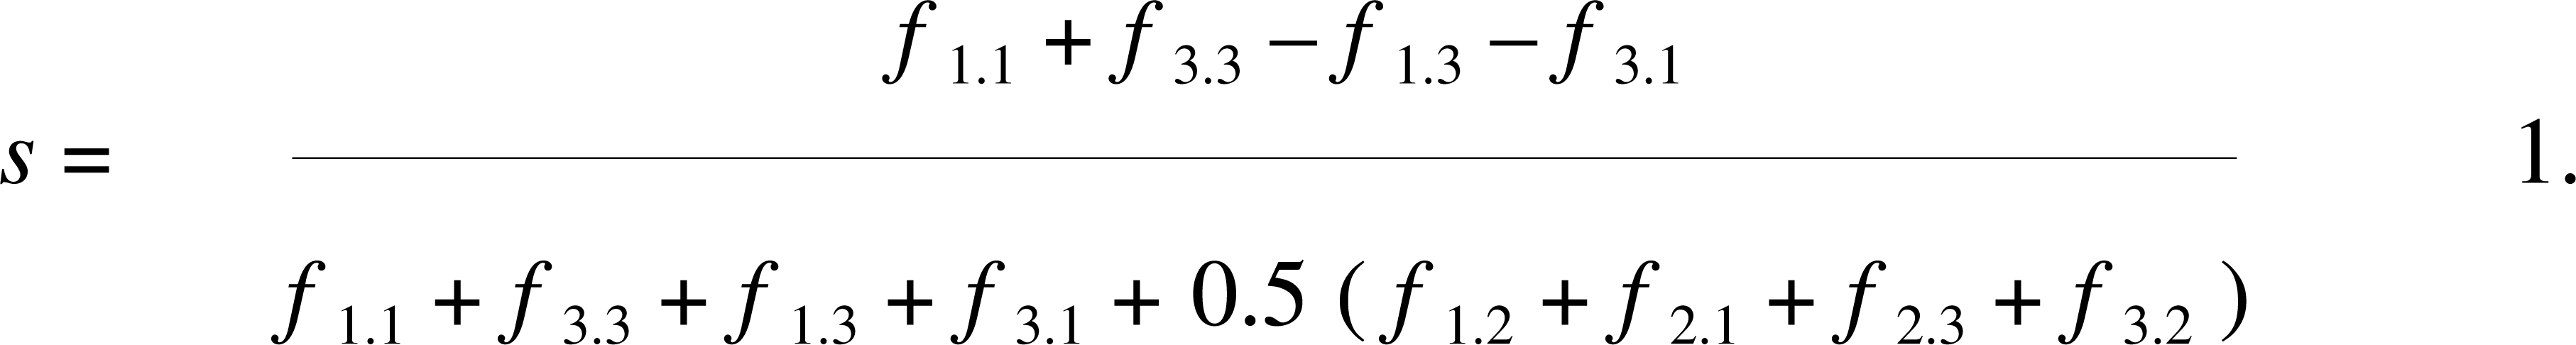
The s index can range from a maximum value of unity which represent a perfect replication of factor loadings through 0 where no relationship between the loadings is seen to a minimum of −1 which indicates a perfect replication but with the signs reversed.
Result
The models that were constructed from the reported item loadings in the various studies reviewed were subjected to structural equation modelling using the SEPATH module of the Statistica program [71]. Each model was analysed using the Generalized Least Squares–Maximum Likelihood discrepancy function and the analyses were conducted on the covariance matrix generated from the raw data. Each model was evaluated using the original scoring of the data, the corrected scoring, and the Likert scoring.
As the field of CFA is a developing one there is no clear agreement as to the best statistic to report. This paper uses three of the indices for ‘goodness of fit’ that are identified as being most rigorous. Our main criteria has been to use a statistic that takes account of model parsimony wherein models with fewer parameters (more parsimonious) tend not to fit as well as less parsimonious models. The statistics reported in this paper are: (i) the Steiger-Lind RMSEA Index which is well established (lower ranges on the RMSEA indicate fit and a statistic less than 0.05 is an indicator of ‘good’ fit); (ii) the Adjusted Population Gamma Index (APGI) which is derived from the population non-centrality parameter (the APGI can range from 0 to 1 and point estimates of 0.95 indicate good fit whilst values of 0.99 and above indicate excellent fit); and (iii) the Bentler-Bonett Normed Fit Index, a single sample index where values above 0.95 are considered to indicate good fit [71].
The data from the analyses are reported in Table 3. All of the models do equally well when the data scored in the original format is analysed with moderate levels of fit. None of the models scored above the criterion for ‘good’ fit on any of the indices. When the CGHQ data was analysed most of the models fit even less well. Only two of the models showed any values above the criterion values. The Worsley model showed good levels of fit on all three indices and the Graetz model showed a good fit on only the APGI.
Goodness-of-fit for the various models
The results for the Likert-scored data were similar to the CGHQ data. Most of the models show moderate to low levels of fit with only the Worsley model showing a good level of fit on two of the indices.
Comparing the various 2- and 3-factor models to the unitary case, it can be seen that no particular model is better than a single-factor model using the original scoring. With the corrected scoring the 3-factor models of Worseley, Graetz, and Darredkeh and the 2-factor model of Politi show better fit than the single-factor model. With the Likert scoring only the Worseley and Graetz models show a better fit than the single-factor model.
Conclusion
The GHQ has been extensively researched since Goldberg introduced it in 1972. It is recognized as one of the most practical and reliable ways of detecting minor psychological disturbance in a range of populations. The GHQ-12 is popular as a screening tool in most areas of mental health research and is often recommended as a standard for assessment of outcome in service research.
This paper explored the factor structure of the GHQ-12 using a confirmatory factor analysis approach. Seven models were derived from papers providing details of exploratory factor analysis of the GHQ-12. One model was based on a confirmatory factor analysis of the GHQ-12 and one single-factor model was based on the literature that the GHQ is strongly unitary. The models were explored for ‘fit’ using the data scored in the original, corrected, and Likert fashion. We made the assumption in each of the models that each of the latent factors was correlated with each other. Only three of the studies reviewed here used oblique rotation of the factors [60–62] allowing the factors to correlate in their reported factor model. However, it can be assumed that any factors of the GHQ would be quite highly correlated in reality and that it is a fair assumption to make in any model building.
It has to be recognized that a CFA cannot identify which model is the ‘true’ model underlying the data. A number of different models could hypothetically fit the data equally well and the issue as to which is the ‘better’ model is one of parsimony and plausibility. This was the situation when we compared the models using the originally scored data. No model achieved the criterion of ‘good’ or ‘better than good’ fit but all fitted equally well. This outcome seems to mimic the lack of consistency between the various studies and suggests that the multiple factor models that have been proposed are all adequate but not excellent reflections of the data.
However, when the models are compared using the corrected and Likert scoring of the data a clear differentiation arises. Only the model based on Worsley [57] achieves a good fit or better across the scoring systems. The model based on Graetz [62] shows a good fit for the corrected GHQ scoring on only one index and falls below criterion with the Likert scoring for all indexes. Using factor-matching it appeared that there was a clear association between the two models with Graetz' model providing an incomplete description of Worsely's model. The results of the CFA support this conclusion and further suggest that the model derived from Worsley [57] is a more robust model and less affected by changes in scoring procedures. It may even be that this model reflects a more consistent underlying factor structure within the GHQ-12 that can be most easily extracted when the data is scored in a modified way.
It is suggested from this analysis that the model based on Worsley's [57] paper would serve as a good basis for the identification of scales within the GHQ-12. If the data were scored using a corrected or Likert procedure this model should provide a very good level of fit but the best level of fit can be obtained from using the corrected GHQ scoring procedure.
However, there is clearly a need for more research utilizing an hypothesis-testing approach to the factor structure of the GHQ in general and the GHQ-12 in particular. Our research provides only an initial exploration of this area. It would be particularly useful to see a number of factor-replication studies using Siegert's [65] suggested procedures applied to the GHQ-12. In the meantime it would be possible for researchers with existing data sets to re-analyse the data using CFA to see if the findings of the present study can be replicated.
Footnotes
Acknowledgements
This research was supported through a grant from the Commonwealth Department of Health and Aged Care in association with the Divisions of General Practice, Northern Tasmania.