
Abstract
Research has increased our understanding of the clinical epidemiology of eating disorders including their prevalence in adolescents [1] and the longitudinal course of such disorders [2]. There has also been recent evidence of decreasing mortality among sufferers [3], although standardized mortality rates remain unacceptably high [4]. Research into the aetiology of eating disorders has emphasized multifactorial causation with family functioning playing an important role [5, 6]. Family therapists emphasize dynamic issues including family enmeshment [7] and difficulty in separating from the parent [8] and hypothesize that the patient's symptoms are expressions of underlying, largely unspoken family conflict. Family factors may also maintain the illness through inconsistent parenting, poorly resolved marital conflict, overly involved relationships, communication problems and a battle for control between child and parents [9, 10].
Family functioning studies using self-report measures have found that adult women with eating disorders rate their family interactions as more unhealthy than do women in control groups [11, 12]. Studies with non-clinical samples indicate that family factors such as intrafamily conflict, lack of family cohesion and organization [13], family attitudes towards body satisfaction and social appearance and family emphasis on achievement [14] confer an increased risk of the development of an eating disorder. Research into the family functioning of individuals with anorexia nervosa has produced equivocal results. Significant associations between anorexia symptoms and parental overprotection [15] and ‘adverse family background’ [16] have been reported. However, Gowers and North found no relationship between adolescent report of family functioning and anorexia nervosa severity [17], nor any difference with controls on self-report of family dysfunction [18]. Self-reports of family functioning by bulimia nervosa patients indicate high levels of family distress [19], family conflict [20, 21], family teasing [22], and parental intrusiveness and concern about eating, shape and weight [23]. Patients with bulimia nervosa also tend to report significantly higher levels of family distress than do other members of their own families [19]. However, these studies present inconsistent findings with regard to parental self-report measures. Further, the reported family dysfunction may not be due to bulimia nervosa per se. Blouin et al. reported that the problematic family profile of individuals with bulimia nervosa was most prominent in patients with a comorbid diagnosis of depression [24] and was consistent with the profile typical of distressed families having at least one family member requiring psychiatric treatment [25].
Research with adult patients has compared family functioning across eating disorder diagnostic groups. Patients with either anorexia or bulimia nervosa reportedly perceive their families to be lower in adaptability (rigid) and cohesion (disengaged) than do controls [26]. An analysis of parent and daughter family functioning ratings indicated that the daughters’ ratings did not distinguish between the anorexia and bulimia nervosa groups, but did distinguish clinical (any eating disorder) from control families. Daughters’ ratings of family functioning were the best predictors of the presence of an eating disorder, accurately classifying 85.9% of cases. Mothers’ ratings were next best in their predictive ability, while fathers’ ratings were poor predictors [26].
This study employed a short version of the McMaster Family Adjustment Device (FAD) [27]. Halvorsen's review of family functioning measures concluded that the FAD is superior to some other instruments in that it is based on a theoretical framework and employs a rational method of test construction [28]. The FAD has established concurrent validity with the Dyadic Adjustment Scale [29], the McMaster Clinical Rating Scale [30] and the FACES II [31, 32]. It is a paper and pencil self-report screening instrument designed to evaluate six dimensions of family functioning: problem solving, communication, roles, affective responsiveness, affective involvement and behaviour control [27]. A seventh scale, the General Functioning Scale [FAD-GFS], provides an overall measure of the health or pathology of the family and was the instrument employed in this study. The FAD-GFS is highly correlated (range r = 0.48–.76) with each of the six dimensional scales [27] and is recommended for use as a brief version of the FAD [33]. Based on theory and empirical evidence Miller, Epstein, Bishop and Keitner [32] recommend a clinical cut-off score of 2.00 on the FAD-GFS to discriminate healthy from unhealthy family functioning. They report a diagnostic confidence rating of 0.83 for this method [32].
Research using the FAD indicates that 90 per cent of the items load most strongly on the factors hypothesized by the McMaster Model [34]. Kabacoff, et al. reported factor invariance across groups [34], while Fristad [35] concluded that the McMaster model of family functioning possesses greater sensitivity in discriminating clinical and non-clinical families, greater consistency between clinical rating scales and self-report forms, and a closer fit of empirical findings to theory than does the Circumplex Model. The concordance of FAD scores varies according to the family members involved. Moderate agreement has been reported between the scores of mothers and fathers on the FAD, with fathers reporting worse family functioning than mothers [31]. In both community and clinical populations adolescents rate their families as significantly less healthy than do their parents. The biggest differences in scores are found between mothers and their adolescent children, and older adolescents tend to rate their families as less healthy than do younger adolescents [36].
The three major criticisms of the FAD have been that it lacks cultural flexibility [37], that some items presume that the family is an intact family [37], and that some constructs require clearer definitions [28]. These criticisms of the FAD were not considered relevant to this study given the cultural similarity of Australia and Canada where the FAD was developed, the high proportion of intact families in the sample and the use of the short, rather than the multidimensional, version of the FAD.
Byles et al. [33] used the FAD-GFS with a random sample of 1869 families in Ontario and reported acceptable internal consistency (Cronbach's alpha α = 0.86; Guttman's split-half reliability r = 0.83). High FADGFS scores were found to be associated with parental deviance, alcohol abuse, emotional disorder, marital disharmony, parental separation and spouse abuse [33]; results that demonstrate the construct validity of the scale. That the FAD-GFS possesses discriminate validity is evidenced by its ability to distinguish between healthy and unhealthy family functioning based on clinicians’ assessments [32] and between community and clinical populations [27, 36]. Miller et al. [32] report a very weak correlation of r = −0.14 between the FAD-GFS and the Crowne-Marlowe Social Desirability Scale [38], indicating that the scale is not strongly affected by social desirability responding. They also reported a one week test–retest reliability of r = 0.71 [32]. These findings indicate that the FAD-GFS is psychometrically suitable for research purposes.
This study aimed to assess the internal consistency of the FAD-GFS when completed by children with an eating disorder, to examine the concordance of parent and child FAD-GFS scores and to compare FAD-GFS scores and profiles obtained from a clinical sample with community norms. Based on previous research findings, it was hypothesized that parent and child and adolescent FAD-GFS scores would be moderately correlated. It was further predicted that the FAD-GFS scores of parents and children and adolescents in this sample would be significantly higher than community norms and that a significantly greater proportion of eating disorder families would be rated as dysfunctional using the cut-off score recommended by Miller et al. [32]. An additional aim was to compare FAD-GFS scores and score profiles across child and adolescent eating disorder diagnostic groups. It was hypothesized that while patients with either anorexia or bulimia nervosa and their parents may report similar levels of family dysfunction, the form of dysfunction, as identified by FAD-GFS item profiles, would differ among the diagnostic groups.
Method
Research participants
The participants for this study were 80 of the first 100 children and adolescents seen consecutively over a period of 20 months by an eating disorders clinic at a public teaching hospital for children in Western Australia, and their parents. The children and adolescents were aged between 9 and 18 years (m = 14.5, SD = 1.6), and were predominantly female (97.5%). Following a multidisciplinary assessment involving a child and adolescent psychiatrist, clinical psychologist, dietician and paediatrician, individuals were assigned a consensus DSM-IV diagnosis. Forty-two of the children were diagnosed with anorexia nervosa (including 10 with primary amenorrhoea), 26 with eating disorders not otherwise specified (EDNOS), 8 with bulimia nervosa, and 4 with subsyndromal bulimia nervosa. Owing to the relatively small sample size subsyndromal bulimia nervosa and bulimia nervosa diagnoses were not differentiated for the purposes of this study. In our clinical experience subsyndromal bulimia nervosa children in general are those who do not meet the binge frequency criteria of the full syndrome. A diagnosis of no eating disorder was made in 20 cases and these individuals were omitted from the study. Assuming a large effect size (0.8) and setting alpha a priori at 0.05, this sample provides power of 0.94.
Family structure across the diagnostic groups varied little. Similar proportions of patients diagnosed with anorexia nervosa, EDNOS and bulimia nervosa reported living with both biological parents (71.1%, 70.0% and 63.6%, respectively), with a mother and stepfather (20.0%, 20.0% and 18.2%, respectively) or with a single mother (8.9%, 10.0% and 18.2%, respectively). No significant age differences were detected among the diagnostic groups.
Measures
The FAD-GFS is a 12-item scale comprising 6 items describing healthy family functioning and 6 items describing unhealthy family functioning. Low scores indicate healthy family functioning. Community norms for the FAD-GFS were obtained from the Western Australian Child Health Survey (WACHS) [39, 40]. The WACHS was a population-based cross-sectional survey using multistage area sampling of households across the 1991 census districts. The community norms are based on data obtained from 2373 children and adolescents aged 4 through 16 years living in 1462 randomly selected households [39].
Procedure
The eating disorders clinic accepts primary, secondary or tertiary referrals. Following a telephone triage interview individuals attend an assessment clinic over two mornings. Assessment includes a semistructured psychiatric interview, a physical examination by a paediatric gastroenterologist, dietary assessment, anthropometric testing and administration of the Eating Disorders Examination (EDE) [41]. During this period referred patients also complete the FAD-GFS. Parents complete the FAD-GFS prior to the first appointment. Sixty-six of the 80 children and adolescents invited to participate in the study completed the FAD-GFS, as did 75 of their parents. This represents response rates of 82.5% for children and 93.8% for parents. There were no significant differences in mean age or gender distribution between the respondent group and the non-responders. The Hospital's Scientific Advisory Committee and Ethics Committee approved the research project prior to commencement of data collection.
Results
Psychometric values and parent – child concordance
Cronbach's alpha was employed to assess the reliability of the FADGFS child and parent reports. The obtained scale alphas of 0.89 and 0.88 for the child and parent samples, respectively, indicate high internal consistency among the scale items. Two procedures were used to compare parent and child ratings on the FAD-GFS. First, the correlation between parent and child scales was calculated, revealing a moderate concordance, r = 0.51, P < 0.001. Second, a paired t-test was used to detect differences between parent and child scores. No significant difference was found.
Comparison of FAD-GFS scores with normative data
Mean scores on the FAD-GFS were 2.12 (SD = 0.46) for parents and 2.10 (SD = 0.50) for children. The mean score obtained for parents in the Western Australia Child Health Survey [39, 40] was 1.75 (SD = 0.45). The results of an independent t-test indicate that the mean score for the community sample was significantly lower than the mean score for parents in this sample, t(2446) = 7.00, p < 0.0001. The number of families scoring in the clinical range in this sample was found to be significantly higher than the 12% in the clinical range reported in the Western Australia Child Health Survey [39, 40]. Using the clinical range cut-off point of 2, recommended by Miller et al. [32], 36 (62.1%) of the families scored within the clinical range according to the child scores, and 44 (61.1%) according to the parent scores. For the 58 families where both parent and child completed the FAD-GFS, 32 (55.2%) families scored above the cut-off point on both parent and child ratings, while 17 (29.3%) families scored below the cut-off point on parent and child ratings. Four (6.9%) families scored above the cutoff point on child ratings, but below on parent ratings, while another 5 (8.6%) families scored above on parent ratings but below the cut-off point on child ratings.
FAD-GFS scores, item profile and eating disorders diagnosis
Mean scores for each FAD-GFS items were calculated separately by diagnostic group, anorexia nervosa, EDNOS and bulimia nervosa. Differences among the diagnostic groups were examined using one-way analyses of variance. No significant differences were detected among diagnostic groups on either the child or parent scores.
The sample was then divided into those who restricted their food intake only and those who had experienced at least one binge-purge episode in the three months prior to assessment. FAD-GFS response profiles for each group are displayed for the patient responses in Figure 1 and the parent responses in Figure 2. Mean scores obtained by each group for each FAD-GFS item and the total scores were compared with independent t-tests. Significance levels were adjusted via the Bonferroni method to account for the multiple comparisons made. Total FAD-GFS scores did not differ significantly between the groups on either the patient or parent responses. However, the binge-purge patient group reported significantly greater difficulty in planning family activities, t(58) = 3.57, p < 0.05, and that members of their families experienced greater difficulty confiding in each other, t(41.9) = 2.30, p < 0.05, than did the restricted intake patient group.
Patient FAD-GFS mean scores. (♦, binge-purgers; █, restricted intake.) Parent FAD-GFS mean scores. (♦, binge-purgers; █, restricted intake.)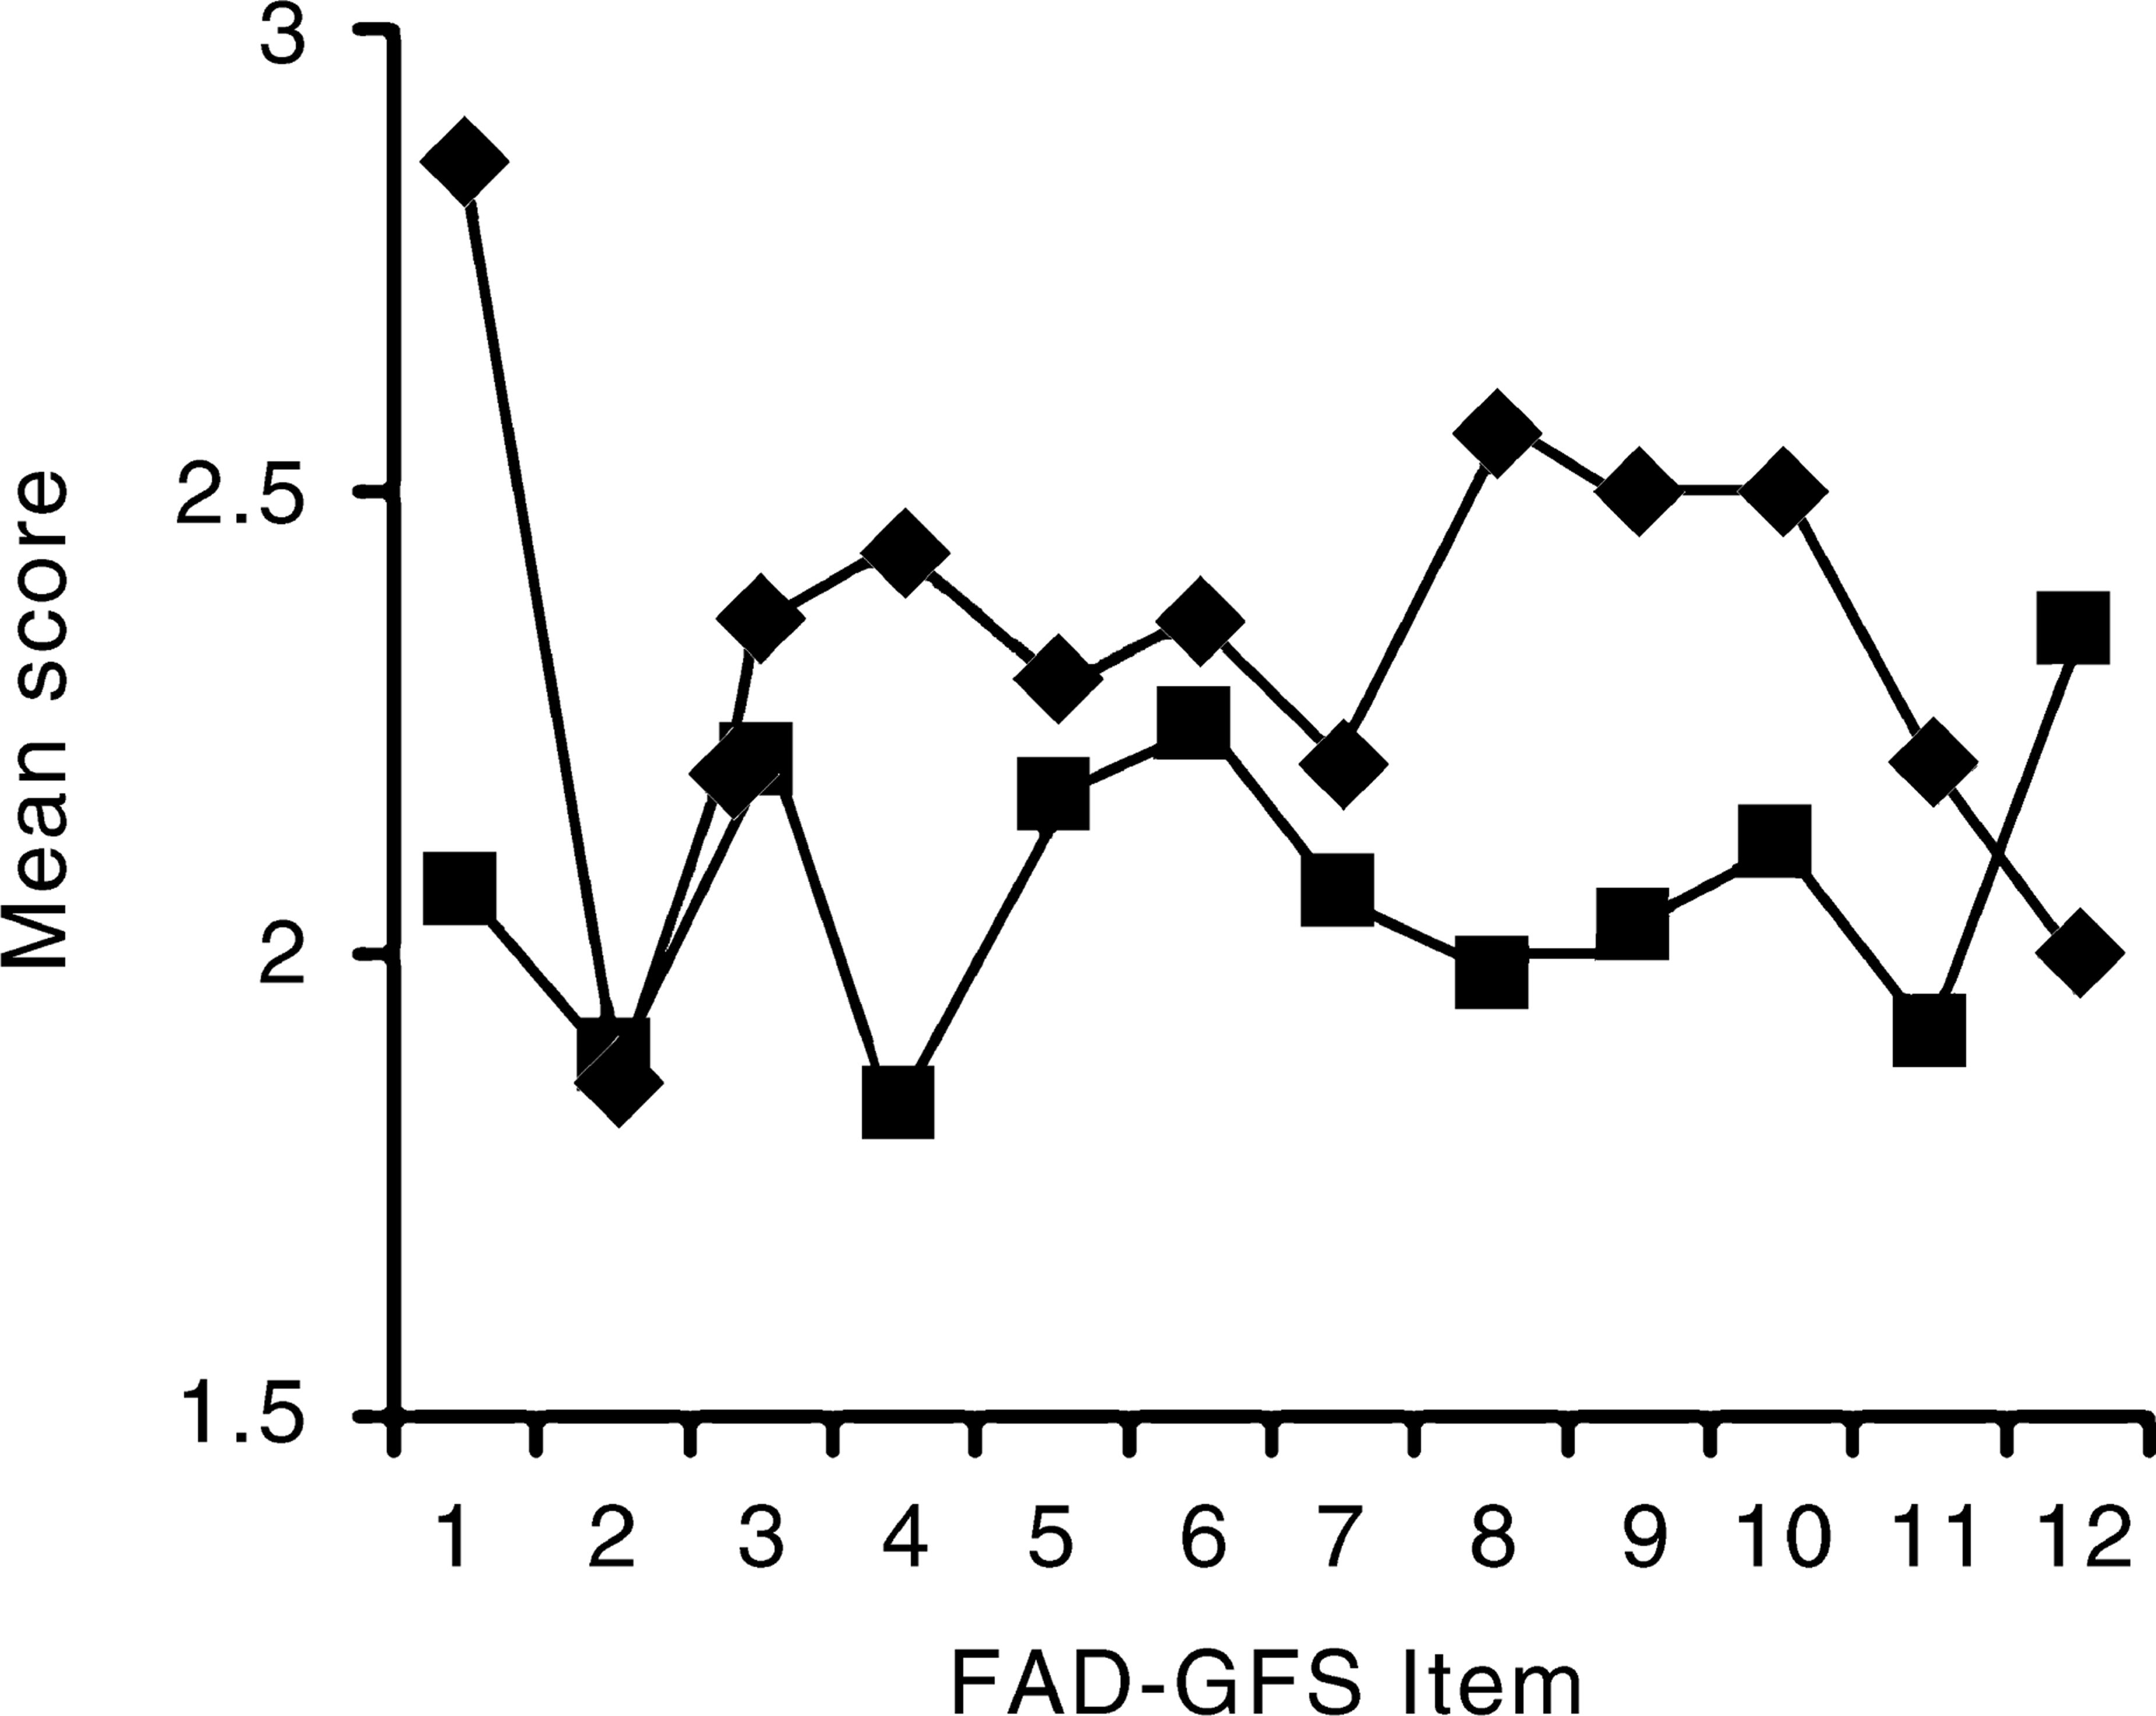
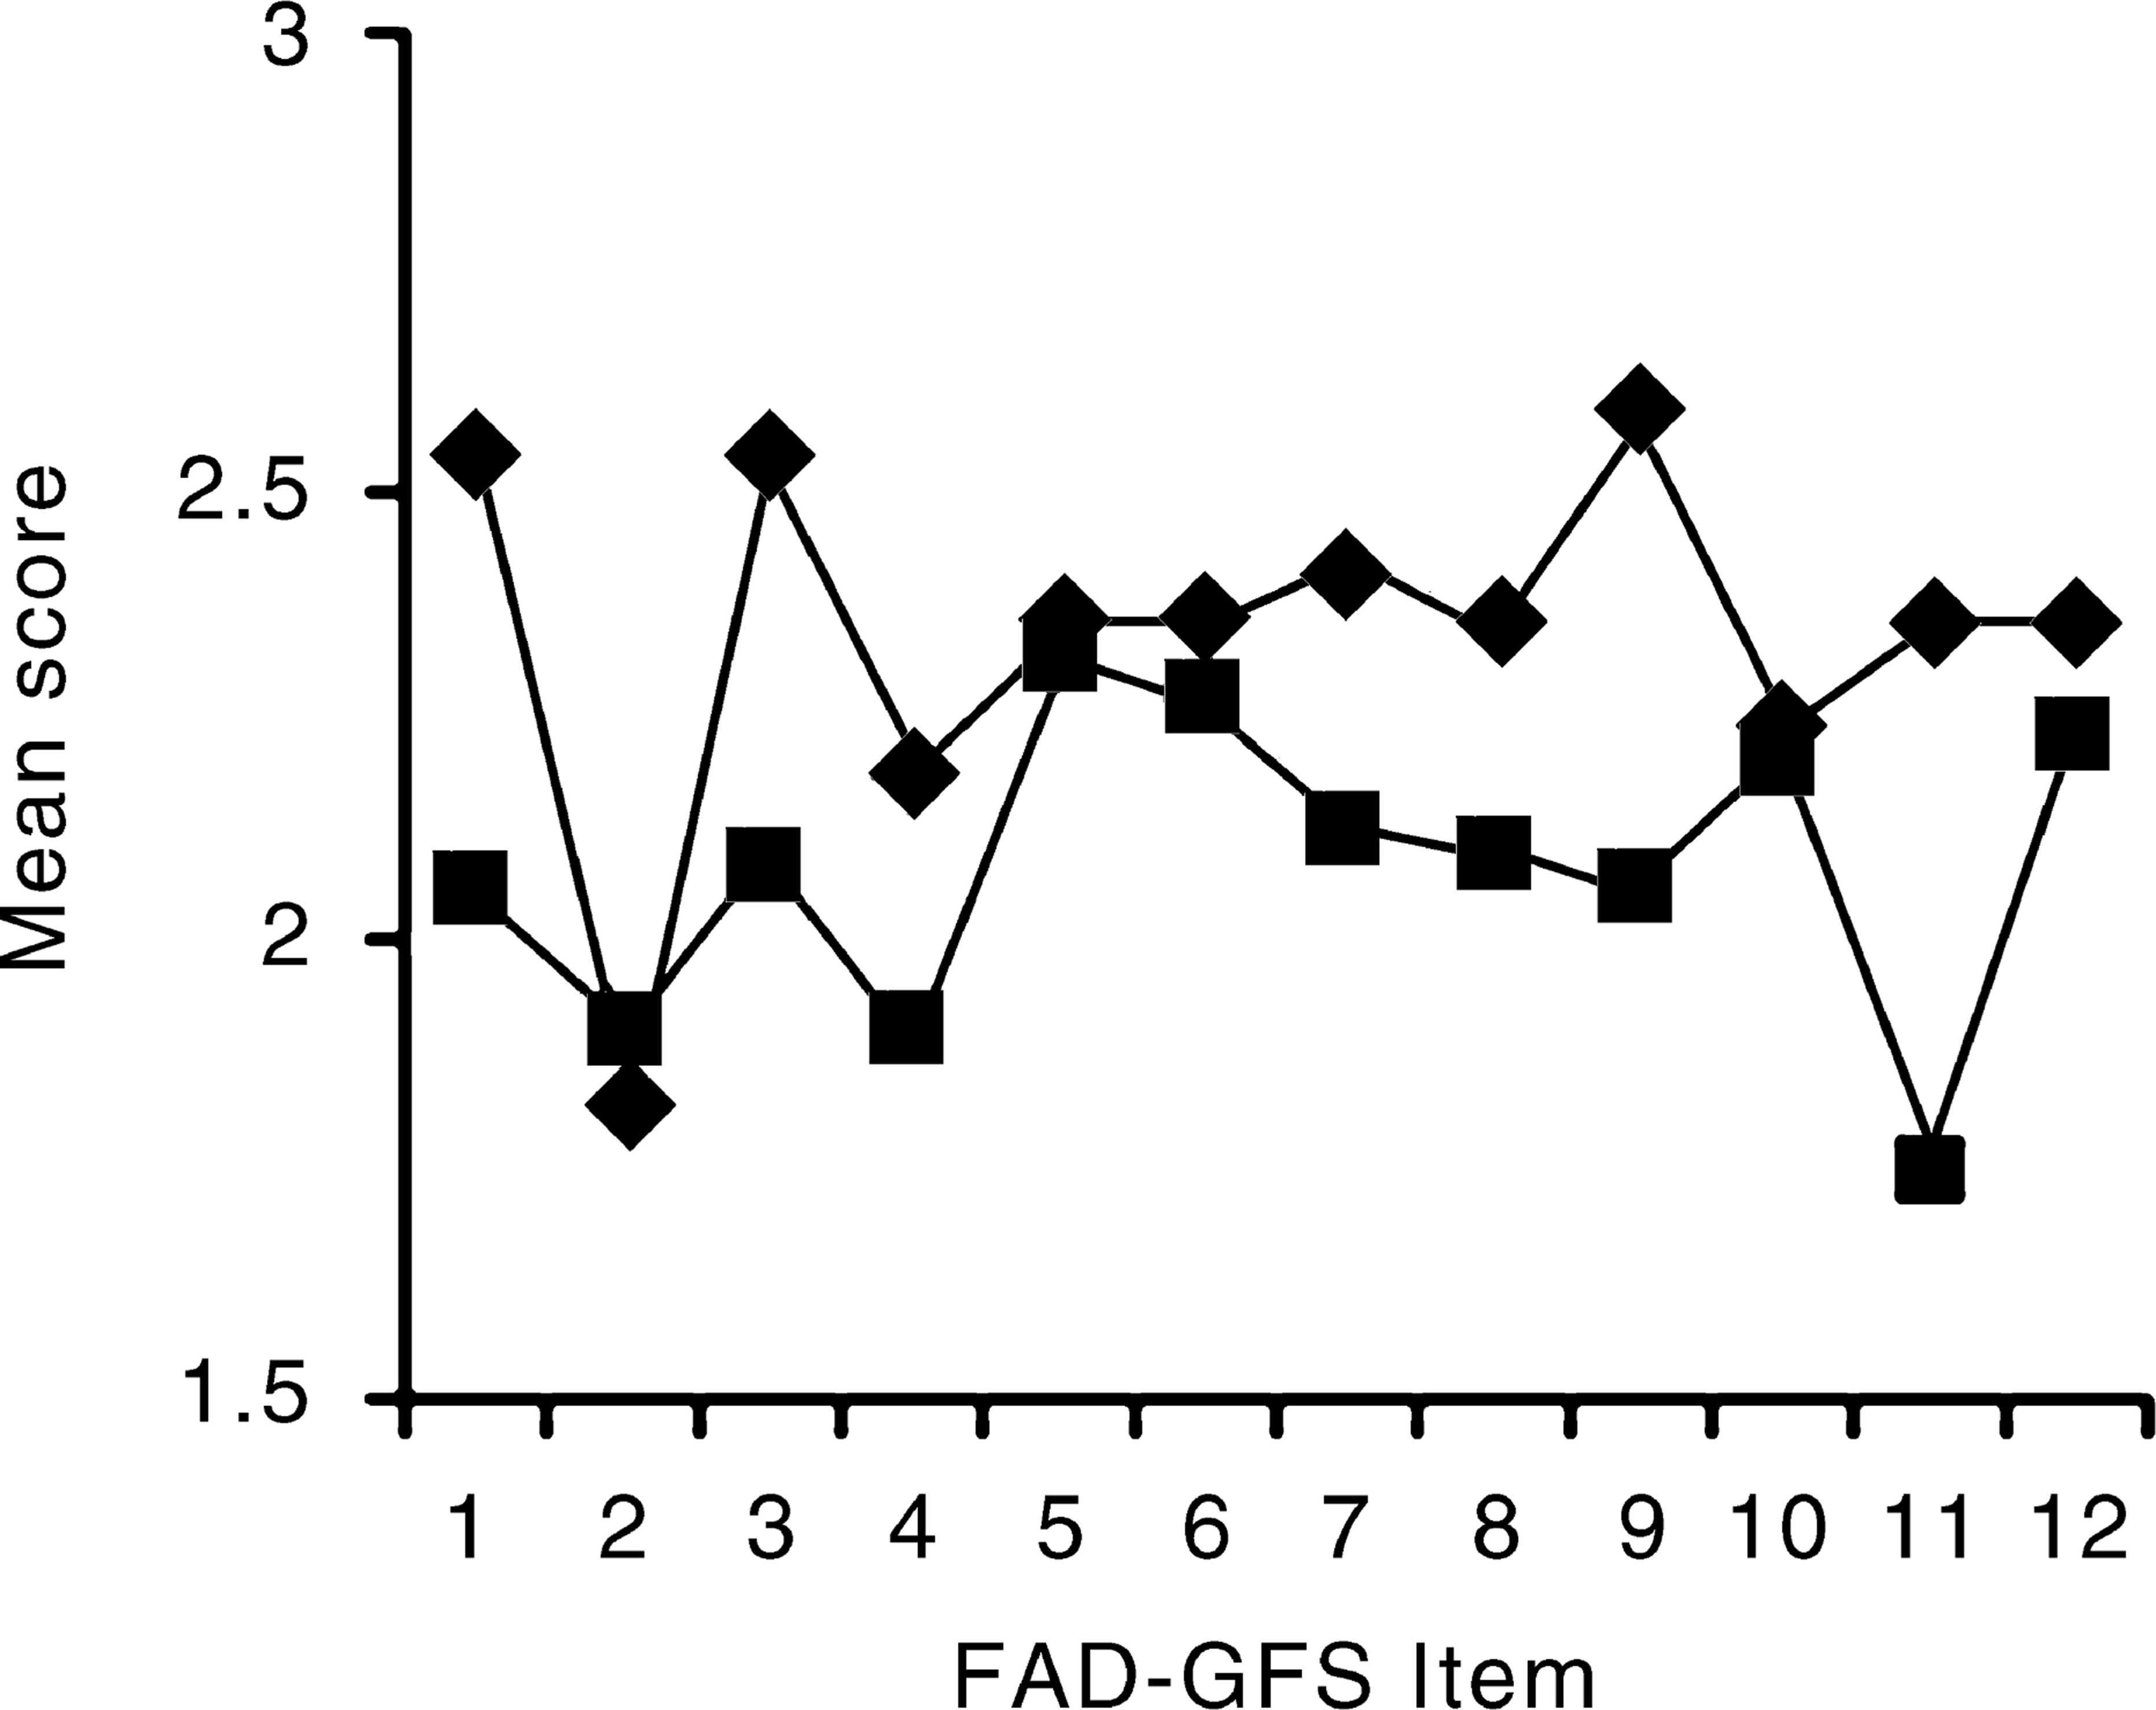
The parents of the binge-purge group reported that making decisions in their families was significantly more difficult, t(22.2) = 2.51, p < 0.05, and that family members got on less well with each other, t(65) = 2.87, p < 0.05, than did parents of the restricted intake group. It can also be noted from Figures 1 and 2 that the binge-purge group tended to consistently score higher on the FAD-GFS items on both patient and parent reports than did the restricting group.
Discussion
The psychometric suitability of the FAD-GFS for research purposes with children and adolescents diagnosed with an eating disorder was supported by the high internal consistency of the scale on both child and parent report. Consistent with the hypotheses, a moderate correlation between parent and child scores was obtained while no significance difference between parent and child scores was detected. The results also provide some support for the discriminant validity of the FAD-GFS.
Children with eating disorders and their parents reported higher levels of family dysfunction than did community norms, and a significantly larger percentage of these families than the community norm sample scored in the clinical range. More than 50% of families with a child with a diagnosed eating disorder were rated by at least one family member as dysfunctional.
Parent and child FAD-GFS scores did not distinguish among the families of those children and adolescents diagnosed with anorexia nervosa, EDNOS or bulimia nervosa, nor were there significant differences on child or parent total FAD-GFS scores between patients with restricting or binge-purge behaviours. However, the binge-purge children and adolescents report significantly greater difficulty with planning family activities and that family members experience greater difficulty confiding in each other, while their parents report significantly greater difficulties in making decisions in the family and that family members get on less well than is reported by children and parents in restricters’ families. These findings from both the parent and child perspective are consistent with published research which suggests that adult women with bulimia nervosa retrospectively perceive their families of origin not to have been cohesive and to have had high levels of family conflict [21].
While this cross-sectional research design cannot address the issue of causation, we suggest that families with a child diagnosed with anorexia nervosa may experience family conflict as secondary to concerns around the child's malnutrition, potential or actual hospitalization and other physical concomitants of anorexia nervosa. This distress may be heightened by habitual family patterns of interaction, which may include enmeshment, poor family affect regulation (including relative failure of appropriate emotional expression), and poor problem solving. We suggest that families of children diagnosed with bulimia nervosa may experience family conflict due to concomitant aspects of the child's behaviour, such as bingeing and self-induced vomiting, concurrent school refusal and relative school failure, drug and alcohol abuse, oppositional defiant behaviour, poor impulse control and self-harm. Such families may be capable of expressing emotion; however, such expression may not be regulated and could be prone to symmetrical patterns of escalating expressed emotion. Conversely, families with a child experiencing anorexia nervosa may have inhibited expression relative to the seriousness of their physical and psychological symptoms and impairment.
The FAD-GFS results reported here and our clinical impression of adverse family functioning in families with a child diagnosed with an eating disorder suggest further research in this area is warranted. The obtained internal consistency and discriminant validity confirm the results of earlier research and indicate that the FADGFS is a useful research instrument with eating disorders populations, primarily as a summary of family functioning, and that it can be employed with child and adolescent respondents. However, more detailed investigations of family functioning may warrant use of the full FAD, as family functioning differences between anorexia nervosa and bulimia nervosa diagnostic groups may be more readily identified with the communication, affective responsiveness and affective involvement scales. Differences in impulse regulation may also discriminate these diagnostic groups.