
Abstract
The information explosion in neuroscience has revealed a mosaic of details about how a single neurone (including synaptic receptor subtypes, membrane ion channels, molecular constituents and associated glia) might function. In comparison, fundamental data as to how the 10 billion neurons in the human brain function as an integrated system are scanty. Innovations over the past two decades in physics and computing technology have, however, provided a powerful means of exploring the structure and function of the brain using a range of computerised brain imaging technologies (BITs). Each BIT has a particular strength with respect to revealing structure or temporospatial aspects of function. These technologies offer the means to elucidate the patterns of pathophysiology underlying mental illness.
This overview serves to summarise briefly how these imaging technologies work, which ones are able to identify what neural networks are activated, and which highlight when network functions occur. A perfunctory overview would, however, omit a significant dimension: namely, what these measures mean and why we should be cautious about their simplistic use. Refinements to BIT methodologies are suggested, not only to get more out of the data, but also to limit the risk of overinterpretation.
Finally, and most importantly, the use of brain models across disciplines as the frame of reference for interpretation of BIT data is highlighted, and examples are provided to illustrate how they could both constrain and inform interpretation.
How brain imaging technologies work
Developments in physics have made accessible X-rays, radio waves and gamma rays which, coupled with computing power, provide the means to image data measured from the brain.
Brain imaging technologies provide detailed measures of brain structure and index complementary measures of when and where brain activity occurs. Computerised construction of the data allows the generation of two-dimensional (2-D) or three-dimensional (3-D) images. A brief description of each brain imaging technology is provided below.
Brain structure
In computerised tomography (CT), collimated beams of X-rays are rotated around the head and pass through the brain, losing energy in proportion to the density of the various tissues (grey, white matter, cerebrospinal fluid and the skull). Images of transverse brain slices are obtained.
Magnetic resonance imaging (MRI) activates (with brief radiofrequency pulses) the inherent distribution of hydrogen atoms in the brain, after they have aligned themselves in the extremely strong magnetic field generated by a superconducting magnet around the subject's head. The different re-alignment times (after the burst of radiofrequency perturbation) is longer in grey than in white matter (and is detected by radiofrequency receiver coils), which confers the exceptional grey and white matter contrast resolution. Transverse, coronal or sagittal images are generated. The advantages of MRI over CT include higher contrast among brain structures, arbitrary planes and the lack of ionising radiation.
Functional MRI (fMRI) measures stimulus-related changes in blood flow. Deoxyhaemoglobin is paramagnetic, resulting in local field distortions and low signal. With neuronal activation, relatively increased oxyhaemoglobin concentration results in enhanced signal changes in proportion to blood flow and blood volume. This technology brings together indices of high temporal and spatial resolution, such that patterns of functional brain activation are superimposed onto the structural MRI in the same individual.
Brain function
Electrical current and magnetic field activity
Electroencephalography (EEG) reflects populations of synchronised and desynchronised oscillations of the brain's ongoing electrical activity (mainly cortical dendritic activity). Electroencephalography bands (delta, theta, alpha, beta) provide an index of different levels of arousal and activation.
Event related potentials (ERPs) reflect averaged transient electrical potentials that are time-locked to the repeated presentation of discrete stimuli. Early ERP components reflect the integrity of sensory pathways (e.g. it takes 30 ms for the first five auditory ERP components to reflect activity in the acoustic nerve and brainstem nuclei). Later positive (P) or negative (N) ERPcomponents index aspects of preparatory activity (CNV), attention (N100), decision-making (P200), echoic memory (MMN), response activation (N200) and context (P300) of information processing, each within a fraction of a second.
Electroencephalography and ERPs are readily accessible and non-invasive, and measured using recording discs placed on the scalp (relative to a reference site on the head). The electrical currents measured are generated mainly perpendicular to the skull (gyri) and partially smeared by the resistive properties of skull and scalp.
The relative spatial (where) and temporal (when) resolutions of brain imaging technologies: CT, computerised tomography; MRI, magnetic resonance imaging; fMRI, functional MRI; EEG, electroencephalography; ERP, event related potentials; MEG, magnetoencephalography; SPECT, single photon emission computed tomography; PET, positron emission tomography.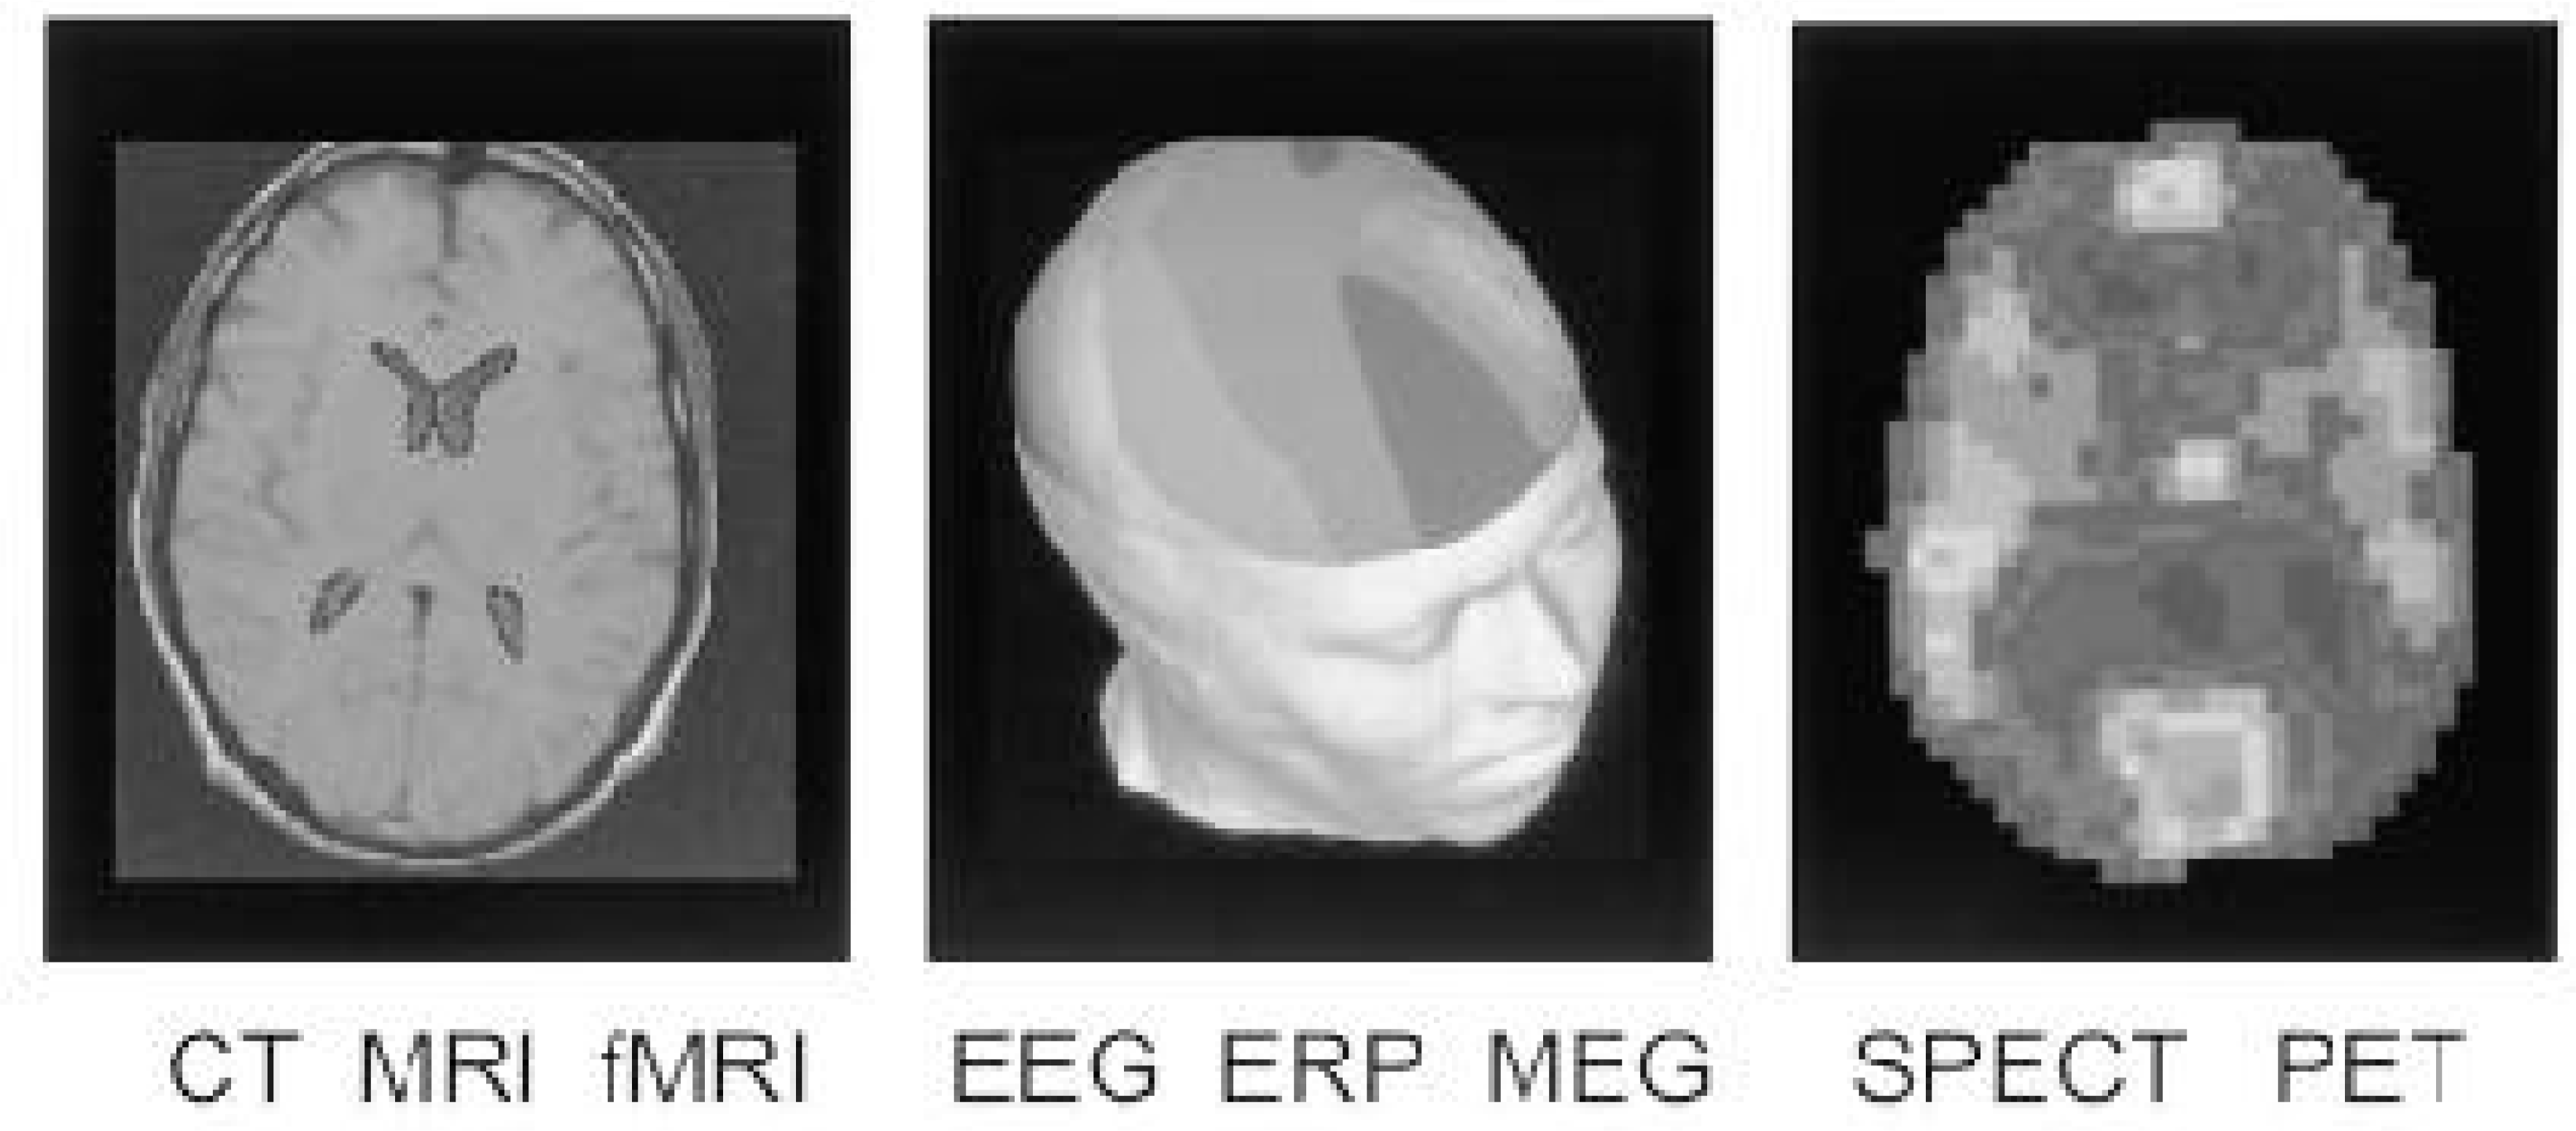
Magnetoencephalography (MEG) uses specialised superconducting detectors and sensing coils to measure magnetic fields that surround the currents that give rise to EEGs and ERPs. The magnetic fields mainly reflect currents induced within (the dendrites of) neurons orientated parallel to the skull (in sulci). This bias in favour of only some neurones may seem like a weakness, but it helps to determine source location and strength.
Perfusion, neurochemistry and drug action
Single photon emission computed tomography (SPECT) uses gamma-emitting radionuclides that are not normally metabolised in the brain (iodine, technetium and thallium) to label compounds reflecting blood flow, neurochemistry and drug activity (using specific receptor binding radioligands). The radionuclides are trapped in or on neurons within 2 min of injection intravenously. Single-, dual- or triple-headed detecting systems record from various positions around the head, and from this series of images a 3-D picture of activity is constructed. This technology is available in most departments of nuclear medicine.
Positron emission tomography (PET) uses positron-emitting isotopes of carbon, nitrogen, oxygen or fluorine which are incorporated into H2 O15, deoxyglucose (2-flouro-2-deoxyglucose), or any neurotransmitter, and so act as tracers of metabolic process or drug activity (including assessment of neuroreceptor number and affinity). Gamma rays are emitted in opposite directions at points of annihilation between positrons and electrons. Rings of gamma detectors around the head detect the coincidence of gamma activity and are processed to reveal slices of brain activity. Absolute measures of activity are derived (only relative measures are available with SPECT), but the relatively short half-life of positrons requires an on-site cyclotron (in contrast to long half-life SPECT radioisotopes which may be acquired from a distant site).
In summary, the quantities that can be imaged cover a wide range: physical quantities like electron and proton density in the case of CT and MRI, respectively, electrophysiological quantities in the case of EEG, MEG and ERPs, and metabolic quantities in the case of fMRI, SPECT and PET. Their usefulness is also a function of their characteristic spatial and temporal resolution. Generally speaking, structural images have the highest spatial resolution, while functional imaging systems have a trade-off between spatial and temporal resolution.
Brain imaging technologies are also distinguished by their degree of invasiveness: MRI, fMRI, EEG, ERP and MEG are non-invasive; whereas CT, SPECT and PET involve exposure to low dosage X-rays and radioactive material; and finally, they all suffer from artifacts of various kinds, such as noise, eye and body movement artifacts and signal distortion, some of which may be compensated. Figure 1 summaries the relative spatial and temporal resolution of these BITs, thereby highlighting their potential complementarity.
Clinical uses of brain imaging technologies
There are numerous encouraging outcomes from the application of BITs in psychiatry. These technologies are not diagnostic, but offer insights into patterns of dysfunction underlying illness. The structural technologies are primarily used to exclude a biological cause in cases in which a disorder is suspected. The functional technologies show the potential to delineate subgroups of patients (that may have different treatment outcomes) and evaluate objectively the effects of treatment on the brain as a system.
It is beyond the scope of this paper to review the findings across the spectrum of BITs in psychiatric disorders. Recent review articles distil BIT findings in the major psychiatric disorders [1, [2], [3], [4], [5], [6], [7], [8], [9], [10], [11], [12], [13], [14], [15], [16], [17], [18], [19], [20]]. What is, however, seldom emphasised are the inconsistencies, the lack of specifity of findings and the simplistic interpretation of the data.
Even cherished findings have chinks. For example, hypofrontality in schizophrenia ‘has achieved the status of a paradigm in schizophrenia’ [21]. Yet Gur and Gur [22] find no evidence of hypofrontality in medicated or unmedicated patients with schizophrenia. Their escape route and the ‘explanation’ of many other contradictory findings is to suggest that the finding might occur in a subtype (after emphasising its heterogeneity) and outlining paradigm differences between studies. Such ‘explanations’ could be true; equally likely is that the BIT tool or our analysis may be too blunt. We will not know unless we understand the measures more fundamentally. Another cherished notion is the valence laterality hypothesis (that the left hemisphere mediates positive emotions whereas the right mediates negative emotions), which also has contradictory findings [23]. In fact, inconsistent results have typified the BIT field.
Specificity has yet to be determined. For example, hypofrontality, decreased P300 amplitude and decreased hippocampal volume, have been found in Alzheimer's dementia, schizophrenia, depression, alcoholism and Parkinson's disease. Such disturbances may reflect general system shutdown as a consequence of chronic adaptive dysfunction, rather than specific abnormalities. There is also a paucity of findings in first presentation unmedicated patients, leaving open the possibility that medications are determining many BIT findings.
There are often various BIT disturbances in the same disorder. Broadbent [24] suggested that early stages of processing lead to downstream dysfunction; this needs to be examined in patients to distinguish cause from effect. The importance of focusing on such ‘brain dynamics’ is also unambiguously captured by the ‘kindling model’: that with successive clinical episodes of a disorder, there may be large non-linear changes in stability of brain function and effect of medication [25]. Considering different possible patterns of adaptive brain function over time is an important dimension in interpreting BIT measures.
In short, findings show potential utility, but a single measure in the complex trajectory of an illness, coupled with a lack of understanding of underlying mechanisms of brain dysfunction, limits the usefulness of these technologies. With this distinction in mind, I outline below trends that may enhance their use.
Using brain imaging technologies more confidently
The key caution is to avoid simplistic interpretation. Emerging approaches help to limit this possibility:
Replication of findings. Given the complexities, this should be undertaken at the individual and group level. Judicious combination of BITs to exploit their complementarity allows assessment of brain structure–function and temporospatial interrelationships in patients. Concurrent findings from different measures increase confidence in the coherence and validity of findings. Use of appropriately designed activation tasks should be tailored to engage selective networks considered to be dysfunctional in specific disorders. Researchers should be circumspect about subtraction studies (which subtract a baseline from an activation study and assume that the baseline functions remain the same in both studies). Even in simple tasks, adaptive brain function may change in multiple ways on two consecutive recording sessions. W h e n researchers report disturbances in specific ‘high level’ functions (such as memory, abstraction and planning) they need to check the possibility of an underlying ‘lower level’ dysfunction (such as arousal). An underutilised design is systematic levels of activation undertaken in the same subject (who acts as his own control), which allows many variabilities of between-subject studies to be avoided. Analysis of brain images with respect to large normative databases. Many BIT studies have used small numbers of subjects. Future studies are likely to include analysis of individual patients with respect to more controls. Databases are emerging worldwide. One example is the International Consortium for Brain Mapping [26]. In this database, the user can determine the probability and confidence limits of an individual patient's measures differing from averages obtained from controls. Such databases are, however, still in their infancy, with quality control and consistency of activation paradigms yet to be resolved. Ensure that performance has been controlled for. Many studies show that between-group differences in brain function are simply due to better performance in one group. The goal is to find network dysfunctions in psychiatric disorder that are not simply a consequence of differential motivation and performance by the subject, but due to disturbances in specific aspects of brain function. The same could be said for arousal, habituation and attention (you do not necessarily need a BITto show abnormal arousal, habituation, attention and performance per se since, electrodermal activity, eye movement and reaction time measures could in some cases be quite adequate and more cost effective). Beyond averaging. Most functional studies examine averaged function across the trial, a solid and appropriate first step. But systematic processes (such as learning, rapid automatic survival functions or more detailed slower processing) may vary systematically across the trial, providing complementary information to the average measure. Multidisciplinary approaches (mathematical, physiological and signal processing) will help to get more out of such data. For example, our group has extended approaches to examine the same data that are traditionally averaged, to derive a measure of its variability [27], subaverages based on performance [28], orienting to novelty [29, [30]], arousal [31], preparatory state [32] and a new measure of integrative brain function [33]. These approaches are relevant to all functional BIT data, to explicate imbalances such as excitation, inhibition, and neuronal network coupling. Specificity of findings needs to be explored. Sub-types of the disorder should be examined. Assessment of symptom profiles associated with BIT findings potentially provide further information. 10. Longitudinal examination of patients before and after treatment is the only way to ensure that findings are not affected by medication (or other forms of treatment). Examination of dose–response relationships, brain stimulation techniques, assessment of responders versus non-responders, covarying for gender, effects of medication, duration of illness and number of clinical episodes could all help to reveal distinctive patterns of brain dysfunction in psychiatric disorders.
Beyond computerised phrenology
There is no one-to-one relationship between one part of the brain and behaviour [34]. Much BIT data is presented in ‘localisationist’, reductionist terms. Beware of brain scientists bearing localisationist colour images of the brain! While these are seductive, interpretation should be couched in the context of the aforementioned recommendations, coupled with an understanding of anatomical connectivity, mechanisms of brain electrochemistry and organisation of brain function (which goes way beyond the platitudes that many regions in the brain are interconnected and interact).
This is not to detract from the fact that a localisationist model has been useful in specific circumstances (e.g. to study sensory, motor and speech networks). Many pioneers of BIT research in psychiatry carved out their reputations on measures of sensory–motor or speech networks, but entered research into disturbances of association cortex, with appropriate trepidation.
We need to remember when examining whole brain imaging measures that specialised sensory–motor networks constitute only a small percentage of the brain. While we do not yet know the mechanisms of mind that integrate network function, we know that of the total hominid brain size that has trebled over six million years (from Australopithecus to Homo habilis,erectus and sapiens), most of this increase has been in the association cortices [35]. Jackson [36] suggested that recently evolved networks are likely to be most unstable and prone to dysfunction. In addition, a key brain feature is its interconnected nature, all of which demand a system-based, holistic approach. This should integrate local-isationist and distributed dynamical approaches, since they readily coexist. The basic point is that there are theoretical insights that a clinician can use to interpret BIT findings beyond simplistic localisations.
Current conceptualisations of brain function suggest that rather than being modular, serial and hierarchical, it is better characterised as continuous interaction across scale, between some localised and many distributed neural networks, engaged according to situation and task demands. Likewise, behaviour is increasingly thought to result from parallel and coupled synchronous processing among multiple neuronal networks. Behaviour would, therefore, be associated with many networks rather than specific anatomical sites.
A dichotomy between reductionism and holism has a long and enduring history in science and medicine (beyond the scope of this paper). A reductionistic approach has resulted in many details as to how a neurone functions. While details at this scale continue to provide insights into the microscopic aspects of brain dysfunction, advances in holistic approaches, such as systems theory, allow examination of the effects of the brain as a dynamic, adaptive system. More importantly, reductionistic and holistic models are increasingly seen to not be mutually exclusive, but to readily coexist. Theories that accommodate this coexistence are becoming more prevalent in the scientific literature.
Systems theory has a rich and all-too-often ignored history. It is achieving advances due to multidisciplinary collaboration. Of relevance to explicating BIT data is that different mechanisms may operate at different scales of function. In addition, simple rules may underlie complex patterns of brain imaging data. Examples of system theory of complex dynamical systems include: cybernetics, which led to concepts of feedback loops and self-organisation [37]; general systems theory [38]; mathematics of complexity and dynamical systems theory [39]; the Santiago theory (interdependence of structure and process of mind) [40]; order at the edge of chaos, with natural selection possibly favouring enhanced flexibility of systems lying at the edge of chaos [41]; dynamics of state transitions and basins of neural network attractors underlying all brain functions [42].
Brain imaging technologies reveal aspects of whole brain structure, large-scale electrical activity and metabolism. But for all their power and diversity, they do not image all elements of cognition. The theoretical foundations outlined above help to determine the context of BIT findings. Models (discussed below) explicate their content.
The final step in interpreting BIT measures is to ask what they mean. A simple analogy involves the weather. Elements of weather patterns such as cloud cover, periodicity and duration of storms can be obtained from satellite photographs and ground measures, but they do not reveal causal mechanisms across scale underlying these storms; these have been derived from theoretical and experimental physics, and from testing interactive mechanisms in models. Similarly, in the brain, mechanisms of function need to be examined in models.
‘Show me the model$’
Brain science is awash with BIT information about what the brain ‘does’. However, it is short on conceptual foundations with which to interpret data, or distinguish causality from coincidence. New findings are of little value if they lead recursively back to what we think we know. In human brain science, models are the only way to capture the essence of the mass of BIT findings and to determine their possible interactions explicitly.
The goodness of fit between predictions of a theoretical model and BIT data increase or decrease the likelihood of the model's veracity. Comparison with experimental data is the final arbiter of the validity of any model. Interactive refinement or elimination of a model allows a ‘survival of the fittest’ approach. Brain imaging technology measures need to be interpreted in the context of prevailing models across disciplines.
This is not easy. But given the complexity, anything less is myopic. Nor is this to suggest that the starting point for exploring BIT data should not be derived from a single model in a single disorder. Instead, a full exploration of the possible meaning of BIT data might benefit from insights provided by complementary models. It also limits ascribing causality to correlated results prematurely.
The examples in Fig. 2 demonstrate a frame of reference, using commonly cited models in the BIT literature. As shown in Fig. 2(a), Luria's top-down model [43], outlines the overall functional organisation of the brain. Luria suggested three interacting networks: one regulating tone, a hierarchically organised sensory–motor network, and a frontal lobe (‘superstructure’) verifying and planning goal-directed behaviour. Considerable BIT data have drawn upon this model to focus on disturbances of ‘executive frontal lobe functions’ and lateralisation, but with little emphasis on its dynamic ‘interacting systems’ dimension. Adding timing and neurotransmitter distributions provides a useful starting point to interpret BIT measures.
Figure 2(b) shows neurology models which focus on sensory–motor networks. Alexander etal. [44] highlight parallel networks beginning in the cortex, funnelling through basal ganglia to the thalamus, with feedback from the thalamus to single areas of cortex. Brain imaging technology dysfunctions have been found in each of these networks in neuropsychiatric disorders. Alimit of this model is that it is anatomical, although it can be readily linked to more physiological models.
Across-discipline examples of interrelated models used to interpret brain imaging technology findings in psychiatry: (a) psychology; (b) neurology; (c) neuroscience; (d) psychophysiology.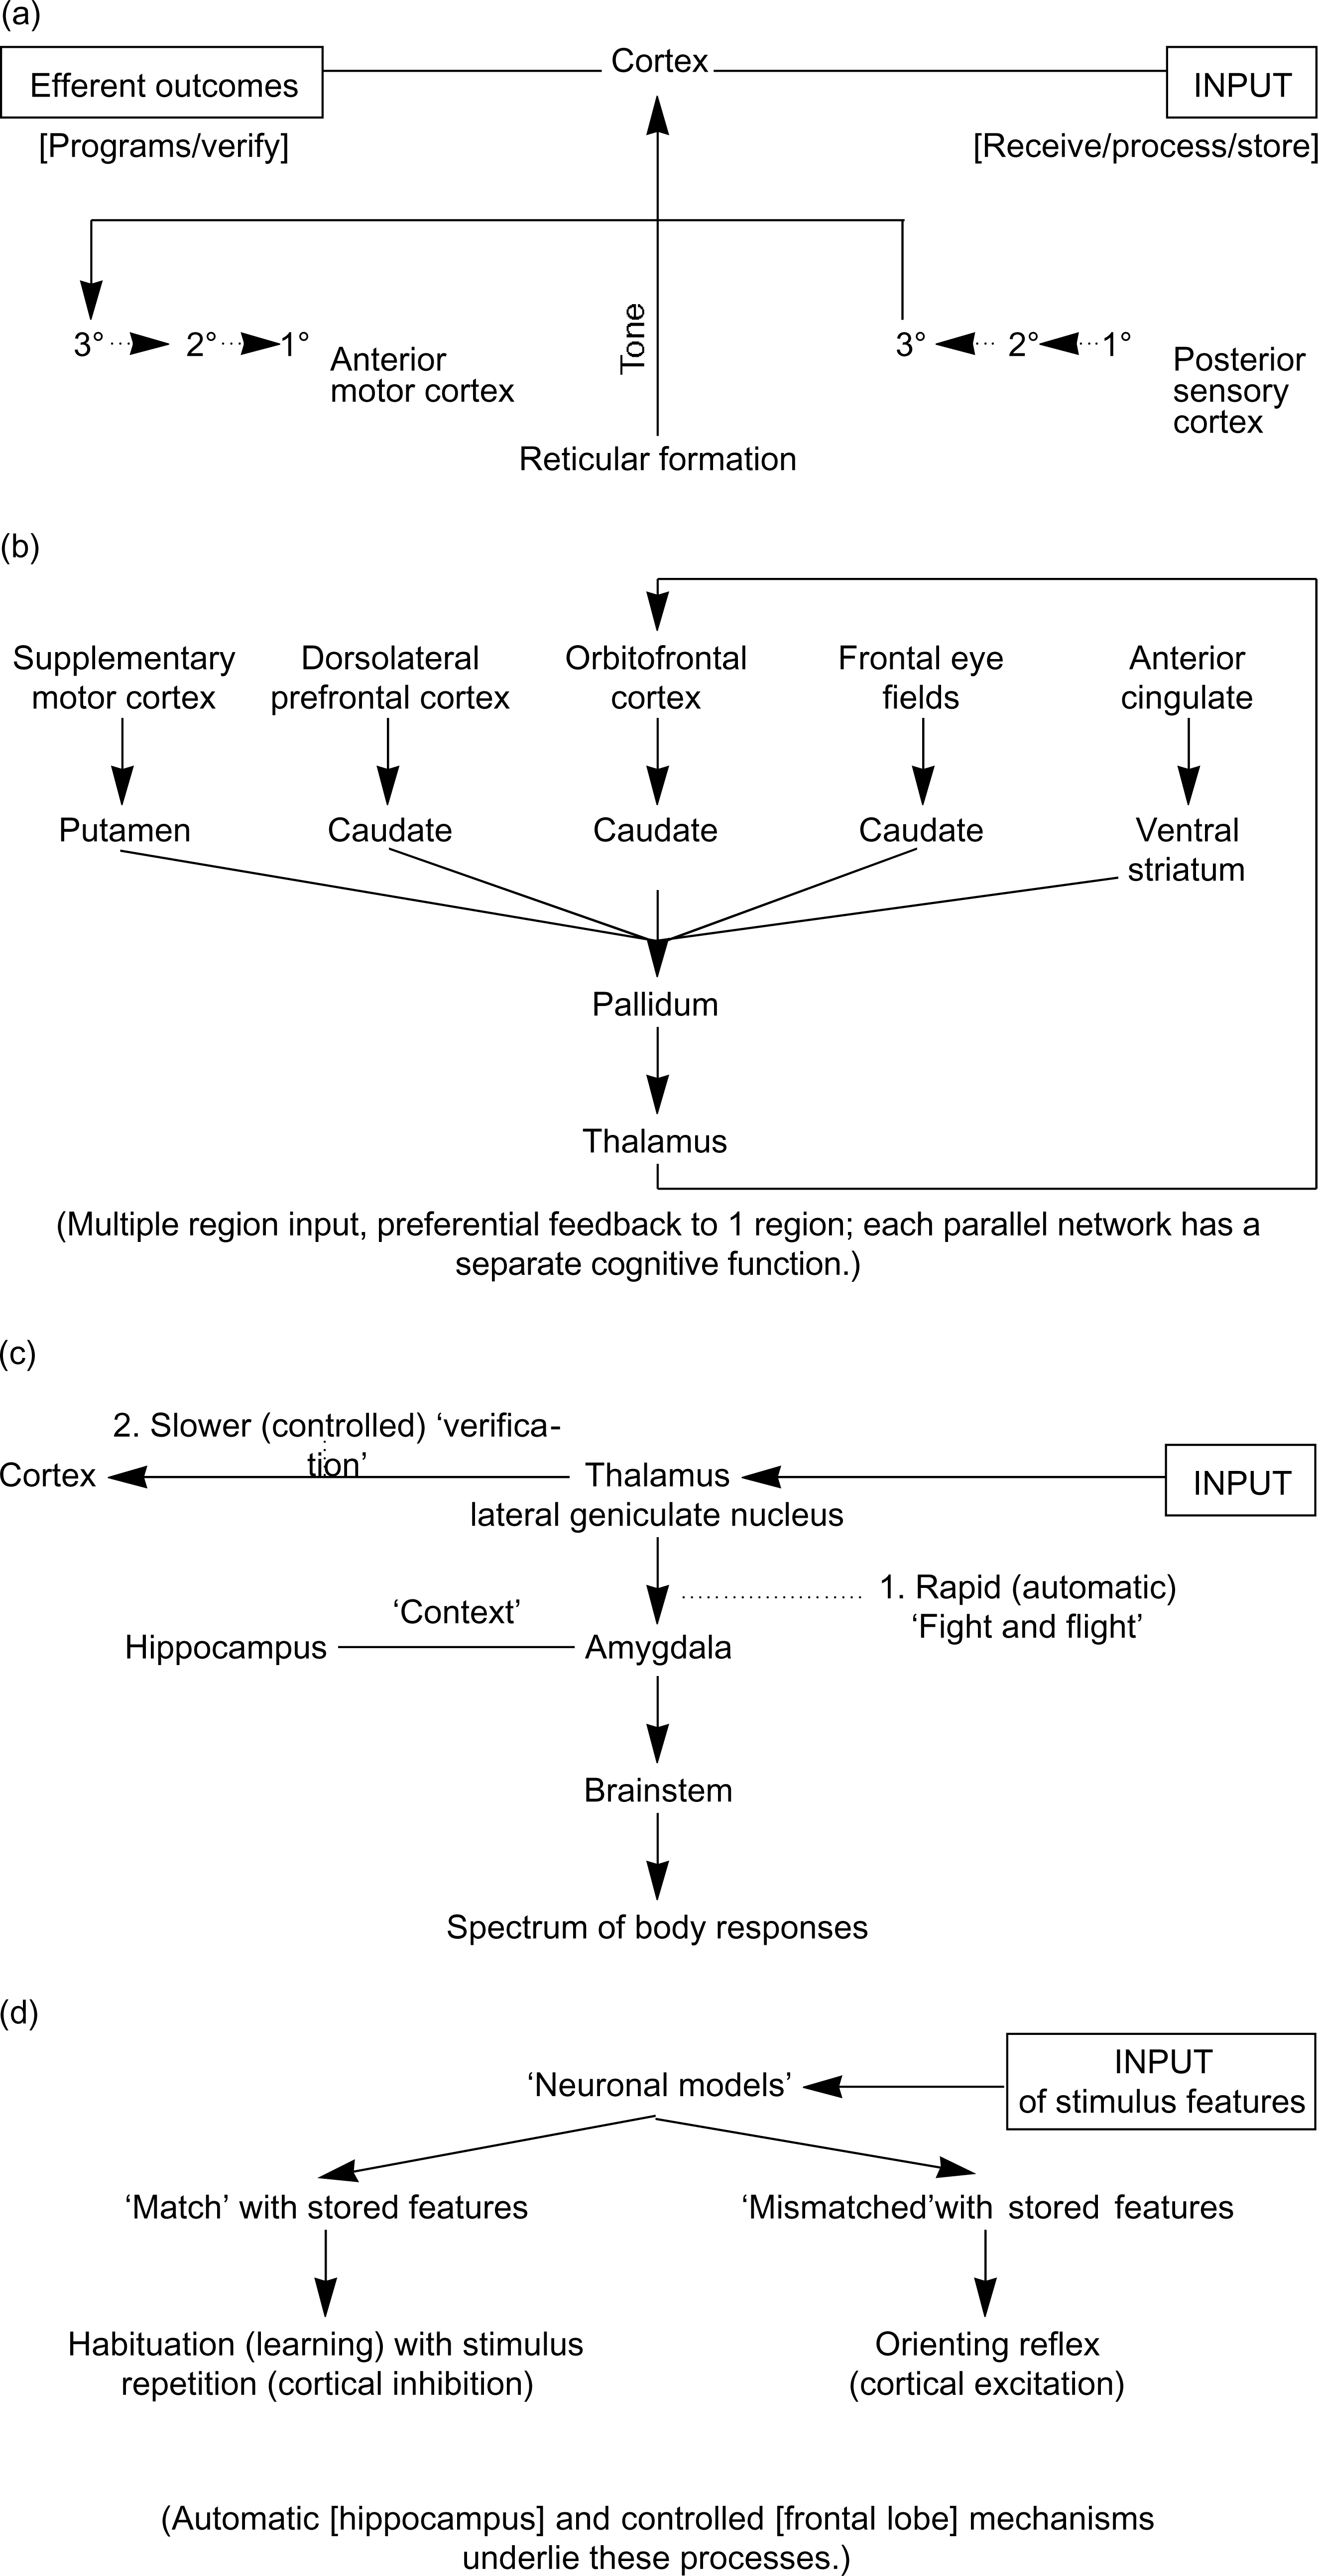
Bottom-up basic neuroscience models such as Le Doux's in Fig. 2(c) [45], reveal mechanisms underlying fear conditioning in animals (generated via the amygdala), and this has been extended into models of posttraumatic stress disorder and other trauma-related disorders. A more general perspective for BITs from this model, is the ‘situation and task specific’ nature of brain networks. For example, early processing of fear-related information does not initially involve the cortex (signals go from the retina to the lateral geniculate nucleus [LGN], to the amygdala, triggering the automatic ‘fight and flight’ response). In parallel, activation from the LGN to the cortex occurs for ‘verification’ of the situation's details.
In Fig. 2(d), Sokolov's psychophysiological models [46, [47]] highlight the significance of the ‘orienting reflex’ and its habituation (the most ubiquitous form of learning in the brain) and interactive links with body functions. Of relevance to psychiatry, for example, are models of disturbed inhibition in anxiety, and misattributions in schizophrenia, and evidence that even high level processes such as reason and emotion involve the body's autonomic functions in their generation [48].
Models across disciplines therefore focus on different scales of function and different processes. However, despite our level of ignorance about the workings of the brain, when one puts together mainstream models across disciplines, a discernible integrated outline of an adaptive system emerges, from which to interpret BIT data.
Such an integration of biological and psychological models should ultimately be considered in conjunction with computational models that focus on the key dimension of the brain, timing and brain dynamics. For example, Churchland and Segjnowski [49] and Amit [50] use artificial neural networks that incorporate biological parameters, to explore interactions among neurones and how they learn and remember. Freeman [42] emphasises the dynamic (including nonlinear) interactions of brain functions, and suggests ways in which preferred network modes (‘basins of attraction’) shape goal-orientated behaviour. Wright and Kydd [51] proposed the notion of different patterns of ‘brain instabilities’ in specific disorders. Their simulations [52] examine interactions among fields of neurones with ‘realistic’ variables (such as synaptic densities, axonal conduction velocities and neuro-transmitter functions), that explain frequency content of the major cerebral rhythms and synchronous oscillation (possibly reflecting integrative processing). Their key innovation is the models’ numerical character, so that simulations can be matched with real data and discrepancies explored interactively by changing specific variables. Such numerical models permit exploring the meaning of BIT measures (in this case EEG and ERPs), and they act as exemplars linking basic science models to BIT measures.
There is increasing multidisciplinary involvement in the field of BITs. This is the most effective way to bring complementary models together across disciplines so as to evaluate the fundamental meaning of BIT data.
Conclusion
Some psychiatrists are surprised by the lack of ‘clinically useful’ BIT findings. This is an appropriate stance but it is due to the preliminary nature of the use of BITs and the rudimentary understanding of what they mean. Other psychiatrists bemuse what little surprise it is that such expensive BIT measures ‘show that something is wrong with the brain's of patients with psychiatric disorders’; this perspective fails to grasp the unprecedented scale at which scientists are exploring mechanisms of dysfunction.
The multidisciplinary use of BITs in psychiatry is no passing fashion. Tomorrow's psychiatrists should refine their skills in scientific method and critical analysis, expand their knowledge of neuroscience, and integrate aspects of psychology and biology. Judiciously employed and well-modelled BIT measures will be a significant part of the landscape.
Brain imaging technologies already show much utility in delineating subgroups of patients and evaluating effects of medication on the brain. But we barely scratch the surface of this potential. The innovation of the technologies still outstrips the sophistication of their use. But in this emerging era of ‘integrative neuroscience’ [53], we will see an increasing number of multimodal findings that are replicated in large samples, and modelled to explore the fundamental mechanisms and meaning of BIT data. These outcomes will change the nature and practice of psychiatry.
Footnotes
Acknowledgements
I would like to thank Chris Rennie and all collaborators of the Brain Dynamics Center.