
Abstract
Besides the newly developed positron emission tomography scanners (microPET) dedicated to the in vivo functional study of small animals, autoradiography remains the reference technique widely used for functional brain imaging and the gold standard for the validation of in vivo results. The analysis of autoradiographic data is classically achieved in two dimensions (2D) using a section-by-section approach, is often limited to few sections and the delineation of the regions of interest to be analysed is directly performed on autoradiographic sections. In addition, such approach of analysis does not accommodate the possible anatomical shifts linked to dissymmetry associated with the sectioning process. This classic analysis is time-consuming, operator-dependent and can therefore lead to non-objective and non-reproducible results. In this paper, we have developed an automated and generic toolbox for processing of autoradiographic and corresponding histological rat brain sections based on a three-step approach, which involves: (1) an optimized digitization dealing with hundreds of autoradiographic and histological sections; (2) a robust reconstruction of the volumes based on a reliable registration method; and (3) an original 3D-geometry-based approach to analysis of anatomical and functional post-mortem data. The integration of the toolbox under a unified environment (in-house software BrainVISA, http://brainvisa.info) with a graphic interface enabled a robust and operator-independent exploitation of the overall anatomical and functional information. We illustrated the substantial qualitative and quantitative benefits obtained by applying our methodology to an activation study (rats, n = 5, under unilateral visual stimulation).
Introduction
The recent development of dedicated small animal positron emission tomography scanners (microPET) has opened up the possibility of performing repeated functional in vivo studies in the same animal: longitudinal follow-up of cerebral glucose metabolism and cerebral blood flow; studies on protein synthesis under different conditions; and investigation of the neurotransmission processes (Araujo et al, 2000; Aznavour et al, 2006). However, these systems still suffer technical limitations including a limited sensitivity and a reduced spatial resolution (~2–3 mm) compared with autoradiography (~100–200 μm). Therefore, the resolution of PET scanning relatively to the size of rodent brain structures is not sufficient to avoid including tissues with different rates of blood flow and metabolism within a single voxel or region of interest. Conventional autoradiography images are therefore generally required to compare and validate in vivo functional results obtained with small-animal PET imaging and microPET technology (Thanos et al, 2002; Toyama et al, 2004; Schmidt and Smith, 2005). Additionally, the cost of a PET system permits only a few laboratories to be equipped with them. Hence, autoradiography remains the reference and widely used technique for functional brain imaging in small animal research.
The major disadvantage of autoradiography is that an animal can only be studied once. Longitudinal studies require the use of multiple animals, adding inter-animal variability to other sources of variability. Another significant disadvantage is that autoradiography requires brain tissue sectioning, entailing the production of up to several hundreds of serial sections and the inherent loss of the three-dimensional (3D) spatial consistency. Autoradiographic data are traditionally analyzed in two dimensions (2D) using a limited number of sections and a part of the functional information is therefore not exploited. In addition, depending on the orientation of the cutting plane relative to the anteroposterior and mediolateral axes, the symmetry in the brain could have been lost during sectioning, as could section-by-section anatomical correspondence between the right and left hemispheres. This is of great importance when the analysis involves a comparison between both hemispheres, because the 2D section-by-section approach can result in bias if the user does not take the possible dissymmetry in the sections into account, especially with small regions of interest. Finally, although the users have the corresponding post-mortem histological stained sections available to consider anatomical information, the delineation of the regions of interest to be analyzed is usually directly performed on the autoradiographic sections, which is operator-dependent and may not be accurate.
To extract maximum functional information from the overall autoradiographic brain sections in their 3D geometrically consistent alignment, a reliable 3D reconstruction of the data is essential. Many methods have been proposed to align 2D histological or autoradiographic sections into a 3D volume. They include fiducial marker or artificial landmark-based methods (Toga and Arnicar, 1985; Goldszal et al, 1995; Hess et al, 1998); principal axes alignment (Hibbard and Hawkins, 1988; Hess et al, 1998); feature-based methods, using contours, crest lines, or characteristic points extracted from the images (Hibbard and Hawkins, 1988; Zhao et al, 1995; Rangarajan et al, 1997); and gray level-based registration techniques using the intensities of the whole image, through similarity or correlation functions (Andreasen et al, 1992; Zhao et al, 1995; Kim et al, 1997; Hess et al, 1998; Ourselin et al, 2001). To be relevant, the functional information has to be compared and correlated to the corresponding anatomical information, as in human brain studies. However, few of these works have specifically addressed the co-registration of biologic images obtained from different techniques, for example histology and autoradiography (Humm et al, 2003). Lastly, despite the fact that automated 3D reconstruction tools based on some of these registration methods become more widely available (Diaspro et al, 1990; Lohmann et al, 1998; Thevenaz et al, 1998; NIH-Image, National Institutes of Health, USA; MacPhase, Otter Solution, Whitesboro, NY, USA; VoxelView, Vital Images, Fairfield, IA, USA; 3D-BrainStation, Loats Associates, Westminster, MD, USA; and SURFdriver, Kailua, HI, USA), generic and reliable algorithms are still needed both for digitization of large numbers of sections and also for automated analysis taking advantage of 3D anatomo-functional reconstruction and allowing for dissymmetry correction in the sections.
In this paper, we have developed an automated and generic toolbox for processing of autoradiographic and histological rat brain sections. This toolbox is based on a three-step approach whose strengths are: (1) an optimized data acquisition from large numbers of serial histological and autoradiographic sections (several thousands of sections obtained from several brains); (2) a reliable 3D reconstruction of the volumes using an adapted registration method. This method is based on an original strategy involving accurate reconstruction of both the anatomical volume and the functional volume by co-registration of each autoradiographic section to the corresponding registered histological section; and (3) a novel approach for the analysis of functional post-mortem data exploiting the overall restored 3D geometry. We specifically applied the overall methodology for the characterization of the metabolic changes throughout the visual system (visual cortex (VC), superior colliculus (SC), and lateral geniculate nucleus (LGN)) in lightly restrained awake rats during unilateral stimulation. Since the rat's chiasm is approximately 90% crossed (Jeffery, 1984), this allowed comparison of stimulated versus unstimulated visual system in the same animal.
Materials and methods
Visual Stimulation and Measurement of Local Cerebral Metabolic Rate of Glucose
Autoradiographic and histological data sets used in this work were obtained during a previously described activation study (Herard et al, 2005). This previous study aimed at measuring the cerebral metabolic rate of glucose (CMRGlu) using the [14C]-2-deoxyglucose autoradiographic method (Sokoloff, 1977) in the SC of adult rats under a complex visual stimulation (n = 5) in which the left eye was left opened (stimulated) and the right eye was closed with an opaque adhesive tape (unstimulated). In the present work, we have gone further into the analysis of the SC data and the visual system by including analysis of the metabolic responses within the VC and the LGN. A complete and detailed description of the experimental protocol is presented in Herard et al (2005). Coronal brain sections (approximately 150 per animal, 20-μm thick) were cut with a cryostat at −20°C, mounted on SuperFrost glass slides, rapidly heat dried, and exposed for 5 days to an autoradiographic film (Kodak BioMax MR, Perkin Elmer, Massy, France) along with radioactive [14C] standards (146C, American Radiochemical Company, St Louis, MO, USA). The same brain sections were then stained with cresyl violet (Nissl stain) to provide complementary anatomical information.
Optimized Data Acquisition: Digitization and Extraction of Sections from Scans
The autoradiographs, the corresponding histological section sets and the [14C] standards were digitized as 8-bit gray-scale images with a flatbed scanner (ImageScanner, GE Healthcare Europe, Orsay, France). In-plane digitization resolution needed to be sufficiently high to reveal the main structures of interest in the brain: we chose a 600 dpi resolution (pixel size 42 × 42 μm2), in view of the size of the rat brain. The autoradiographic and histological sections were acquired and stored under the form of glass slide column images called ‘overall scans’ and whose size was given by the scanner's field of view (Figure 1A). Thus, for a data set including approximately 150 sections, only five or six columns were needed for each of the two post-mortem imaging techniques (autoradiography and histology). The calibration scale available with the scanner gave the relation between optical density and gray level values in the autoradiographic images.
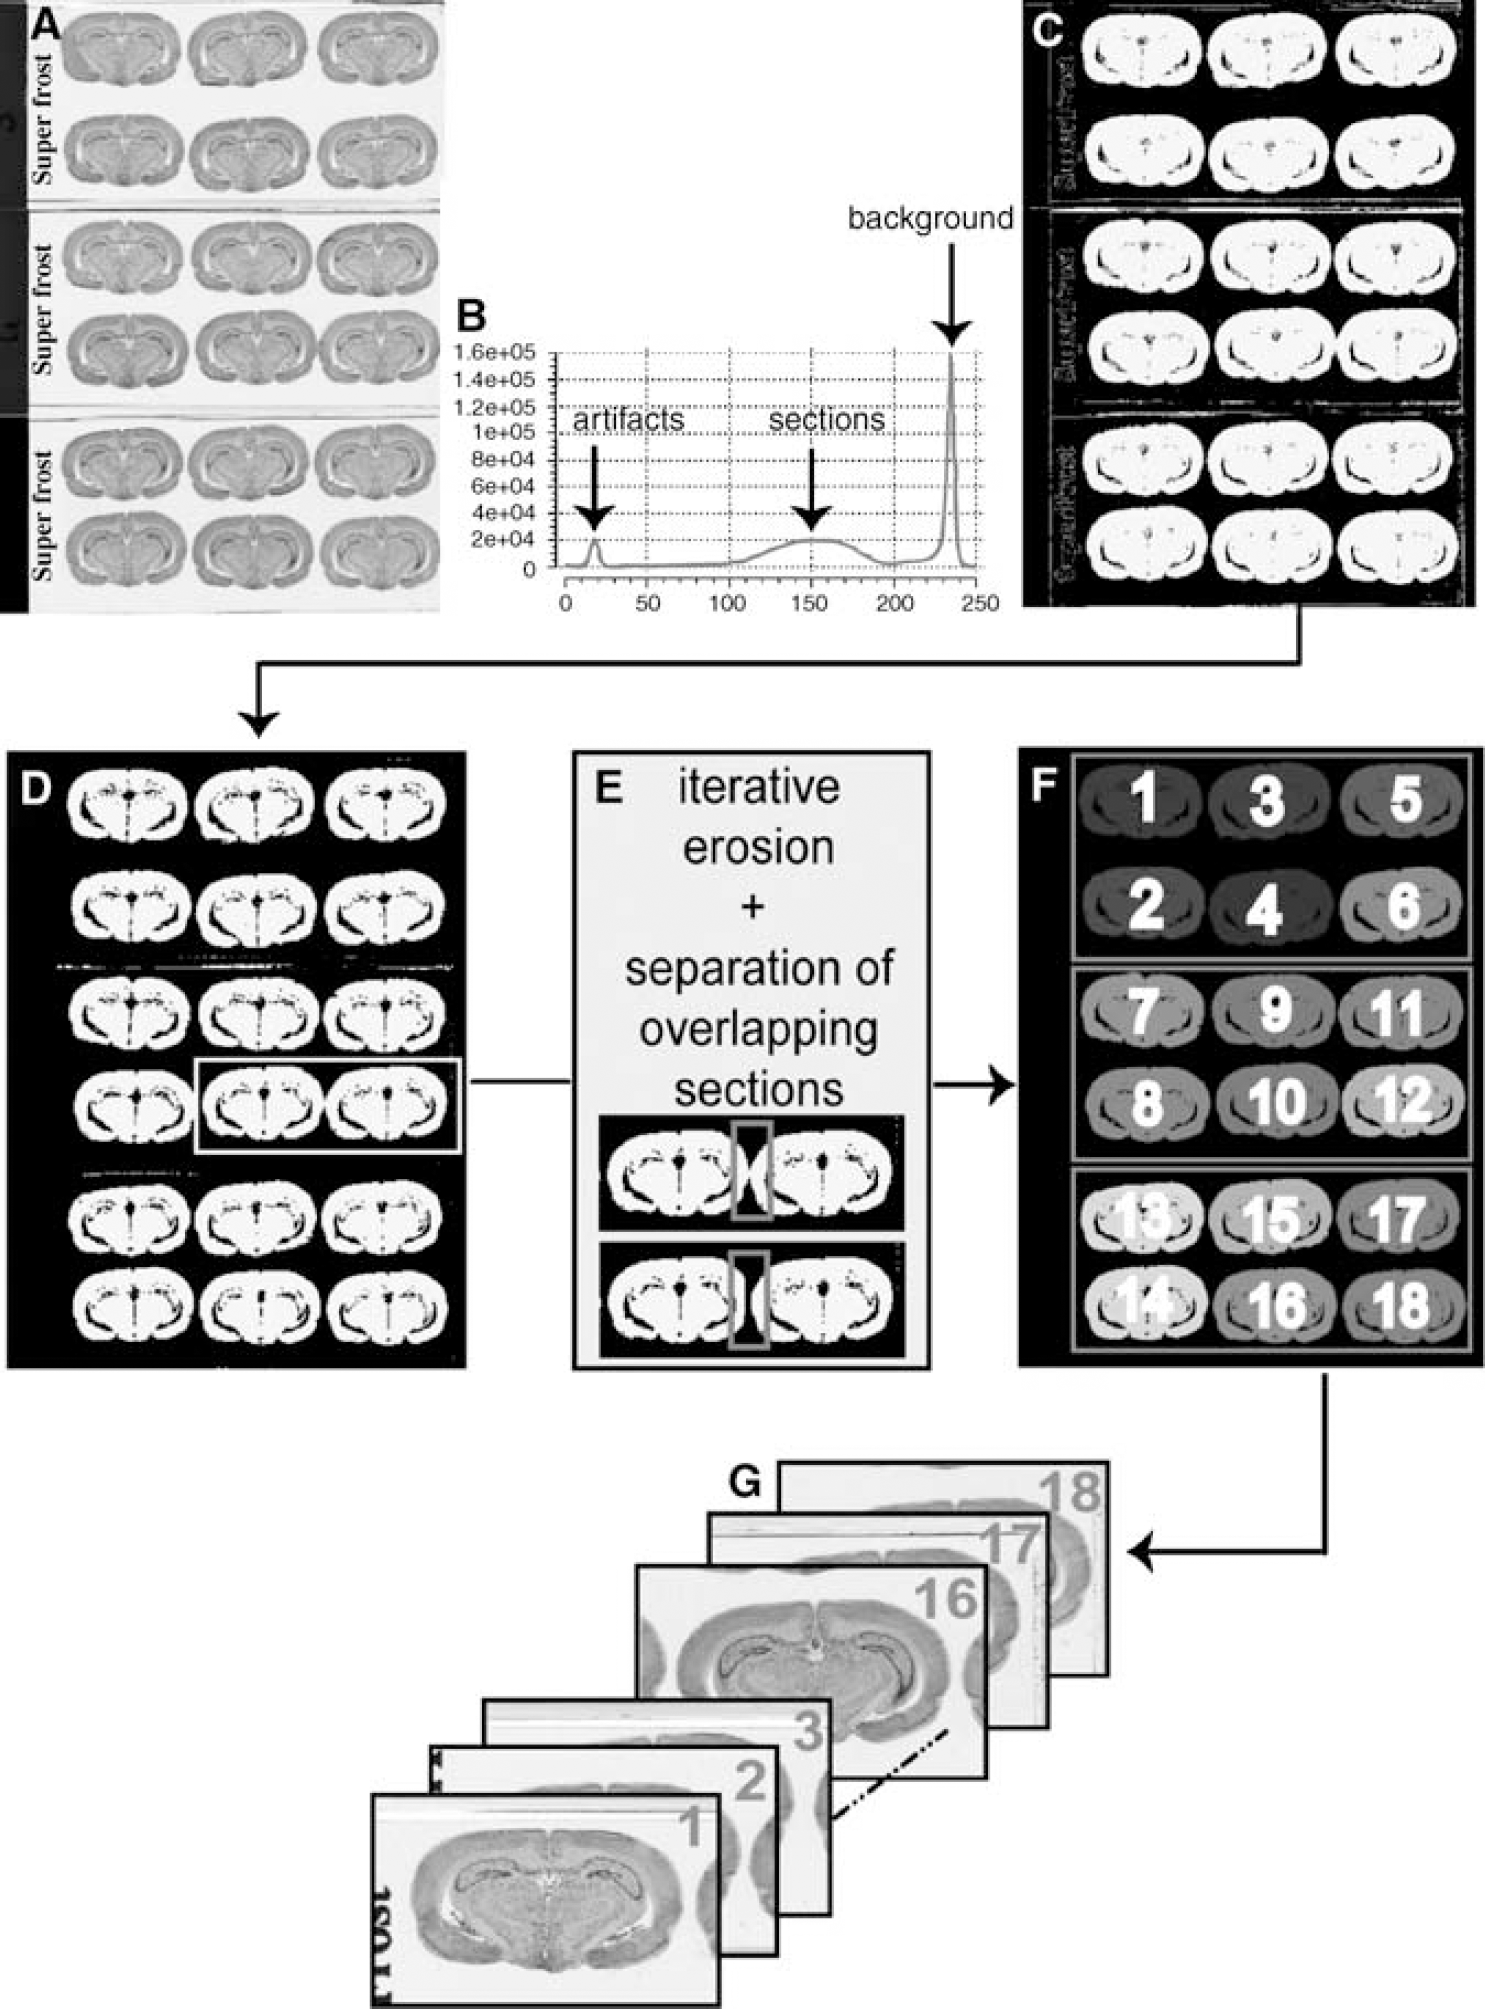
Procedures for the extraction of sections from overall scans. (
The automated procedure for extraction of sections from overall scans was based on thresholding and labeling, using techniques of robust histogram analysis and mathematical morphology. Histogram analysis was required to detect the main modes corresponding to the different classes present in the scans (mainly sections, background and possible artifacts such as hand-written or manufactured inscriptions on the slides; Figure 1B). The histogram was iteratively smoothed by a Gaussian filter and the position of each mode was followed along the scale space (Mangin et al, 1998). The two modes that remained the longest were the background and the sections. A region-growing method was applied in the histogram from the positions corresponding to the maximal values retained to determine the lower and upper boundaries for the gray levels for each mode, allowing the automated computation of the threshold to be used to derive a binarized image of the sections (Figure 1C). An a priori knowledge of section number and surface was used to perform iterative erosions, and thereby identify and extract the main connected components (Figure 1D). In addition, an automated analysis of width and height parameters for each connected component extracted according to median values allowed us to detect and to correct for vertical and horizontal overlaps between two sections (Figure 1E). This issue needed to be automatically solved since even a very small overlap, and hence difficult to visually detect, is a problem for the distinction between two overlapping sections, and hence for the individualization of sections as independent connected components. On the basis of X, Y coordinates of the gravity centers of the extracted sections, a positioning score was computed and used to sort and automatically assign the actual section number to each connected component in the column, corresponding to the order in which they were sectioned (vertical top-down, horizontal left—right; Figure 1F), and hence from which they were in the brain. The computation of a rectangular bounding box around each connected and labeled component was based on the following: (1) the horizontal and vertical dimensions of the biggest section with security margins of 10%; and (2) the gravity center information. Finally, the information relative to each section was extracted from the initial overall scans and produced individualized sections arranged in the sectioning process order (Figure 1G). Considering the overlapping sections, the computed bounding boxes included all the information relative to one section and a small part of the neighboring section.
3D Reconstruction of Anatomical and Functional Volumes
Section digitization and extraction constituted a preliminary step, which was the prerequisite before the 3D reconstruction. Initial volumes were obtained by stacking the individualized coronal sections in the Z direction. The gravity center of each section was aligned with the center of the bounding box to perform a coarse alignment of the stack (Figures 2A and 2E). Thus, the gravity center parameters linked the individualized histological and autoradiographic sections with the corresponding anatomical and functional volumes. However, an accurate section-to-section registration was necessary to make the volumes spatially consistent in 3D. We used the block-matching method (Ourselin et al, 2001) in a propagative scheme. This registration technique is especially well adapted for the 3D reconstruction of biologic volumes arising from histological or autoradiographic sections (Malandain et al, 2004; Dauguet et al, 2005a, b). A vector field is computed between the two sections to be registered using the correlation coefficient as similarity criterion between blocks and a rigid transformation is robustly estimated from this field. A multiresolution approach ensures a coarse to fine estimation of the optimal transformation. The anatomical volume was reconstructed first by registering each anatomical section with the following one in the stack. Then, by composition of the previously assessed transformations, each section was aligned to a reference section (chosen because it carries few artifacts such as folds or tears and is located in the middle of the volume to limit error propagation) so as to obtain a consistent 3D anatomical volume (Figures 2B and 2F). In a second step, this anatomical volume was used as a reference for the reconstruction of the functional data. Each 2D autoradiographic section was directly co-registered with its corresponding registered histological section from the anatomical volume using the same block-matching method (Figures 2C and 2G). After the 3D reconstruction of the functional volume, the gray level intensities determined from the autoradiographic images were calibrated using the coexposed [14C] standard scale and then converted to activity values (nCi/g of tissue) using a polynomial fourth degree fit method, identified by the radioactive [14C] standard curve. The blood samples taken from the animals during the experiment were used to compute the parameters of the modified operational equation of Sokoloff (1979) and to convert activity values to CMRGlu values (μmol/100 g/min; Figures 2D and 2H). The 3D reconstructed anatomical and functional information, respectively, presented both an intra- and intervolume consistent geometry (Figures 2I and 2J).
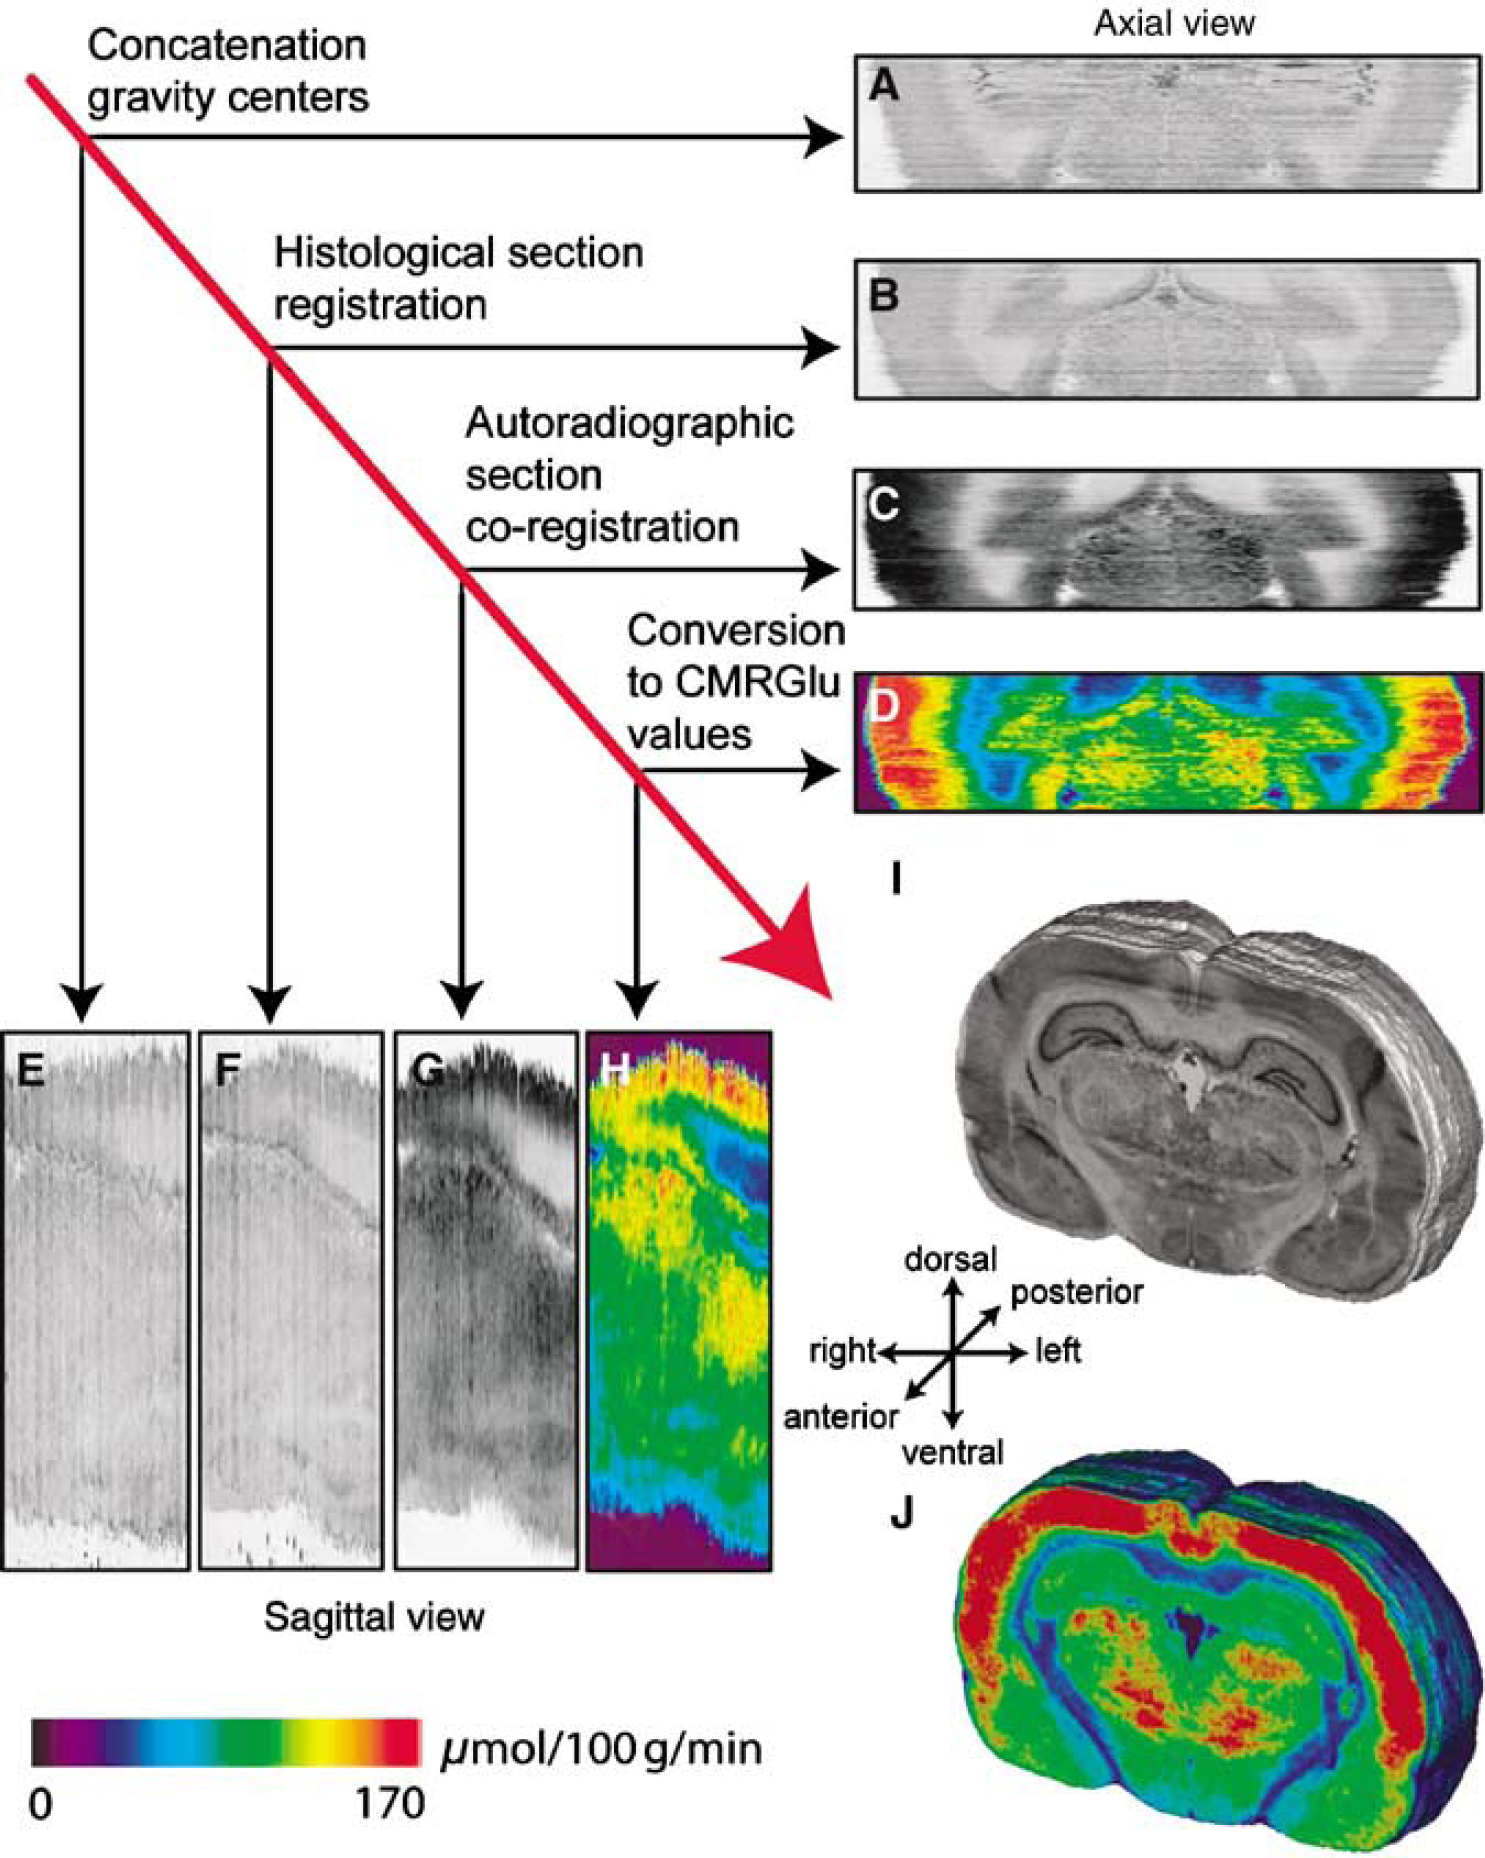
3D reconstructions of one rat brain data set (histological and corresponding autoradiographic sections) in axial and sagittal views, respectively. Anatomical reconstruction before (
3D-Geometry-Based Analysis
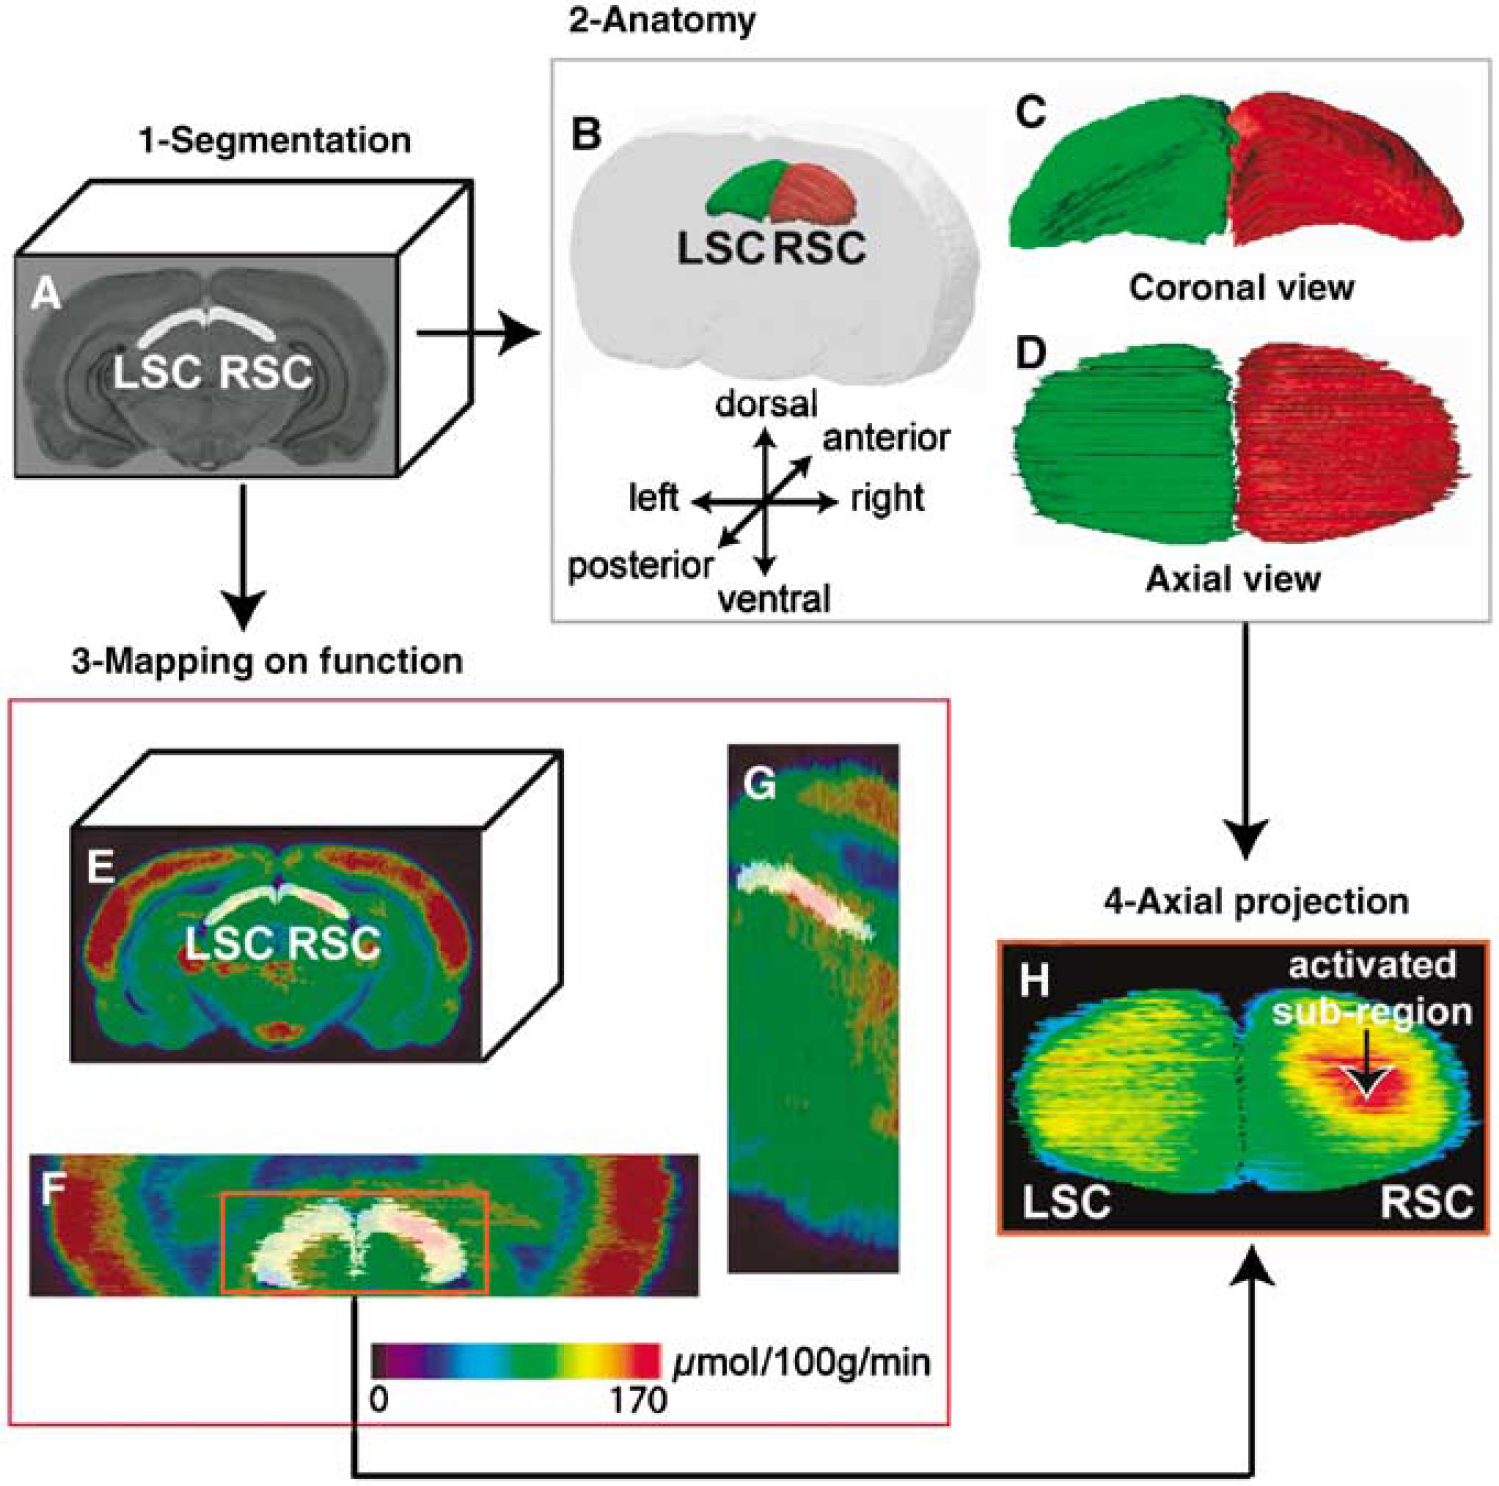
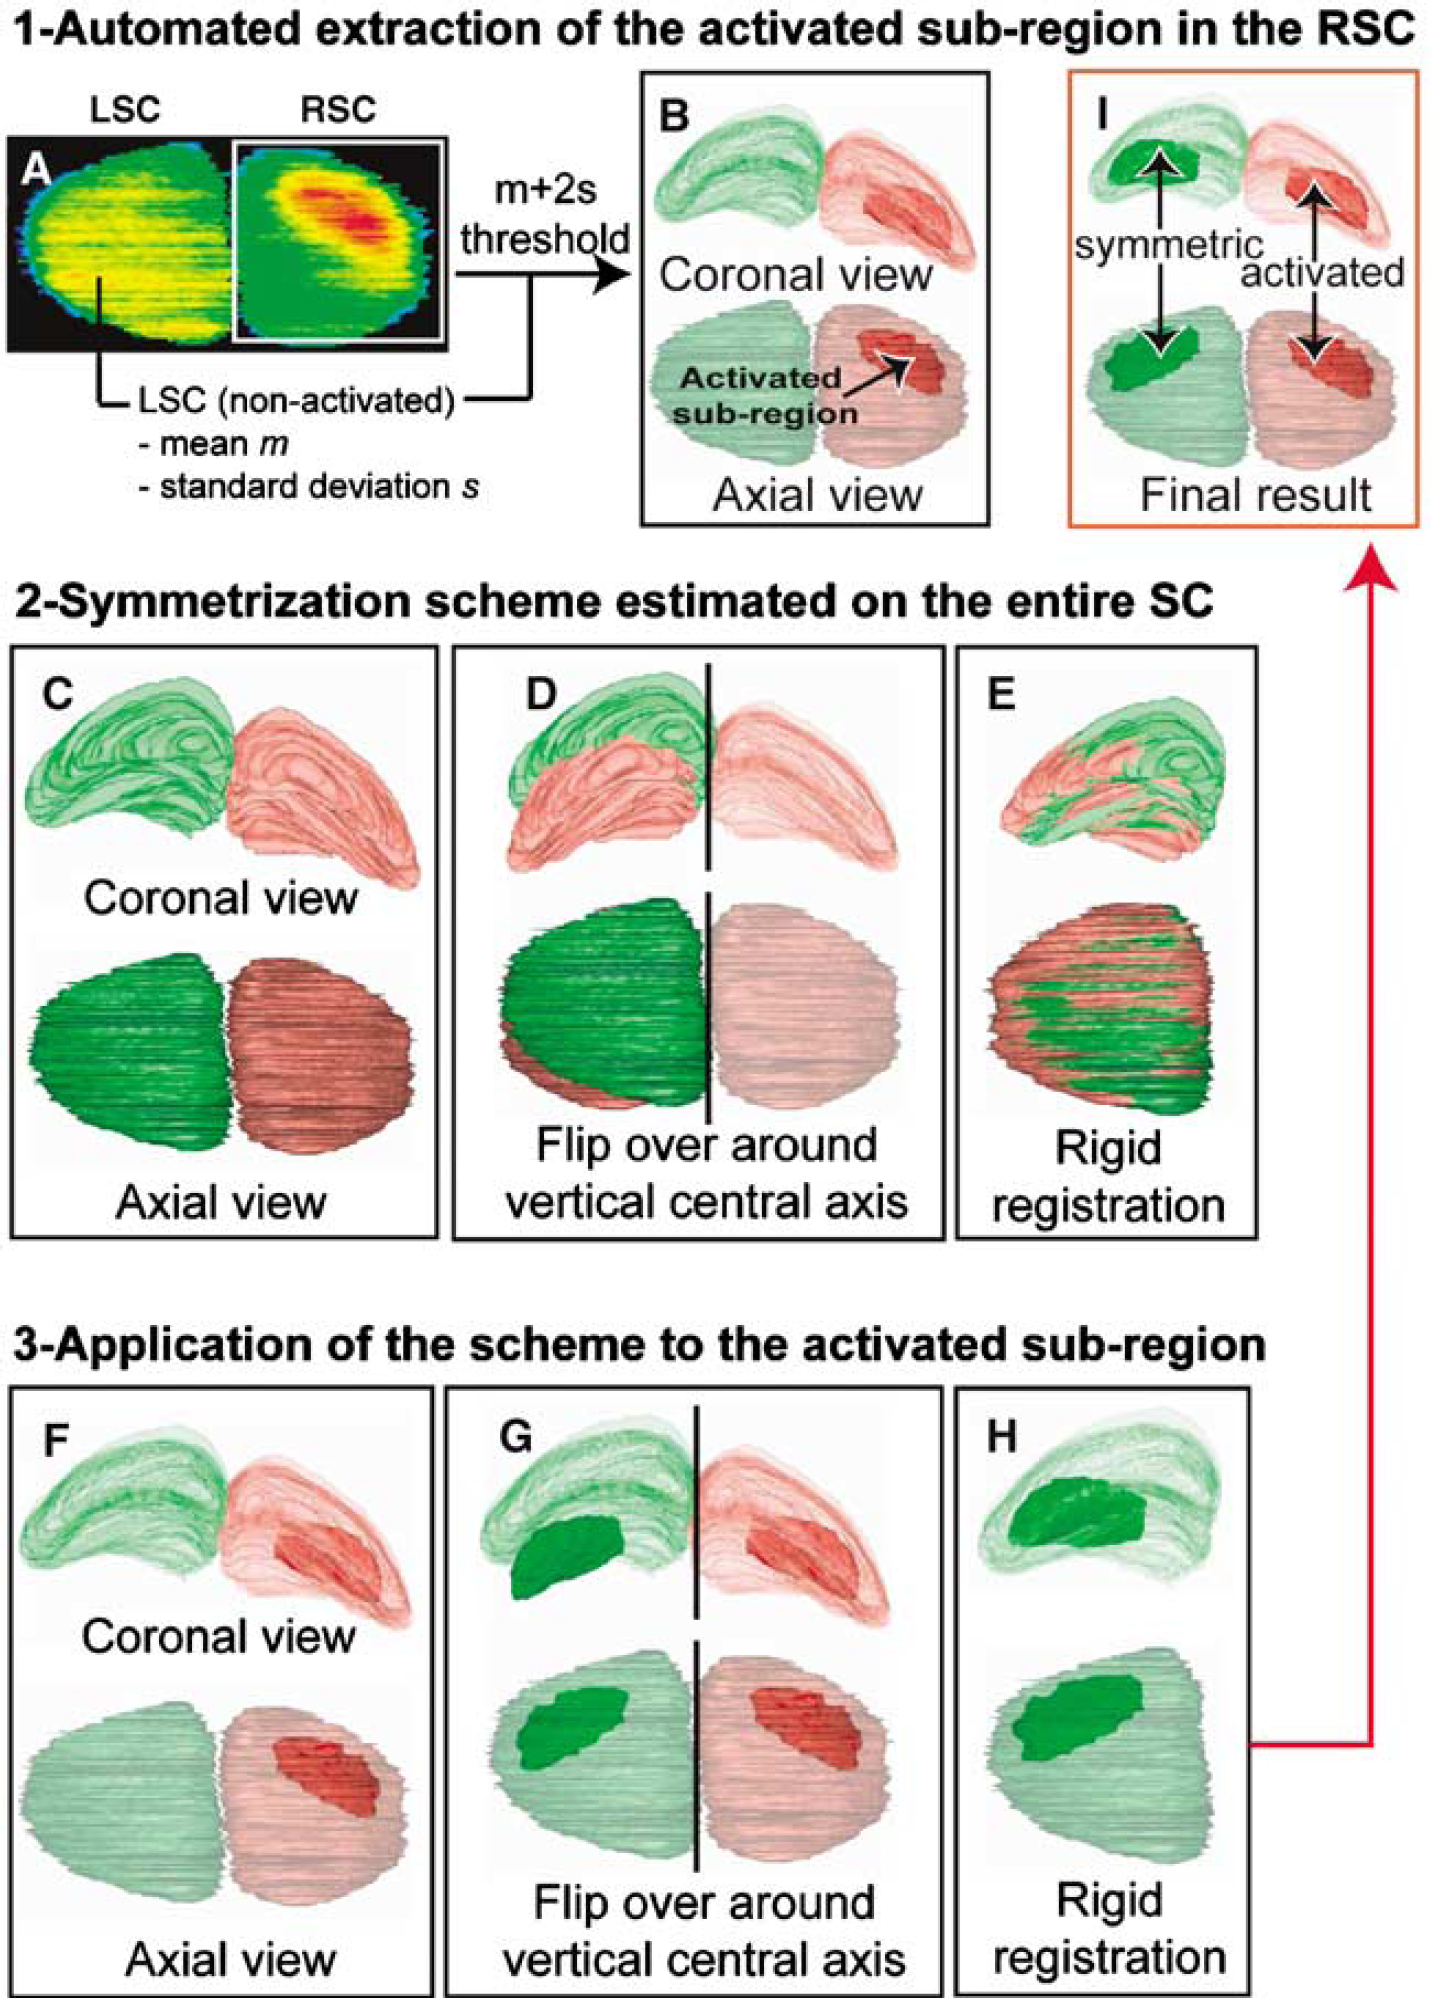
The analysis of autoradiographic data was performed the same way through each visual structure. To avoid any redundancies, our 3D-geometry-based analysis will be presented and illustrated only in the SC where the greatest metabolic change occurred during the visual stimulation. The in-house software Anatomist (Rivière et al, 2003) was used for manual segmentation of the right and left SC (RSC and LSC, respectively) on each section of the 3D rigidly registered anatomical volume (Figure 3A) yielding two volumes of interest (VOIs) and allowing assessment of their 3D shape (Figures 3B-3D; RSC in red, LSC in green). As the anatomical and functional volumes were co-registered, these VOIs were directly mapped on the functional volume (Figures 3E-G). The segmented VOIs and the 3D reconstructed functional volume were then used to create an image of the projection of mean CMRGlu values in axial incidence. This revealed the existence of a maximally activated CMRGlu subregion in the RSC, corresponding to the metabolic response induced by the visual stimulation (Figure 3H). To compare activated versus non-activated SC in the same animal, the activated subregion within the RSC (activated SC, corresponding to the left-opened eye) and the symmetrized subregion within the LSC (non-activated SC, corresponding to the closed eye) were automatically delineated. First, mean CMRGlu (m) and standard deviation (s.d.) values were calculated for the LSC (Figure 4A). They represented the basal reference CMRGlu values. Voxels presenting a GMRGlu value more than T = m + 2s.d. (significantly higher than the mean CMRGlu value in the LSC) were automatically outlined in the RSC, identifying the metabolic activation induced in the RSC by the visual stimulation (Figure 4B). Median-filter smoothing and size thresholding were then applied to respectively regularize the subregions of contiguous activated voxels and reject the smallest subregions corresponding to noise. The difference between the CMRGlu values in the activated RSC and the non-activated LSC is a measure of the metabolic response induced by the visual stimulation. To calculate this difference, the 3D subregion of metabolic activation, automatically outlined in the RSC had to be symmetrized in the LSC. To allow for the possible dissymmetry issue associated with the sectioning process, we first applied the symmetrization scheme to the entire SC (Figure 4C). A flip over of the RSC around the vertical central axis of the volume was realized (Figure 4D). From this position, the flipped RSC was then rigidly registered in 3D to the LSC using the block-matching registration technique described above (Figure 4E). The activated subregion was also flipped over around the vertical central axis, and the rigid-body transformation estimated from the entire SC was applied to the flipped activated subregion (Figures 4F-4H) to delineate a non-activated subregion (dark green) in the LSC corresponding to the symmetric form of the activated subregion in the RSC (dark red) (Figure 4I). To ensure that only voxels mapping SC tissue were included in the analysis, the voxels of each subregion lying outside of the corresponding SC were masked out.
(
Procedures for the 3D-geometry-based analysis of functional information illustrated with rat 2 whose brain was cut in a slightly dissymmetrical way. First step: (
Morphometric parameters relative to the shape and the volume of various brain regions of interest were assessed: (1) the entire RSC (activated) and LSC (non-activated) obtained after manual segmentation; (2) the activated subregion automatically extracted in the RSC; and (3) the corresponding flipped and symmetrized subregions in the LSC. Mean CMRGlu values in activated (CMRGluactivated) and non-activated (CMRGlunon-activated) regions were measured and used to compute corresponding relative metabolic rate changes (MRC, expressed as percentages) using the following formula:

For 2D/3D comparative analyses, mean CMRGlu values in each segmented section of the RSC and LSC were also measured. All results are expressed as means ± s.d. Student's paired t-test was used to compare mean CMRGlu within animals. P-values less than 0.05 were considered significant.
All computerized treatments and procedures presented in this paper (section extraction, 3D reconstruction of anatomical and functional volumes, conversion of functional data values to CMRGlu and 3D-geometry-based analysis) were written in C + + . They were also integrated with in-house software BrainVISA (Cointepas et al, 2001; http://brainvisa.info) and gathered in plugged-in modules dedicated to the processing of rat brain histological and autoradiographic sections. Although they were developed and implemented under BrainVISA environment on a Linux workstation, the treatments are able to run on most operating systems (Macintosh or Windows) and can be used on a personal computer, which facilitates their daily use and data handling.
Results
To validate the overall methodology, the processing stages (from section digitization to 3D-geometry-based analysis) were applied to five rats with the left eye open (stimulated) and the right eye closed with opaque adhesive tape (unstimulated). Histological and autoradiographic data sets were each composed of approximately 150 sections, divided up as follows: five columns of five glass slides bearing six sections. Thus, there were approximately 1500 sections in total, which were successfully processed using the above-described methodology.
Using our optimized digitization procedure (Figure 1), each series of stained histological sections and autoradiographs, encompassing VC, SC, and LGN (approximately 300 images in total per animal), was acquired and stored by operator in less than 10 mins. Then, the images were automatically and successfully extracted from the overall scans in less than 15 mins.
After the 3D reconstruction (one and a half hours of computing time per data set to be reconstructed that we generally get working during the night), we obtained both consistent and co-registered anatomical and functional volumes. Quality of the registration and 3D reconstruction process was assessed by visual inspection of internal structures viewed in different orthogonal incidences (Figures 2B, 2C, 2F, and 2G) as well as by visual inspection of the 3D surface renderings of the corresponding anatomical and functional volumes (Figure 2I and 2J, respectively).
The 3D functional surface rendering was sectioned with four different axial cutting planes moving along the dorso-ventral direction (Figure 5). Each of them displays the differentially activated regions obtained in response to the visual stimulation in each visual structure, namely the areas 17 (OC1) and 18a (OC2l) of the VC, the SC, and the LGN (Figures 5A, 5B, 5C and 5D, respectively). An increased CMRGlu area is visible in each right visual structure compared with the left corresponding one. Using our newly developed procedure for the 3D-geometry-based analysis of functional information (Figures 3 and 4), we were able to automatically delineate the maximally activated subregion(s) and the symmetrized subregion(s) in each right and left visual structure and therefore to assess their shape, their location within the structure and their spatial extent. In Figure 5E, these subregions are depicted in their corresponding visual structure and repositioned within the 3D reconstructed anatomical volume. Tables 1–3 summarize all the anatomical and functional information including the relative MRC obtained for the five animals in each visual structure (VC, SC, and LGN, respectively). The volume of each visual structure was very similar between the left and right hemispheres in the same animal as well as between animals. The automated extraction of the activated subregion(s) identified anatomically restricted volumes that respectively encompassed 3, 10, and 16% of the volume and 65, 42, and 56% of the sections covering each corresponding right visual structure (right VC (RVC), RSC, and right LGN (RLGN), respectively; Figure 5E). The volume of the flipped subregion(s) in each left visual structure was lower than the one measured for the activated subregion(s). They showed an important variability because only few animals presented a perfectly symmetric flipped subregion. After the application of our symmetrization procedure in all five rats, the volume of the symmetrized subregion(s) was similar to the one measured for the activated subregion(s). CMRGlu in the entire activated RVC and RLGN was significantly increased compared with the non-activated left VC (LVC) and left LGN (LLGN) (**P < 0.01 and *P < 0.05, respectively; Figure 6), whereas we did not observe any increase in the entire activated RSC (P > 0.05; Figure 6). For all the three visual structures, CMRGlu in the activated subregions(s) was significantly higher than in the symmetrized subregions(s) (***P < 0.001; Figure 6). The relative MRCs determined within these subregions were +20, +23, and +17% for the VC, SC, and LGN, respectively.
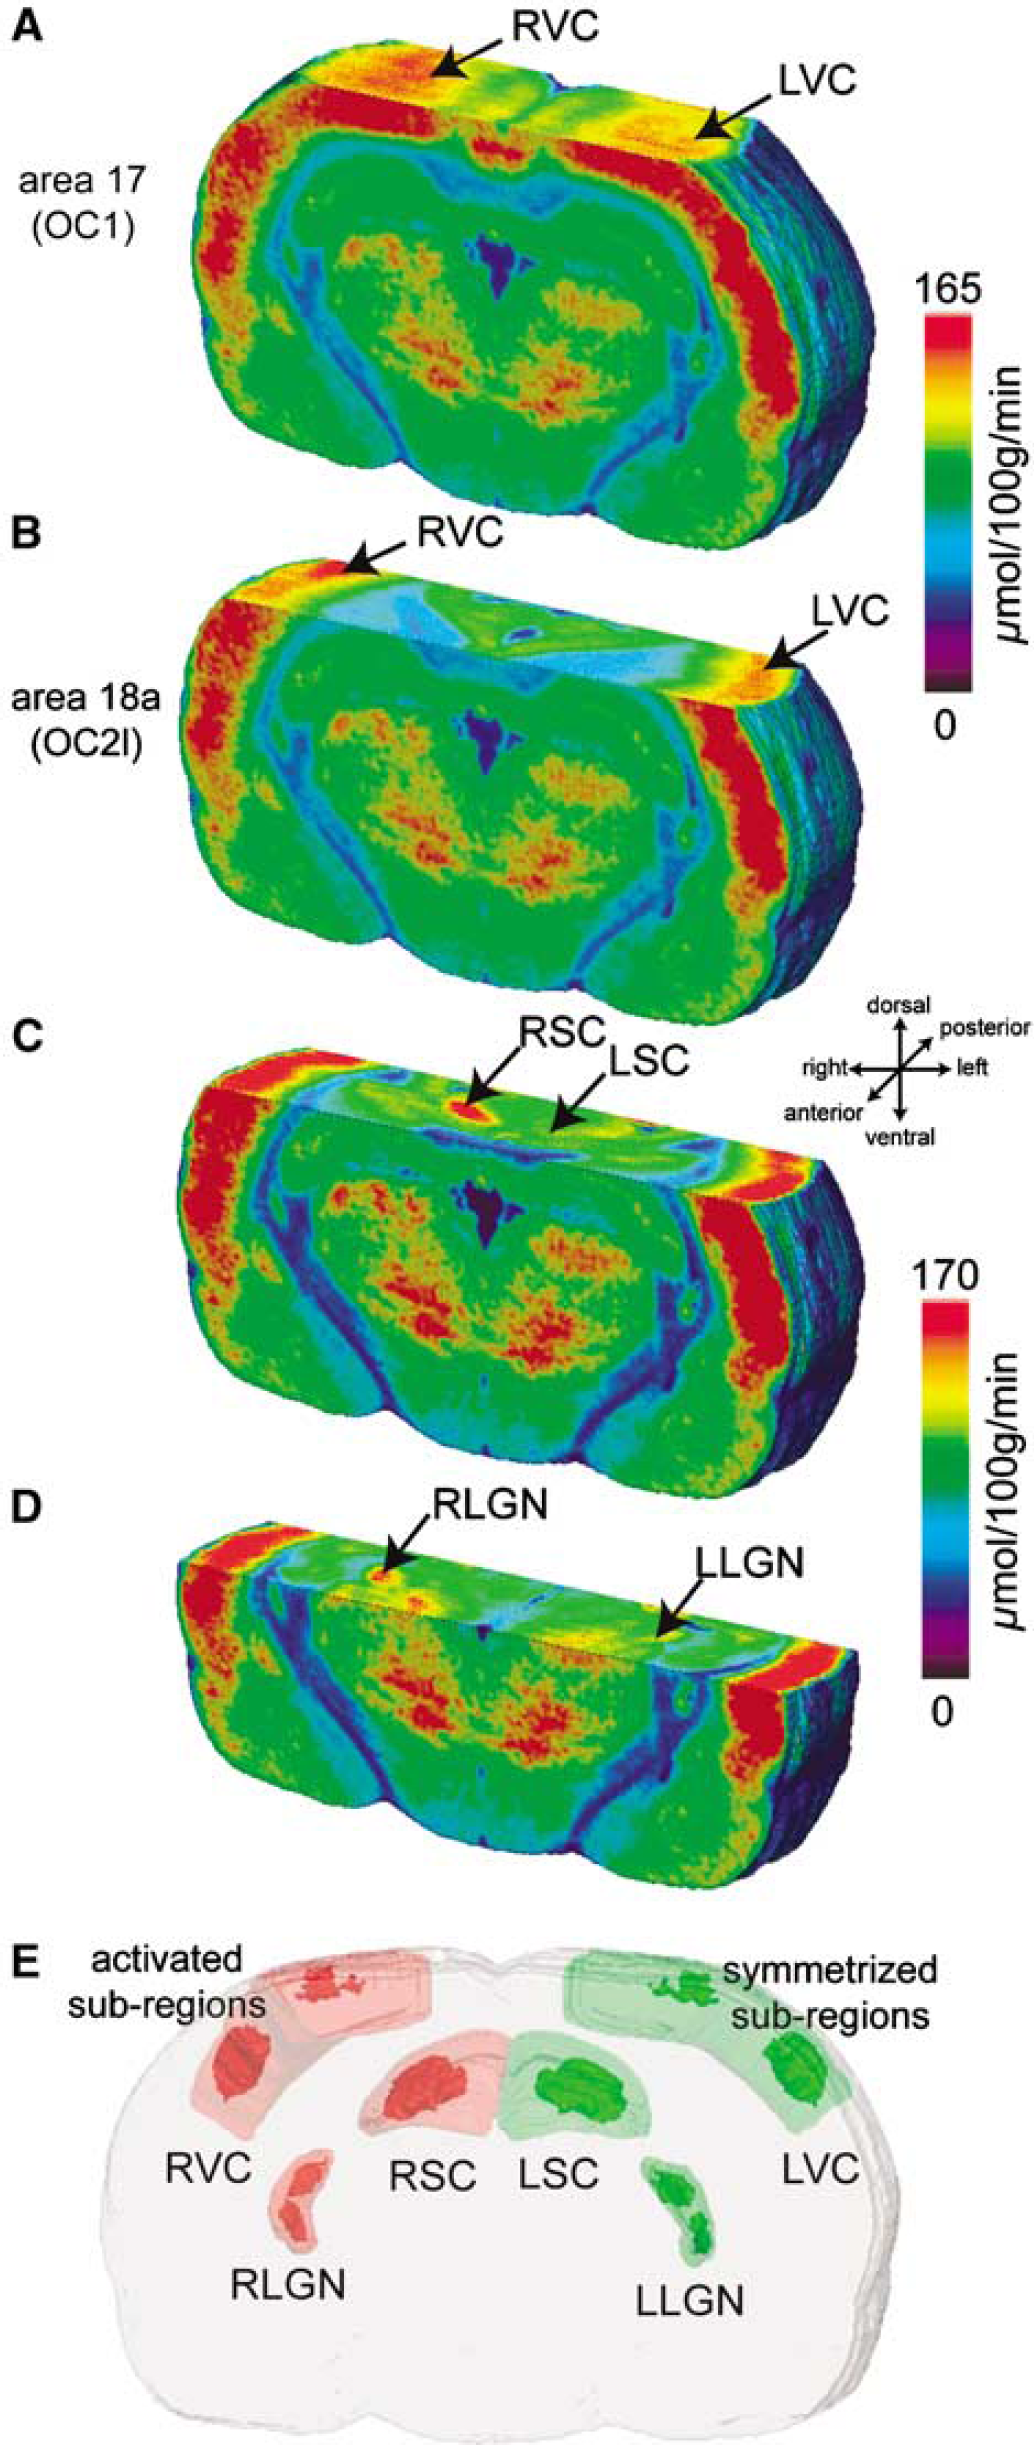
Four 3D surface renderings of the functional volume indicating the antero-posterior and dorso-ventral location as well as the spatial extent of the metabolic activation in each visual structure (areas 17 and 18a of VC, SC, and LGN; (
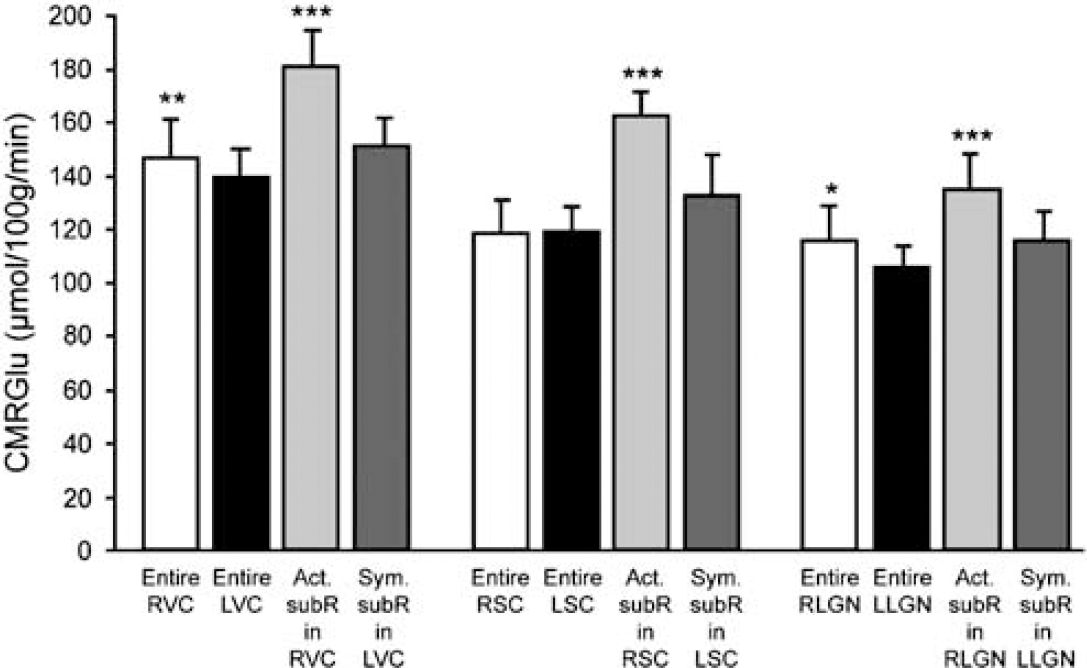
Mean CMRGlu values measured in the entire VC, SC, and LGN, and in the activated and symmetrized subregions within the right and left VC, SC and LGN. Statistical analysis indicate increased activation in the entire activated right VC and LGN compared to the non-activated left VC and LGN (**P < 0.01 and *P <0.05, respectively) and in all three activated subregions compared to the three symmetrized subregions (***P < 0.001). (Act. SubR, activated subregion; Sym. SubR, symmetrized subregion). Data are means ± s.d., n = 5 rats. Student's paired t-test.
Results of analysis in VC (n = 5, left eye open, right eye closed, under visual stimulation): anatomic and functional information and relative MRC computation
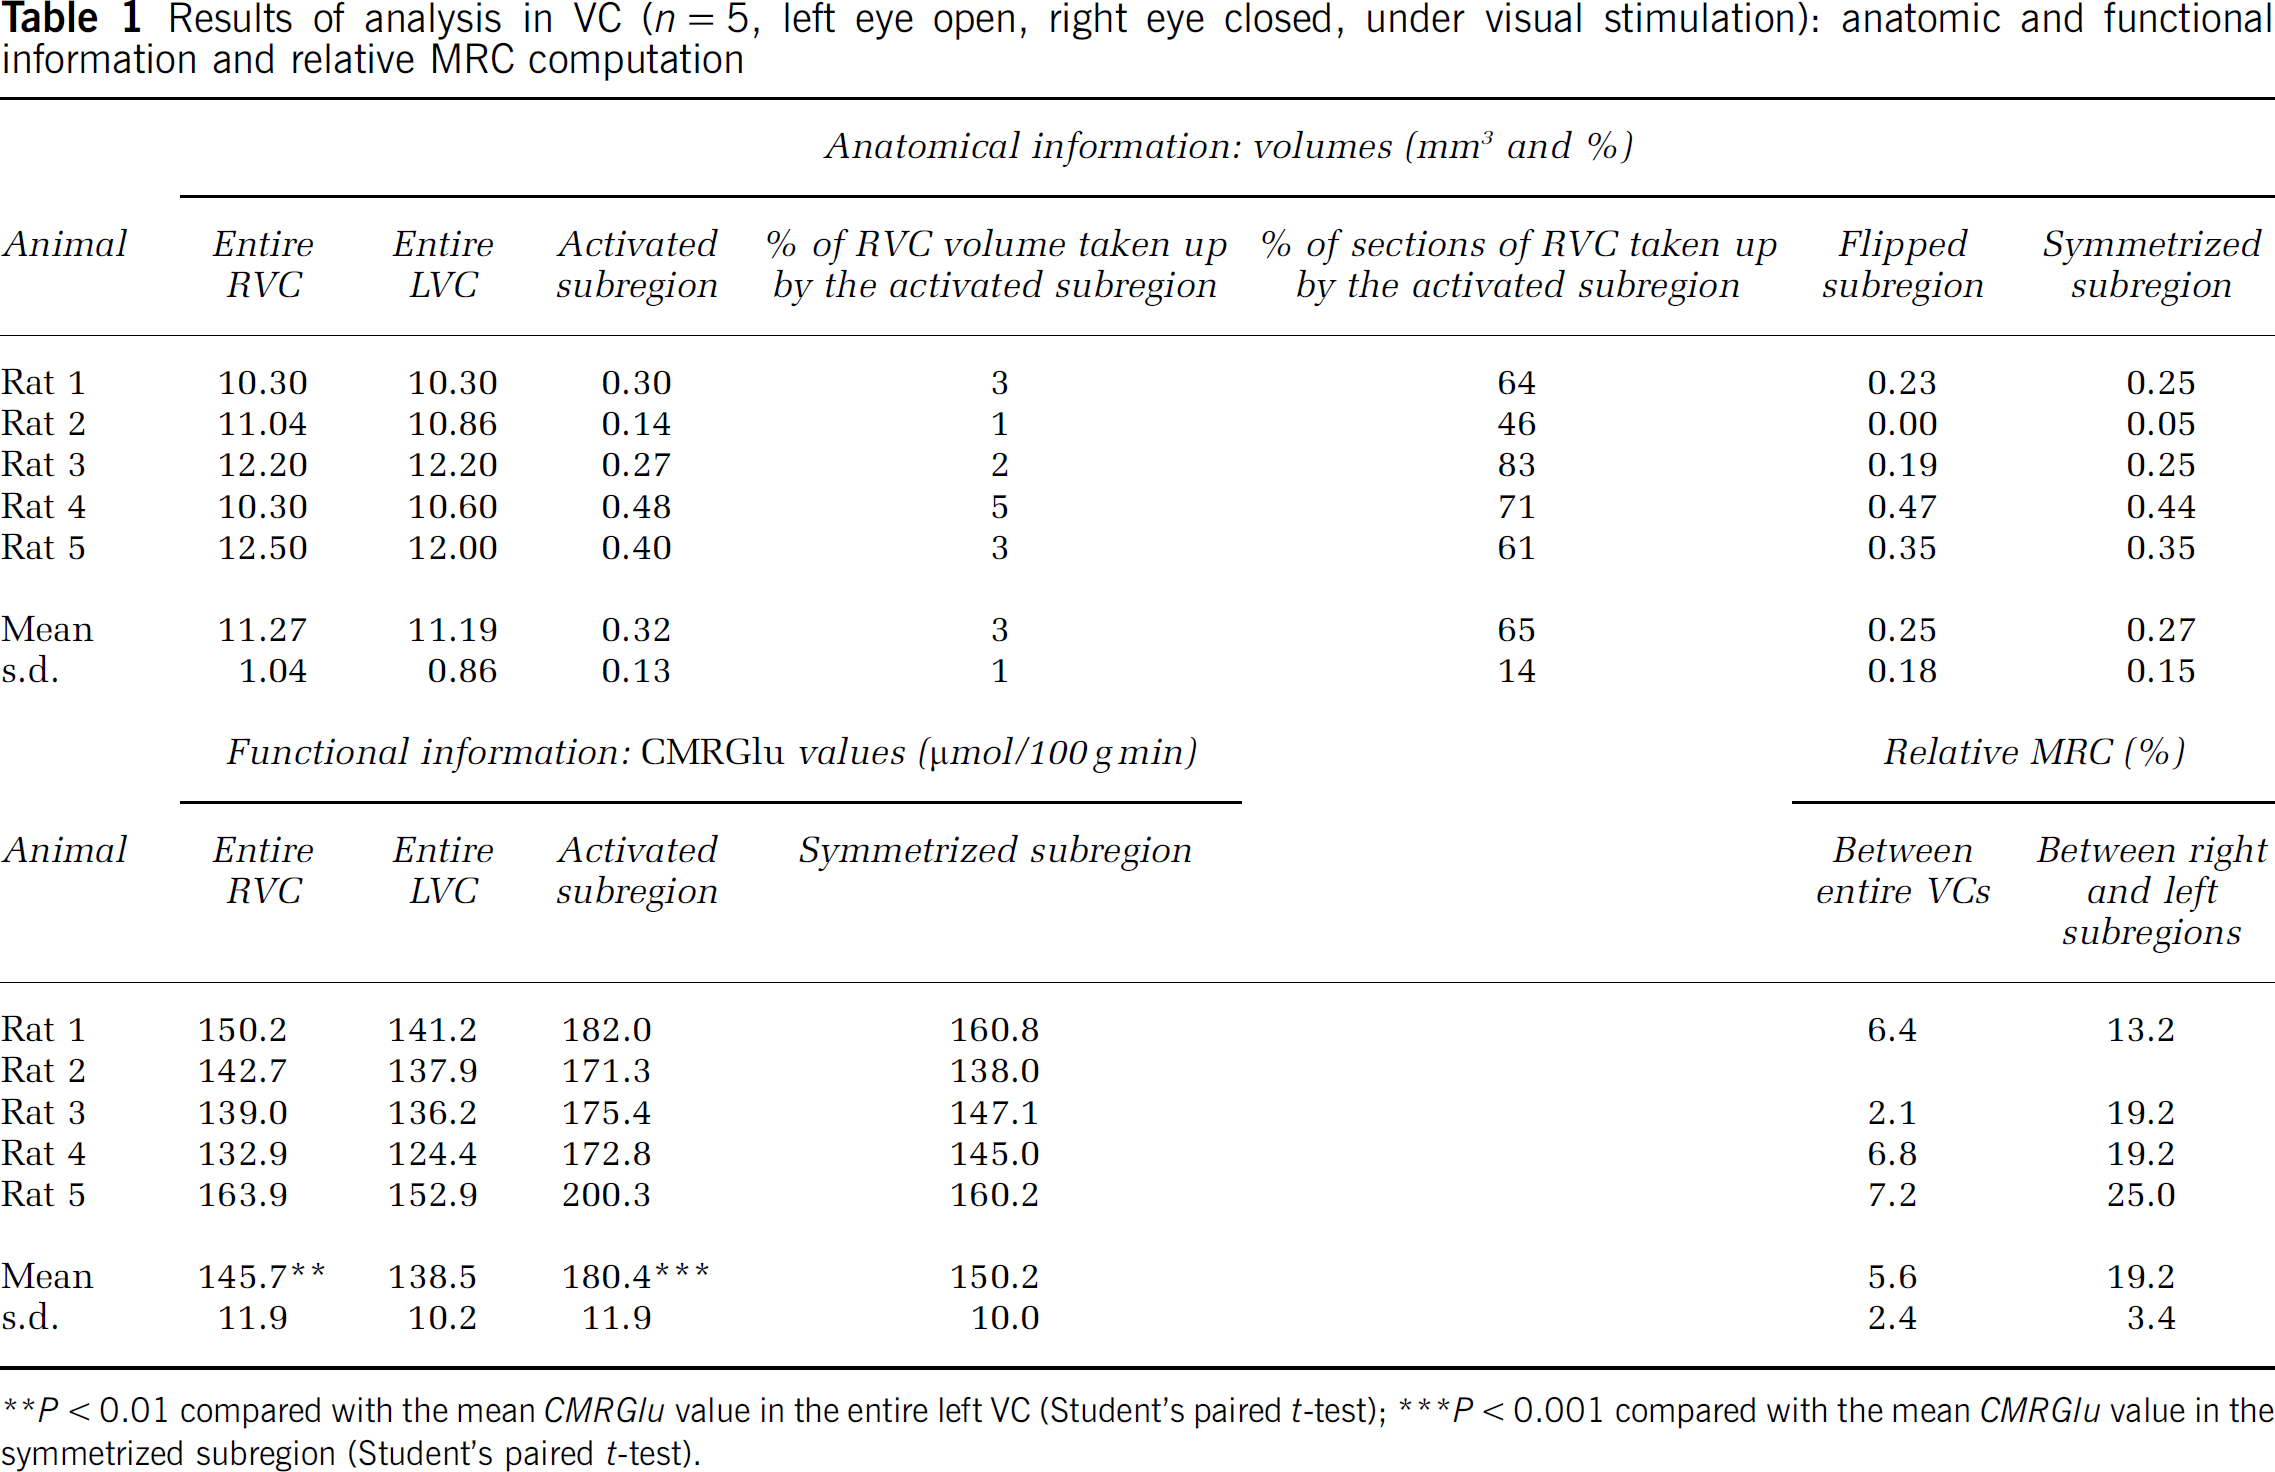
P < 0.01 compared with the mean CMRGlu value in the entire left VC (Student's paired t-test)
P < 0.001 compared with the mean CMRGlu value in the symmetrized subregion (Student's paired t-test).
Results of analysis in SC (n = 5, left eye open, right eye closed, under visual stimulation): anatomical and functional information and relative MRC computation
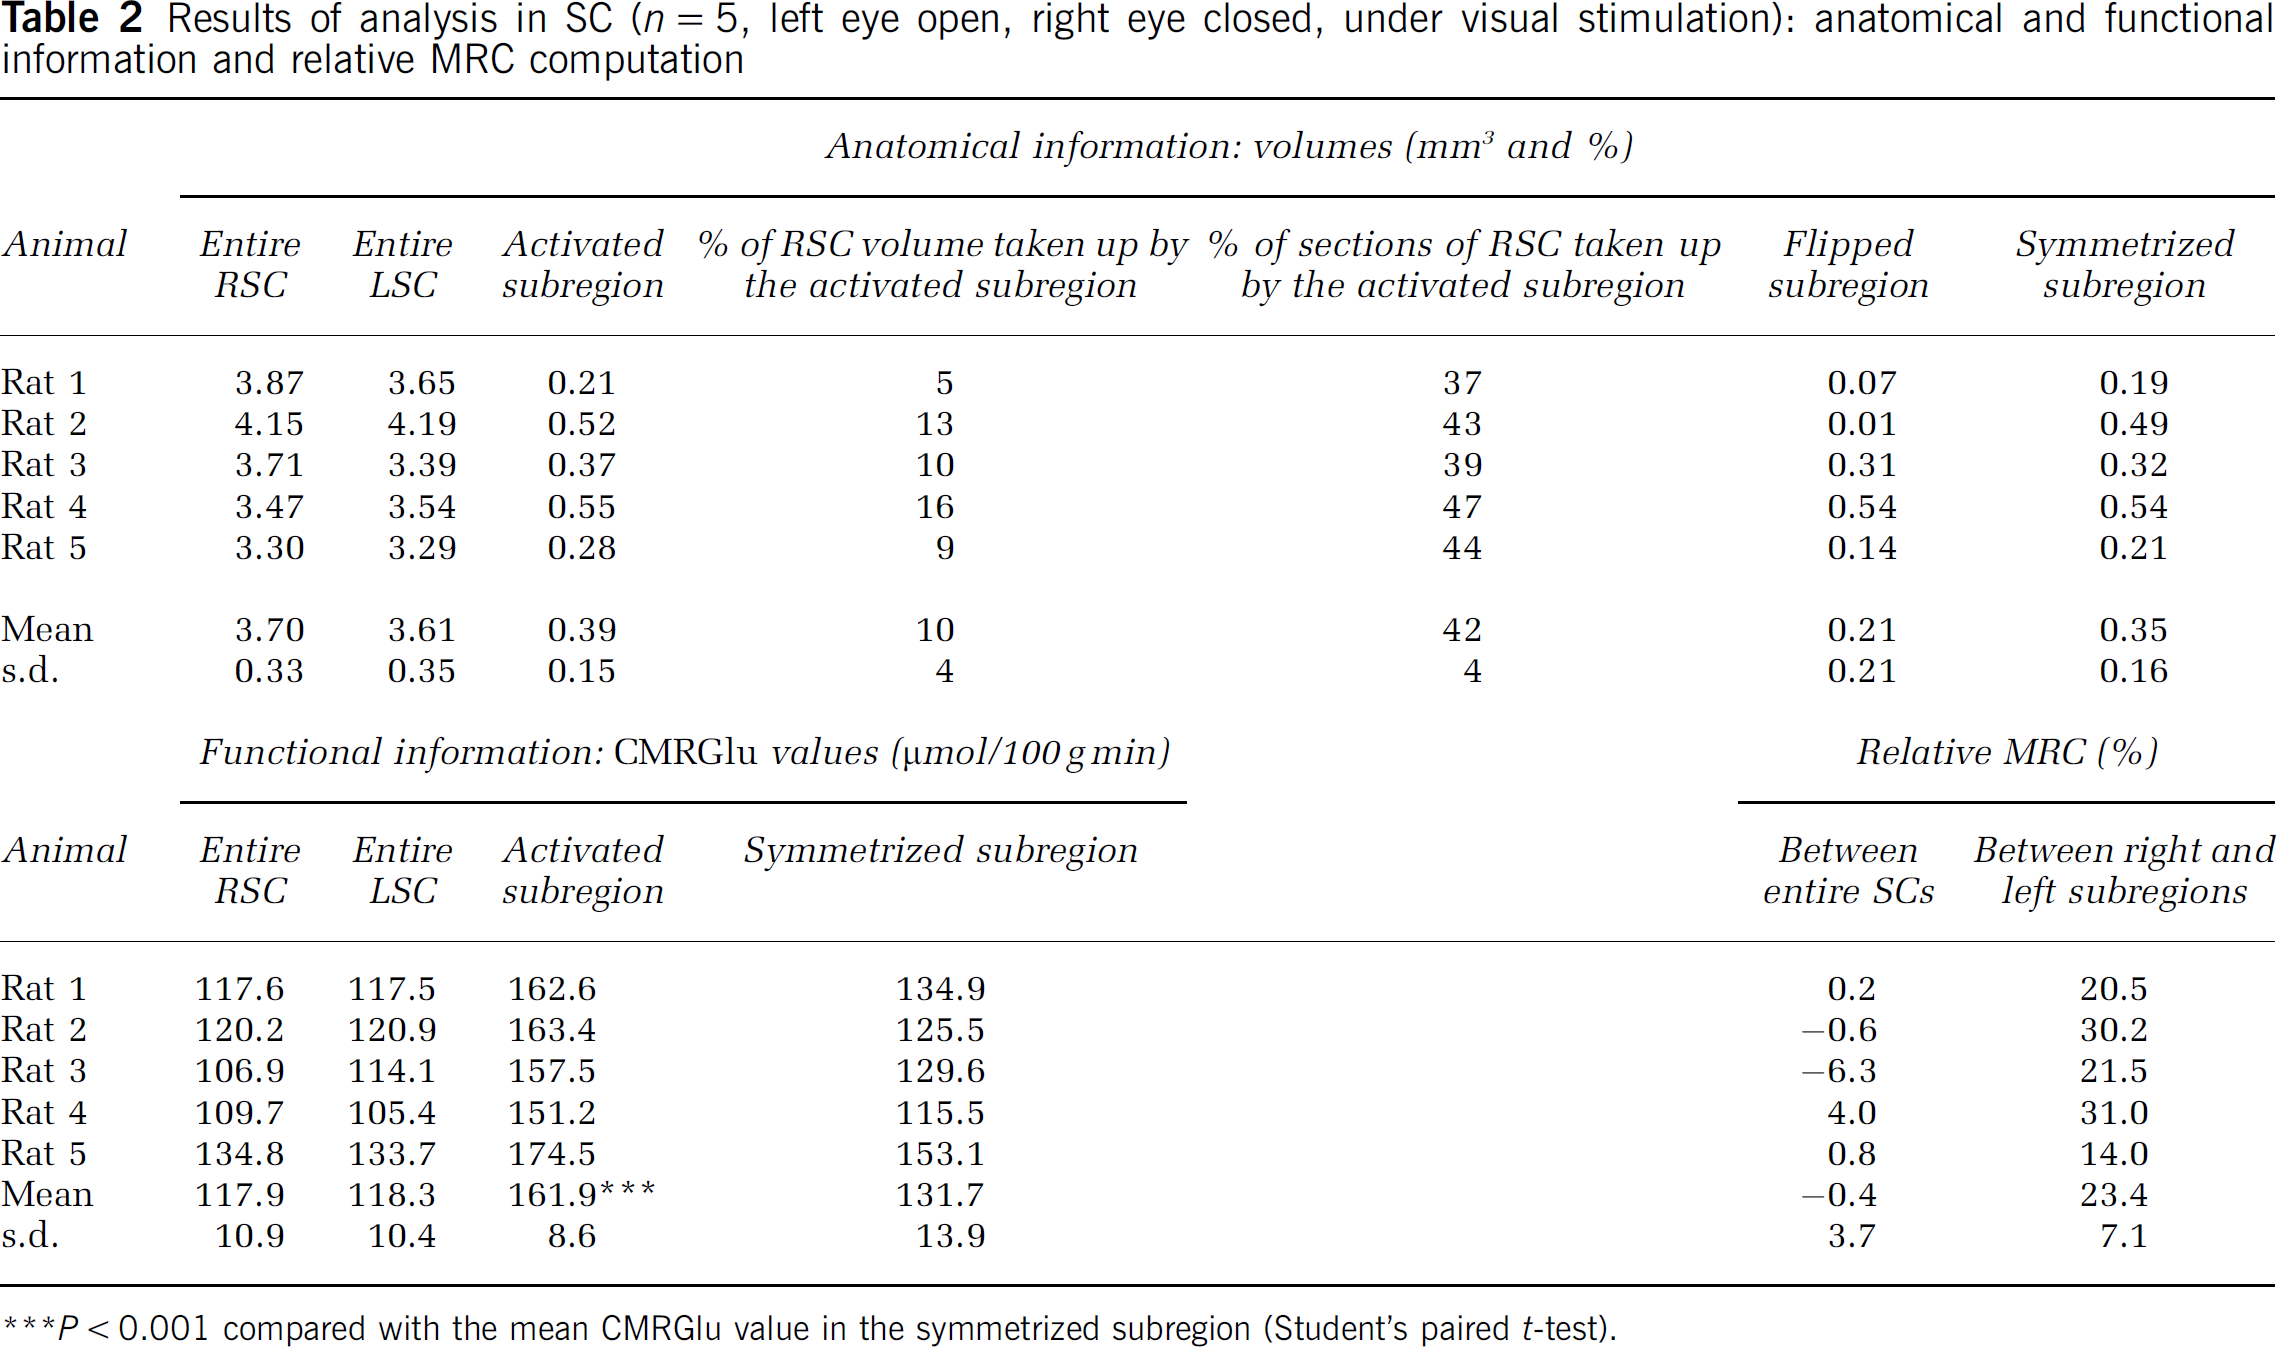
P < 0.001 compared with the mean CMRGlu value in the symmetrized subregion (Student's paired t-test).
Results of analysis in LGN (n = 5, left eye open, right eye closed, under visual stimulation): anatomical and functional information and relative MRC computation
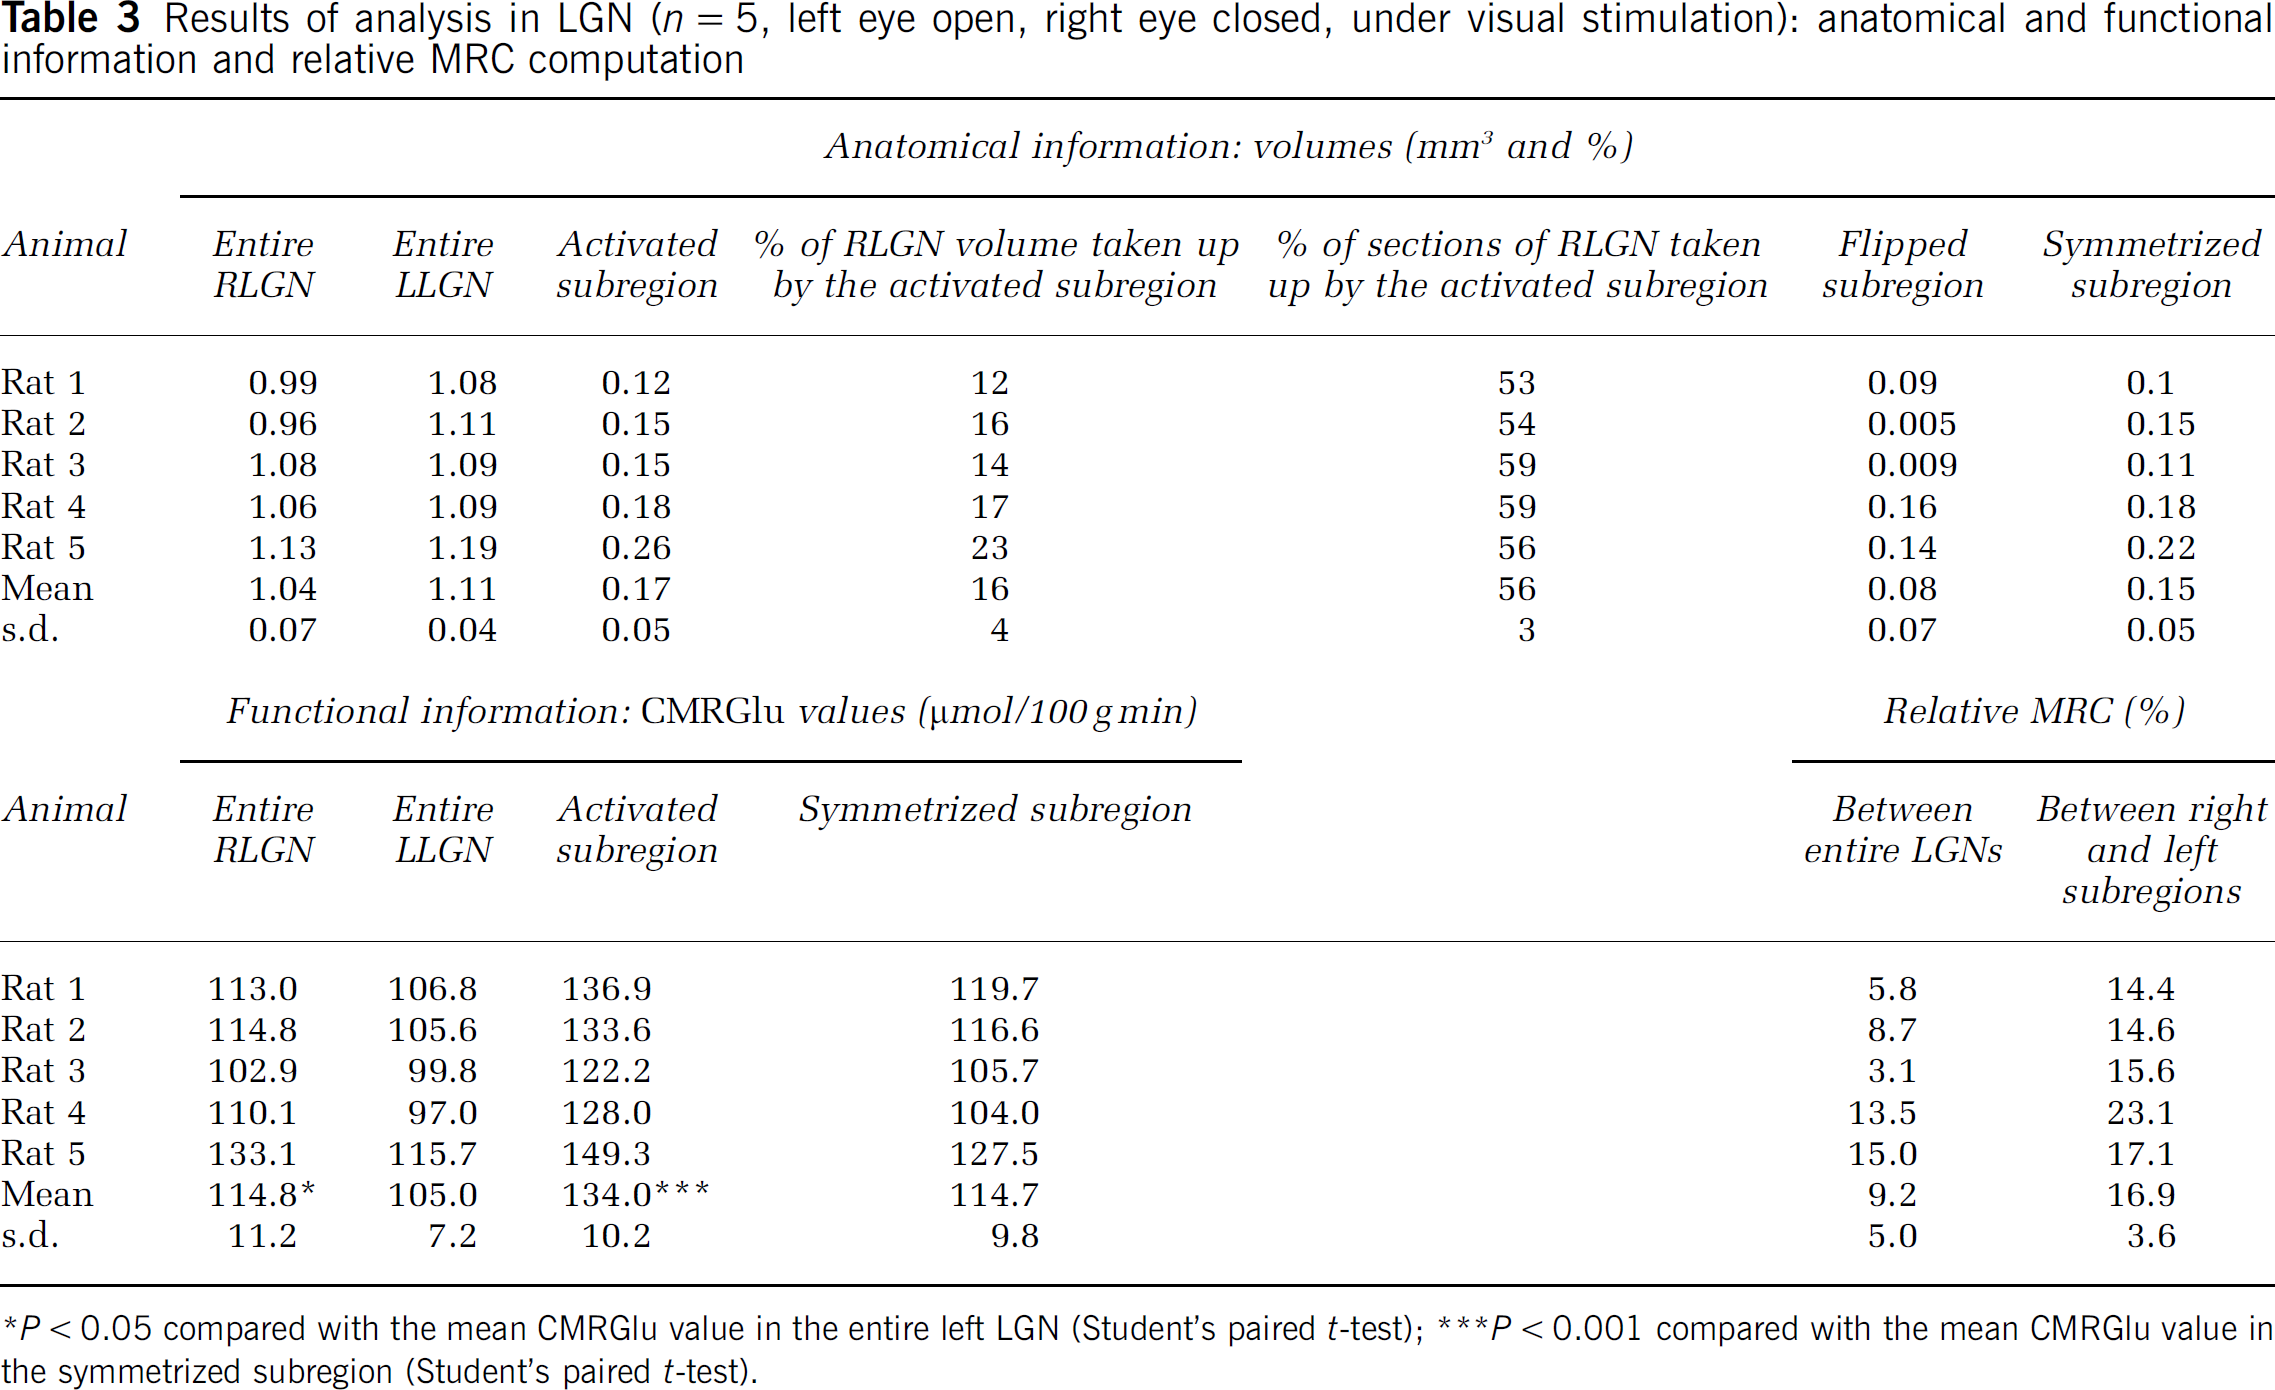
P < 0.05 compared with the mean CMRGlu value in the entire left LGN (Student's paired t-test)
P < 0.001 compared with the mean CMRGlu value in the symmetrized subregion (Student's paired t-test).
Discussion
The aim of this paper was to develop a dedicated, generic, and automated methodology for 3D-geometry-based morphometric and functional analysis and to illustrate its substantial qualitative and quantitative benefits by applying it to an activation study in the rat.
Overall Section Digitization and Extraction
Rather than digitizing sections one by one as it is usually the case with a CCD camera and a lighting table, our procedure involves a multiple acquisition under the form of glass slide columns (overall scans) using a flatbed scanner. This digitization procedure significantly reduces the acquisition time (300 sections digitized in less than 10 mins whereas it takes 1 h with a CCD camera). Unlike other previously reported algorithms designed for the same purpose (Goldszal et al, 1995; Nikou et al, 2003; Nguyen et al, 2004; Lee et al, 2005), we made extraction of sections from overall scans entirely automated, reproducible (number assignment and rectangular bounding boxes around each section are automatically computed) and robust (consideration of the troublemaker modes resulting from various artifacts appearing in the scans, such as hand written slide number or slide border and of the possible section overlaps). In addition, the section extraction procedure is generic: histological sections are handled in exactly the same way as autoradiographic images.
Three-dimensional Reconstruction Strategy for Anatomical and Functional Volumes
Sections were first stacked in the Z axis using gravity center parameters for each section. The intermediate volumes thereby already presented a good quality of stacking (Figures 2A and 2E). However, this initial step only provided a coarse registration of histological or autoradiographic sections (inner brain structures were not properly registered).
A Rigid Pairwise Registration: Three-dimensional reconstruction generally involves the sequential registration of each section to its adjacent section using linear or non-linear image registration techniques (Hibbard and Hawkins, 1988; Goldszal et al, 1995; Zhao et al, 1995). Here, we used a registration technique based on a rigid body transformation between adjacent coronal sections. This type of registration is standard, robust, and well adapted for brain sections obtained with a cryostat because a rigid body transformation is sufficient to superimpose one section on the next one. Although the data can in some cases exhibit deformation artifacts as a result of sectioning and tissue shrinkage (Kim et al, 1997), non-rigid deformations between the adjacent sections can distort the brain structures. Therefore, it appears better to preserve the shape of each section without compensating for the deformation than to take the risk of distorting the overall and regional image information during the registration process (Lee et al, 2005). We used the classic scheme, consisting in serially propagating the transformations estimated between consecutive sections relative to a reference section in the series. This approach has been criticized because it can lead to different types of misregistrations. According to Nikou et al (2003), if an error occurs in the registration of a section about the previous section, this error will be propagated through the entire volume. Thus, if the number of sections to be registered is large, an overall offset of the volume, because of error accumulation, is entirely plausible. However, these issues are more pronounced when distant sections are involved in the registration, which is not our case (20-μm-thick adjacent serial sections). Consequently, we believe that our approach of section-to-section registration (Malandain et al, 2004; Pitiot et al, 2005), in the absence of any 3D geometrical reference (such as magnetic resonance imaging scans or images of the blockface captured before each section), is the most efficient because: (1) the percentage of errors of this registration method is very low owing to the thinness and good quality of the post-mortem data sets; and (2) the block-matching technique is robust to dissimilarities between sections, missing data, and outlying measurements (Ourselin et al, 2001).
Anatomy as Reference: The block-matching registration technique is based on both the section edges and the whole image, so the result of the 3D reconstruction will depend on the type of data (histological or autoradiographic) to be processed, that is to say, on the information available in the sections. Even if we chose the same reference section and despite the fact these were the same physical sections, independently registering histological and autoradiographic sections would not give the same result and would not allow a perfect superposition of each section, which is a prerequisite for the delineation of ROIs. It is not either possible to reuse the transformations computed during histological section registration to reconstruct the functional volume and vice versa. Indeed, histological and autoradiographic sections were extracted separately and consequently, they do not have the same configuration (dimensions of bounding boxes, computation of gravity centers). In this work, one of our objectives was to propose a joint 3D-geometry-based anatomo-functional exploitation of post-mortem data. Thus, the variability between the types of data presented problem. Hence, we had to develop a 3D reconstruction strategy providing an optimal anatomo-functional section-by-section superimposition. We chose a co-registration strategy: the reconstructed anatomical volume resulting from the registration of the histological sections was used as a reference for the reconstruction of the functional volume so that the 3D geometry remained the same for the two final volumes. Indeed, the diffusion of the radioactive tracer during tissue preparation limits the spatial resolving power of 2DG autoradiography (Gallistel and Nichols, 1983) and the morphologic accuracy of functional information from autoradiographic sections is limited. In contrast, the inner anatomical structures of the brain region encompassing VC, SC, and LGN are accurately visible on histological sections, allowing their accurate matching on adjacent sections. This is the reason why histological sections were used for section-to-section registration. The anatomical and functional volumes were successfully reconstructed for all five rats using this original reconstruction strategy and presented a fully consistent 3D geometry.
An Objective and Relevant Analysis of Functional Data Based on Anatomy
Each visual structure (VC, SC, and LGN) was segmented on the registered histological sections and directly mapped on the functional volume. The Nissl-stained sections provided sufficient anatomical information to guarantee a reproducible and less operator-dependent delineation of each visual structure. These segmentations were performed manually and could not be automated both due to the low contrast between the structures of interest and the surrounding ones and to their complex shape. Therefore, manual delineation of regions of interest remains time-consuming and may constitute a limitation of our method especially if numerous regions have to be included in the study. However, we provide the users new and relevant anatomical information relative to the shape and volume of various regions of interest that would be impossible to achieve in 2D.
Using this anatomical a priori knowledge, we discriminated activated subregions within the areas 17 and 18a of the VC, the SC, and both the ventral and dorsal LGN (LGNv and LGNd, respectively) (Figure 5D). These results are consistent with the literature (Rooney and Cooper, 1988; McIntosh and Cooper, 1989; Cooper and Allen, 1995). Our approach allowed computation of relative MRC using all the functional information contained in the activated and non-activated subregions; however small and restricted in spatial extent. The mean volumes of the activated subregion(s) were 0.17, 0.32, and 0.39 mm3 and covered 3, 10, and 16% of the entire right VC, SC, and LGN, respectively. Hence, because of their limited spatial resolution, imaging devices dedicated to small animals may not be able to locate the metabolic activation induced by such a visual stimulation in vivo. It is worth mentioning the low and rather variable values obtained for the activated subregions within the VC. The fact that the VC is a region difficult to accurately delineate and that our complex stimulation entailed a global and homogeneous metabolic activation encompassing the entire VC could explain these results. Despite the experiments were performed in conscious animals that could move their head during the stimulation, the whole functional parameters derived from these analyses appeared similar and consistent across animals, using only five rats. This confirms the validity of our approach, which combines thresholding (T = m + 2s.d. threshold is a commonly used criterion in biology for the extraction of activated subregions) and median-filter regularization, and shows its generic feature.
Providing a full description of the metabolic activation by automated extraction of the activated subregion without any a priori anatomical knowledge of its location within the entire RSC, the 3D-geometry-based analysis we have developed constitute an alternative to both a global approach in the entire RSC and to a 2D section-by-section approach. Part of the functional information provided by the metabolic response might be unexploited if not missed using a classic section-by-section approach. For example, in ~25% of the sections covering the entire metabolic activation, the activated area within the RSC was < 10% (too small to be visually detected in 2D). In addition, our 3D-geometry-based analysis automatically accommodated the anatomical shifts linked to dissymmetry in the sections associated with the sectioning process and thus ensures that CMRGlu comparisons between the right and left hemispheres involved corresponding anatomical regions. To illustrate this issue, we plotted the distribution profiles of the mean CMRGlu values for each consecutive manually segmented section of RSC and LSC in two animals: one whose brain was cut in an almost symmetric way (rat 4; Figure 7A) and one whose brain was cut in a slightly dissymmetric way (rat 2; Figure 7B). Full and dotted vertical lines respectively indicate the sections defining the start and the end of the activated and symmetrized subregions automatically computed using our analysis. The sections covering the activated and the symmetrized subregions were nearly identical for rat 4 (sections 43 to 108 for the activated subregion and sections 45 to 112 for the symmetrized subregion), whereas the sections covering the symmetrized subregion (sections 37 to 96) were shifted forward for rat 2 from the activated subregion (sections 29 to 89). Identification of these particular sections would have been impossible without our 3D-geometry-based analysis.
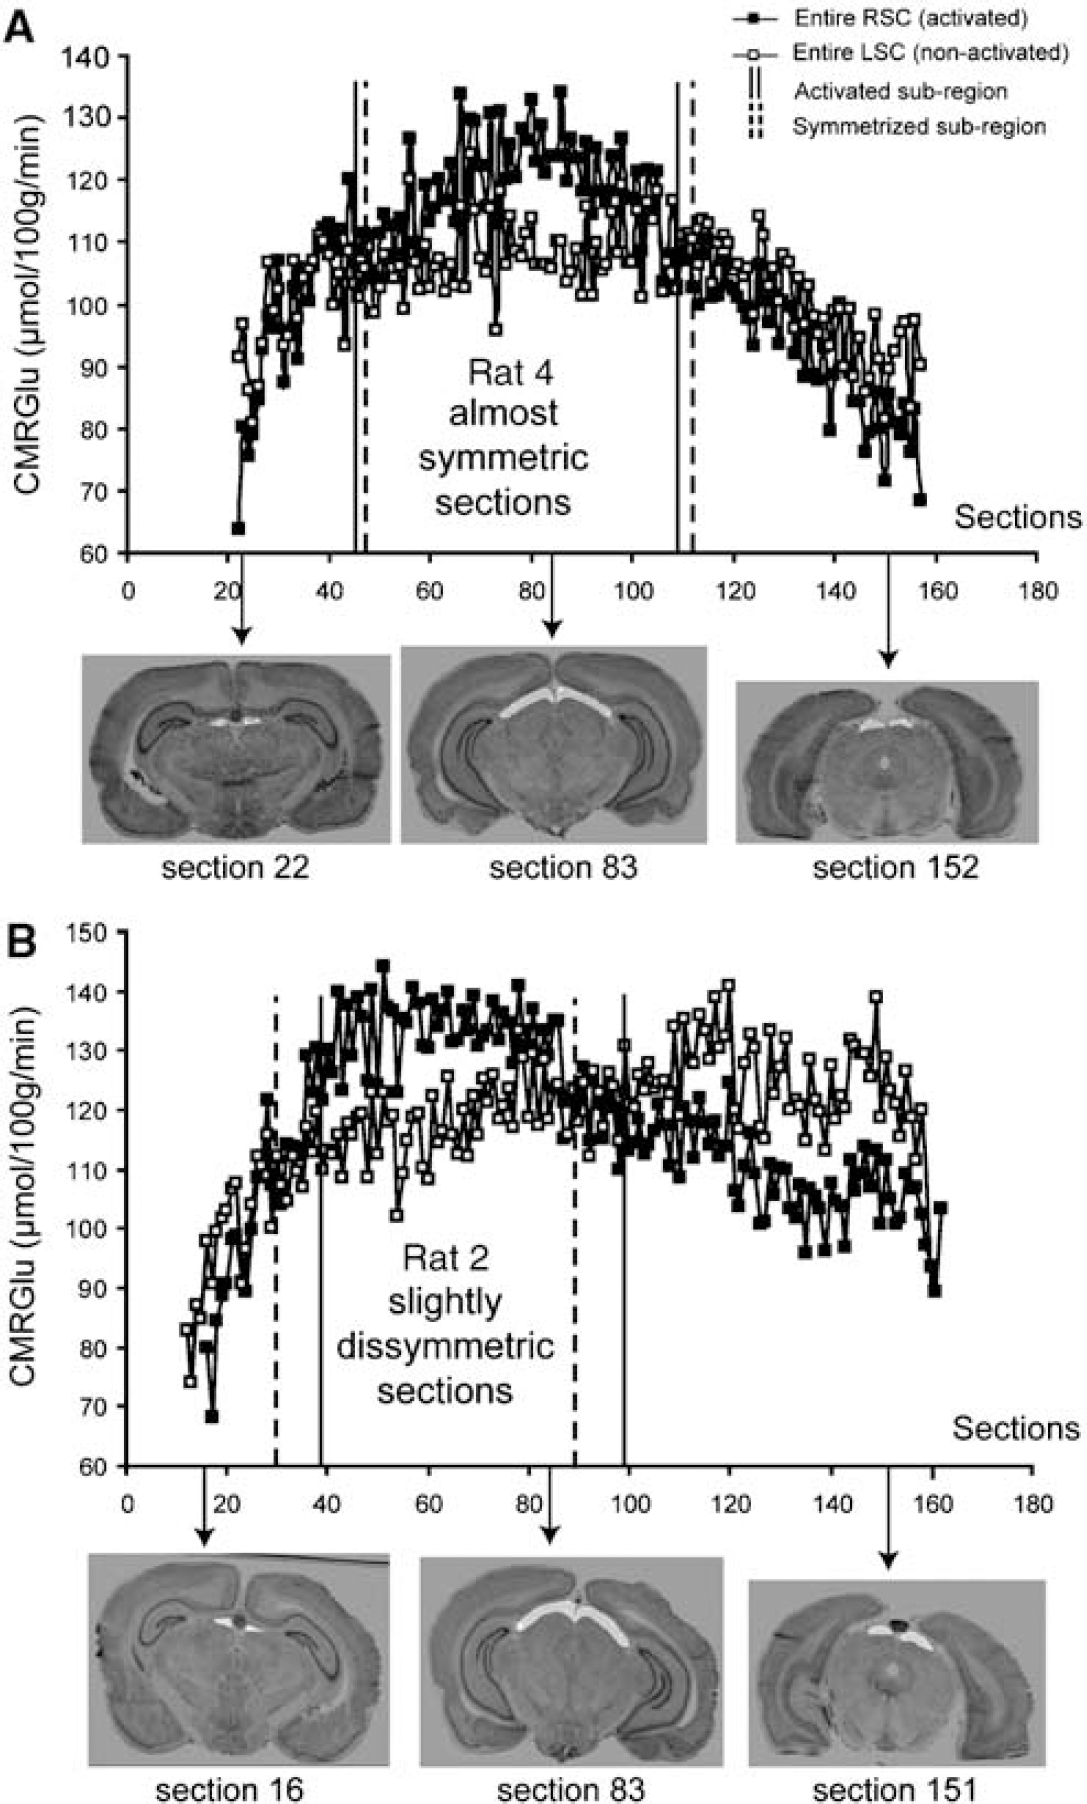
Distribution of the section-to-section CMRGlu values through the entire RSC and LSC in rat 4 (almost symmetric sections) (
In conclusion, we have described a generic and reliable toolbox for the processing of autoradiographic and corresponding histological rat brain sections. It features new functionalities that were never proposed before in any freeware (NIH-image) or commercial (MacPhase, VoxelView, 3D-Brain Station, and SURFdriver) programs: (1) a robust and fully automated procedure for extraction of sections from overall scans (including an automated section number assignment); (2) a reliable 3D reconstruction of anatomical and functional volumes based on the block-matching registration method and on a original strategy of co-registration of histological and autoradiographic sections; and (3) a novel approach for the analysis of functional post-mortem data based on the automated extraction of an ‘activated subregion’ and the determination of a corresponding ‘non-activated subregion’ using a symmetrization scheme in 3D. The automation of these tools and their integration into a graphical interface allowed operator-independent, rapid and easy processing of large data sets (~6000 sections). Moreover, it guaranteed the reproducibility and the objectivity of the results and enabled to envisage the investigation of a study population (including several animals). The system has been intensively validated in rats and can now easily be applied to other species including mice and extended to other activation models, domains of application (oncology, ischemia), or post-mortem imaging modalities. Afterwards, this toolbox will make possible to investigate new methods of analysis of 3D biologic data in groups of rodents, based on voxel-based statistical approaches and allowing rapid exploratory statistical studies of the whole brain without any anatomical a priori, complementarily with manual segmentation if needed (Schweinhardt et al, 2003; Nguyen et al, 2004; Lee et al, 2005). Our work underlines the capabilities of image processing techniques to support and contribute to the improvement of biologic research and open new perspectives for methodologic research in image processing. We are aiming to make our plugged-in modules soon available to all in the small animal post-mortem imaging community.
Footnotes
Acknowledgements
We are very grateful to Dr Yann Cointepas and Dr Denis Rivière for assisting with the toolbox implementation under BrainVISA environment and for providing helpful comments and suggestions.