
Abstract
Our recent report that fructose supported the metabolism of some, but not all axons, in the adult mouse optic nerve prompted us to investigate in detail fructose metabolism in this tissue, a typical central white matter tract, as these data imply efficient fructose metabolism in the central nervous system (CNS). In artificial cerebrospinal fluid containing 10 mmol/L glucose or 20 mmol/L fructose, the stimulus-evoked compound action potential (CAP) recorded from the optic nerve consisted of three stable peaks. Replacing 10 mmol/L glucose with 10 mmol/L fructose, however, caused delayed loss of the 1st CAP peak (the 2nd and 3rd CAP peaks were unaffected). Glycogen-derived metabolic substrate(s) temporarily sustained the 1st CAP peak in 10 mmol/L fructose, as depletion of tissue glycogen by a prior period of aglycaemia or high-frequency CAP discharge rendered fructose incapable of supporting the 1st CAP peak. Enzyme assays showed the presence of both hexokinase and fructokinase (both of which can phosphorylate fructose) in the optic nerve. In contrast, only hexokinase was expressed in cerebral cortex. Hexokinase in optic nerve had low affinity and low capacity with fructose as substrate, whereas fructokinase displayed high affinity and high capacity for fructose. These findings suggest an explanation for the curious fact that the fast conducting axons comprising the 1st peak of the CAP are not supported in 10 mmol/L fructose medium; these axons probably do not express fructokinase, a requirement for efficient fructose metabolism.
Introduction
Although it is widely agreed that glucose is the main energy substrate of the adult mammalian brain under resting conditions (McIlwain and Bachelard, 1985), it has been known for over half a century, however, that in vitro brain preparations can survive on nonglucose substrates in the total absence of exogenously applied glucose (McIlwain, 1953). This implies that it is the limiting permeability of the blood–brain barrier, rather than the brain's inability to metabolise substrates, that restricts the metabolic substrates the brain uses. It is clear, therefore, that glucose-derived energy substrates generated within the brain parenchyma, or blood–brain barrier-permeable substrates present in the systemic circulation in sufficient quantities, could contribute to fuel brain function.
One of the first nonglucose substrates shown to support the in vitro brain slice was the monosaccharide fructose (Bernheim and Bernheim, 1941; Klein, 1944; McIlwain, 1953). Fructose is absorbed from the small intestine (Blakemore et al, 1995) via the specialised glucose transporter, GLUT5 (Rand et al, 1993), and the majority cleared by the liver via fructokinase (Van den Berghe, 1994), although the kidney also plays a significant role in fructose metabolism (Mayes, 1993), hence circulating fructose levels are low, 50 to 100 μmol/L, although they can reach up to 0.5 mmol/L (Darakhshan et al, 1998). Fructokinase phosphorylates fructose to fructose-1-phosphate, which is converted by aldolase B to dihydroxyacetone and glyceraldehyde. The glyceraldehyde is metabolised by triose isomerase to glyceraldehyde-3-phosphate, which then enters the glycolytic pathway (Michal, 1999).
In order for metabolism of residual fructose in brain to occur, fructose must cross the blood brain-barrier and be taken up into brain cells, which in turn must efficiently metabolise fructose. Systemically administered fructose did not restore cortical activity in rabbits made hypoglycaemic by hepatectomy (Maddock et al, 1939), data supported by findings that there was minimal detection of radiolabelled fructose uptake into the brain (Oldendorf, 1971). This view of negligible fructose uptake into the brain is being reassessed. Because the GLUT5 transporter is found in tissues that metabolise fructose (Burant et al, 1992), its presence in the blood–brain barrier (Mantych et al, 1993) suggests fructose entry into the brain. For cells to metabolise fructose, they must be capable of taking up fructose, that is, the cells must possess the GLUT5 transporter. Until recently, GLUT5 was detected only in microglia in the central nervous system (CNS), its function unknown (Payne et al, 1997; Sasaki et al, 2004), but strengthening the case for the presence of fructose in the brain. Recently, the GLUT5 transporter has been shown in cerebellar Purkinje and granule cells in human fetus (Nualart et al, 1999) and Purkinje cells in mouse cerebellum (Funari et al, 2005). The function is not yet known but their presence does imply active fructose metabolism in this tissue.
In vitro cortical and hippocampal brain slices can metabolise fructose (Bernheim and Bernheim, 1941; Klein, 1944; McIlwain, 1953), although not as efficiently as glucose. In the cerebral cortex, fructose shows an equivalent oxidation to 58% of glucose (Weber et al, 2001), and in hippocampal slice 10 mmol/L fructose can support the energy levels (ATP and phosphocreatine), but results in a decrease in the population spike (Bachelard et al, 1984; Saitoh et al, 1994; Wada et al, 1998; Yamane et al, 2000). Increasing the fructose concentration to 20 mmol/L, both fully supports the energy levels and the population spike (Bachelard et al, 1984).
In this present paper, we have investigated the ability of fructose to support the stimulus evoked CAP in the adult mouse optic nerve (MON). The differential response of the peaks contributing to the CAP implies a significant difference in the metabolic properties of neighbouring axons. The ability of the 1st CAP peak to survive in 20 mmol/L, but not 10 mmol/L fructose, implies that the ability of fructose to be efficiently metabolised is not because of deficiencies in fructose transport, but rather because of selective expression of fructokinase in axons, a particularly appealing proposition as fructokinase activity has not previously been shown in central tissue.
Materials and methods
All procedures were performed in accordance with the Animals (Scientific Procedures) Act, 1986, under appropriate authority of project and personal licences.
Electrophysiology
Adult male CD-1 mice (30 to 35 g) were obtained from Charles Rivers, UK. The mice were killed by cervical dislocation and then decapitated. Optic nerves were dissected free and cut at the optic chiasm and behind the orbit. The optic nerves were gently freed from their dural sheaths and placed in an interface perfusion chamber (Medical Systems Corp., Greenvale, NY, USA) and maintained at 37°C and superfused with artificial cerebrospinal fluid (aCSF) containing (in mmol/L): NaCl 126, KCl 3.0, CaCl2 2.0, MgCl2 2.0, NaH2PO4 1.2, NaHCO3 26, and glucose 10. In some experiments, fructose was substituted for glucose, and appropriate osmotic compensations made when required. The chamber was continuously aerated by a humidified gas mixture of 95% O2/5% CO2. After dissection, optic nerves were allowed to equilibrate in standard aCSF for about 30 mins before beginning an experiment. Suction electrodes back-filled with the appropriate aCSF were used for stimulation and recording. One electrode was attached to the rostral end of the nerve for stimulation and the second suction electrode was attached to the proximal end of the nerve to record the compound action potential (CAP), thus all recordings were orthodromic. Stimulus pulse (30 μs duration) strength (Grass S88 dual output square pulse stimulator in combination with an SIU5 RF stimulus isolation unit; Grass, Astro-Med Inc., Slough, UK) was adjusted to evoke the maximum CAP possible and then increased another 25% (i.e., supramaximal stimulation). During an experiment, the supramaximal CAP was elicited every 10 secs. The recording electrode was connected to an Axoprobe 1A amplifier, whose conditioned output (x 10) was amplified 100 × (Tektronix D13 Dual Beam Conditioning Oscilloscope with 5A18N Dual Trace Amplifier), filtered at 30 kHz and acquired at 20 kHz.
Data Analysis and Curve Fitting
Optic nerve axon function was monitored quantitatively as the area under the CAP, which represents the best measure of the number of active axons as currents generated by individual axons within a fibre tract are considered to sum (Cummins et al, 1979; Stys et al, 1991). Data were acquired online (Digidata 1200A; Axon Instruments) using proprietary software (Axotape; Axon Instruments, Molecular Devices, Union City, CA, USA). The three individual peaks of the CAP were described by individual Gaussian fits of the form (Clampfit 8.0; Axon Instruments):
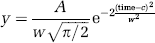
where A is the peak area, w is the width of peak at halfmaximum amplitude, and c the latency to maximum amplitude of the peak as described previously (Allen et al, 2006). Data are presented as means and standard deviation. Significance was determined using Student's t-test, where P < 0.05 was taken to indicate statistical significance.
Enzyme Assays
Tissue for enzyme assay was removed and immediately snap frozen in liquid nitrogen. Tissue was weighed and diluted to a concentration of 1:100 (brain) or 1:10 (MON) in the appropriate buffer.
Hexokinase assay: The hexokinase assay has previously been described in detail (Bachelard, 1989). Briefly, the typical assay contained 39 mmol/L triethanolamine buffer (pH 7.6), 7.8 mmol/L MgCl2, 1.1 mmol/L βNADP (nicotinamide adenine dinucleotide phosphate), 0.74 mmol/L ATP, 2.5 U of glucose-6-phosphate dehydrogenase plus sample, and varying concentrations of glucose. Absorbance was measured at 340 nm at 30°C.
Fructokinase assay: Tissue was removed from the animal and snap frozen in liquid nitrogen and stored at —80°C. Mouse optic nerves were diluted 1:10 in 50 mmol/L triethanolamine buffer (pH 7.6), whereas brain and liver samples were diluted 1:100. Sample homogenate (5 mL) (in triplicate) was added to a 96-well plate (total volume 260 ml) containing 100 μL of 250 mmol/L 4-(2-hydroxyethyl)-1-piperazineethanesulphonic acid (HEPES, pH 7.1), 10 μL of 250 mmol/L KCl, 10 μL of 10 mmol/L Na fluoride (to inhibit phosphoenolpyruvate conversion to 2-phosphoglycerate), 10 μL of mmol/L K2PO4, 10 μL of 0.25 mmol/L phosphoenolpyruvate, 20 μL of 0.15 mmol/L nicotinamide adenine dinucleotide (reduced form) NADH, 75 mL fructose (0.25 to 100 mmol/L), 5 μL lactate dehydrogenase (∼5U, EC 1.1.1.27), and 5 μL pyruvate kinase (∼1U, EC 2.7.1.40). The plate was preincubated at 37°C for 30 mins, and then the reaction was initiated by the addition of 10 μL of ice-cold 2.5 mmol/L MgATP. The assay was recorded over 30 mins at 37°C and the reaction sequence is displayed below. Enzyme activities were expressed as nmol/min per μg protein using an extinction coefficient (NADH) of 6.22 mmol/L per cm (Hagopian et al, 2005). Disappearance of absorption was measured at 340 nm at 30°C. The protein content was estimated using the Bio-Rad DC assay (based on methods of Lowry). Control experiments were performed in which substrates were omitted. In these cases, there was no measured activity. In the case where the enzymes were omitted, the background reading (less than 5% of the test reading) was subtracted from test experiments to control for ATPases.
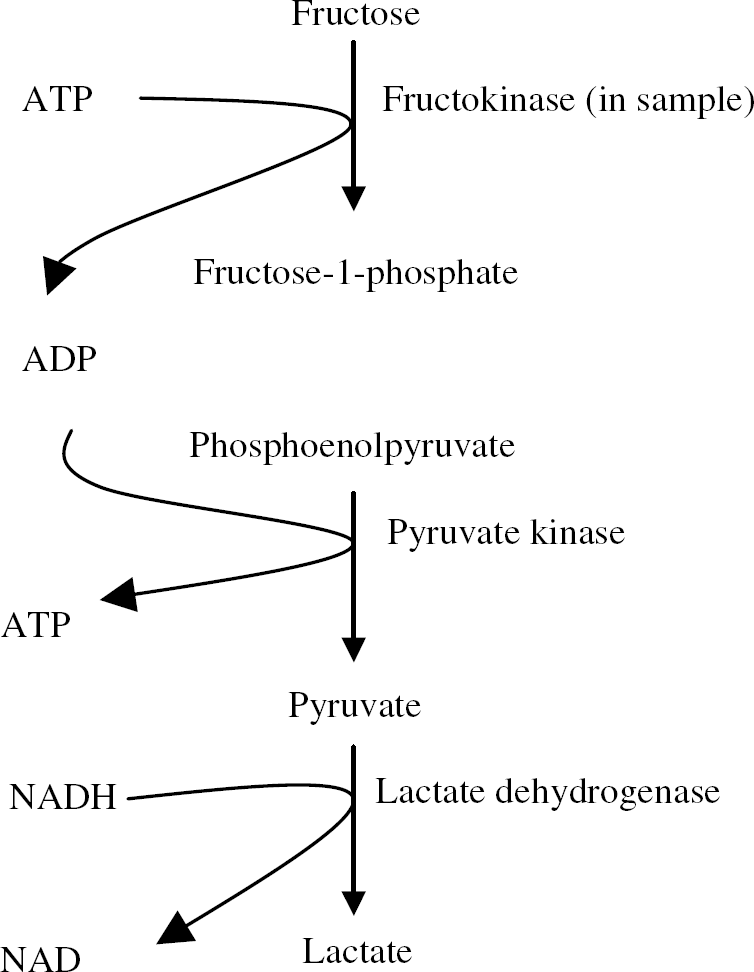
Estimates of Km and Vmax were made using best-fitting regression of Michaelis-Menton kinetics in the form:
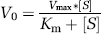
where V0 is enzyme activity, Km is the Michaelis constant defined as the substrate concentration at which enzyme velocity is half-maximal, Vmax is the maximal reaction rate, and [S] is the substrate concentration.
Western Blotting
Cytosolic fractions were prepared: 10% (w/v) whole-cell (WC) homogenate was centrifuged at 200,000g for 2 hours at 4°C, the supernatant was taken as the cytosolic fraction, and the samples were spun through a 10kDa filter (Millipore, Hatters Lane, Watford, UK). To concentrate the proteins in the fraction, proteins were precipitated using ice-cold acetone:ether (2:1) at 5 × sample volume. They were then spun at 5,000 r.p.m. on a bench top centrifuge (Eppendorf 5415c) for 5 mins at room temperature. The supernatant was discarded and the pellet washed 3 × using ice-cold ether: Industrial methylated spirits (IMS):H2O (10:7:1) at 5 × original sample volume. This was achieved by resuspending the pellet in the wash buffer, spinning at 5,000 r.p.m. for 5 mins at room temperature and discarding the supernatant. After the final wash, the remaining pellet was air dried for >15 mins in a fumehood to let any remaining wash buffer evaporate. Samples prepared by protein precipitation were resuspended in 10 mmol/L Tris-HCl (pH 8.0), and the protein content estimated using the Bio-Rad DC assay (based on methods of Lowry). Samples were diluted with sodium dodecyl sulphate (SDS) sample buffer (25 mmol/L Tris, 25 mmol/L dithiothretiol (DTT), 2% (w/v) SDS, 10% (v/v) glycerol, and 0.01% (w/v) bromophenol blue) to give protein content of 40 μg/lane in a 20 μL sample for liver, kidney, and brain, but 150 μg/lane for optic nerve. The samples were boiled for 5 mins. Samples were then run on a 5% to 20% SDS polyacrylamide gel for 2 hours at 40 mA. Proteins were then electrotransferred onto a nitrocellulose membrane (Amersham, Amersham Place, Buckinghamshire, UK), using standard blotting buffer (25 mmol/L Tris, 200 mmol/L glycine in 20% (v/v) methanol), run at 40 mA overnight. The blot was blocked using 4% Marvel in 1 × TBS (Tris-buffered saline-10 mmol/L Tris and 150 mmol/L NaCl, pH 7.5) for 1hour at room temperature, and then incubated with the primary antibody (anti-fructokinase immunoglobulin (Ig γ, 1:5,500 dilution; Genway Biotech Inc., San Diego, CA, USA) for 2 hours at room temperature in 4% Marvel in 1 × TBS. It was then washed with TBS containing 0.005% Tween-20, then incubated with the secondary antibody (rabbit polyclonal to chicken, 1:1,000 dilution; Abcam, Milton Road, Cambridge, UK) for 1.5 hours at room temperature in 4% Marvel in 1 × TBS. The membrane was developed using an ECL detection kit (Amersham).
Immunohistochemistry
Sections (10 μm) were cut on a cryostat, thaw-mounted onto superfrost slides (Fischer Scientific, Bishop Meadow Road, Loughborough, UK), and stored at —80°C. Sections were then warmed at room temperature for 15 to 30 mins before being processed for immunohistochemistry. Tissue sections were fixed in 100% ethanol for 15 mins, flooded with phosphate-buffered saline (PBS; phosphate-buffered saline tablets BR00146; Oxoid Ltd, Basingstoke, Hampshire, UK), and then rinsed in PBS twice, for 5 mins each time, then rinsed three times for 3 mins in Buffer 1 (PBS + 1% bovine serum albumin + 0.002% Tween-20). Sections were then blocked in Buffer 1 plus normal goat serum (NGS) and normal rabbit serum (NRS) at room temperature for 40 mins. The tissue sections were then incubated in appropriate antibody diluted in Buffer 1 at room temperature for 1.5 hours. Primary antibodies: anti-ketohexokinase (fructokinase) 1:200 dilution chicken IgY (Genway Biotech Inc., San Diego, CA, USA); anti-GFAP (glial fibrillary acidic protein; SIGMA G3893) 1:1000 mouse ascites (Sigma-Aldrich Company Ltd, Poole, Dorset, UK); anti-neurofilament (SIGMA N0142) 1:400 mouse monoclonal Clone No. N52; and anti-tubulin (SIGMA T5168) 1:2,000 mouse ascites Clone No. 8-5-1-2. The tissue sections were rinsed for three times 3 mins in Buffer 1. Secondary antibodies: Rabbit polyclonal to chicken IgY heavy and light (fluorescein isothiocyanate-labelled 488 nm, Abcam ab6749) diluted 1:500. Goat anti-mouse IgG (tetramethyl rhodamine isothiocyanate labelled 568 nm, Molecular Probes A-11031) diluted 1:500 incubated for 1 hour at room temperature. The tissue sections were then rinsed three times with Buffer 1 and two times in PBS followed by a 15 mins rinse in PBS, coverslipped with Citifluor AF1, sealed with nail polish, and viewed with a Leica TCS SP2SE confocal microscope running Leica confocal software. Control sections were incubated in NRS and NGS, or the primary and secondary antibody was omitted, and no specific staining was observed.
Results
Effect of Fructose on the Compound Action Potential
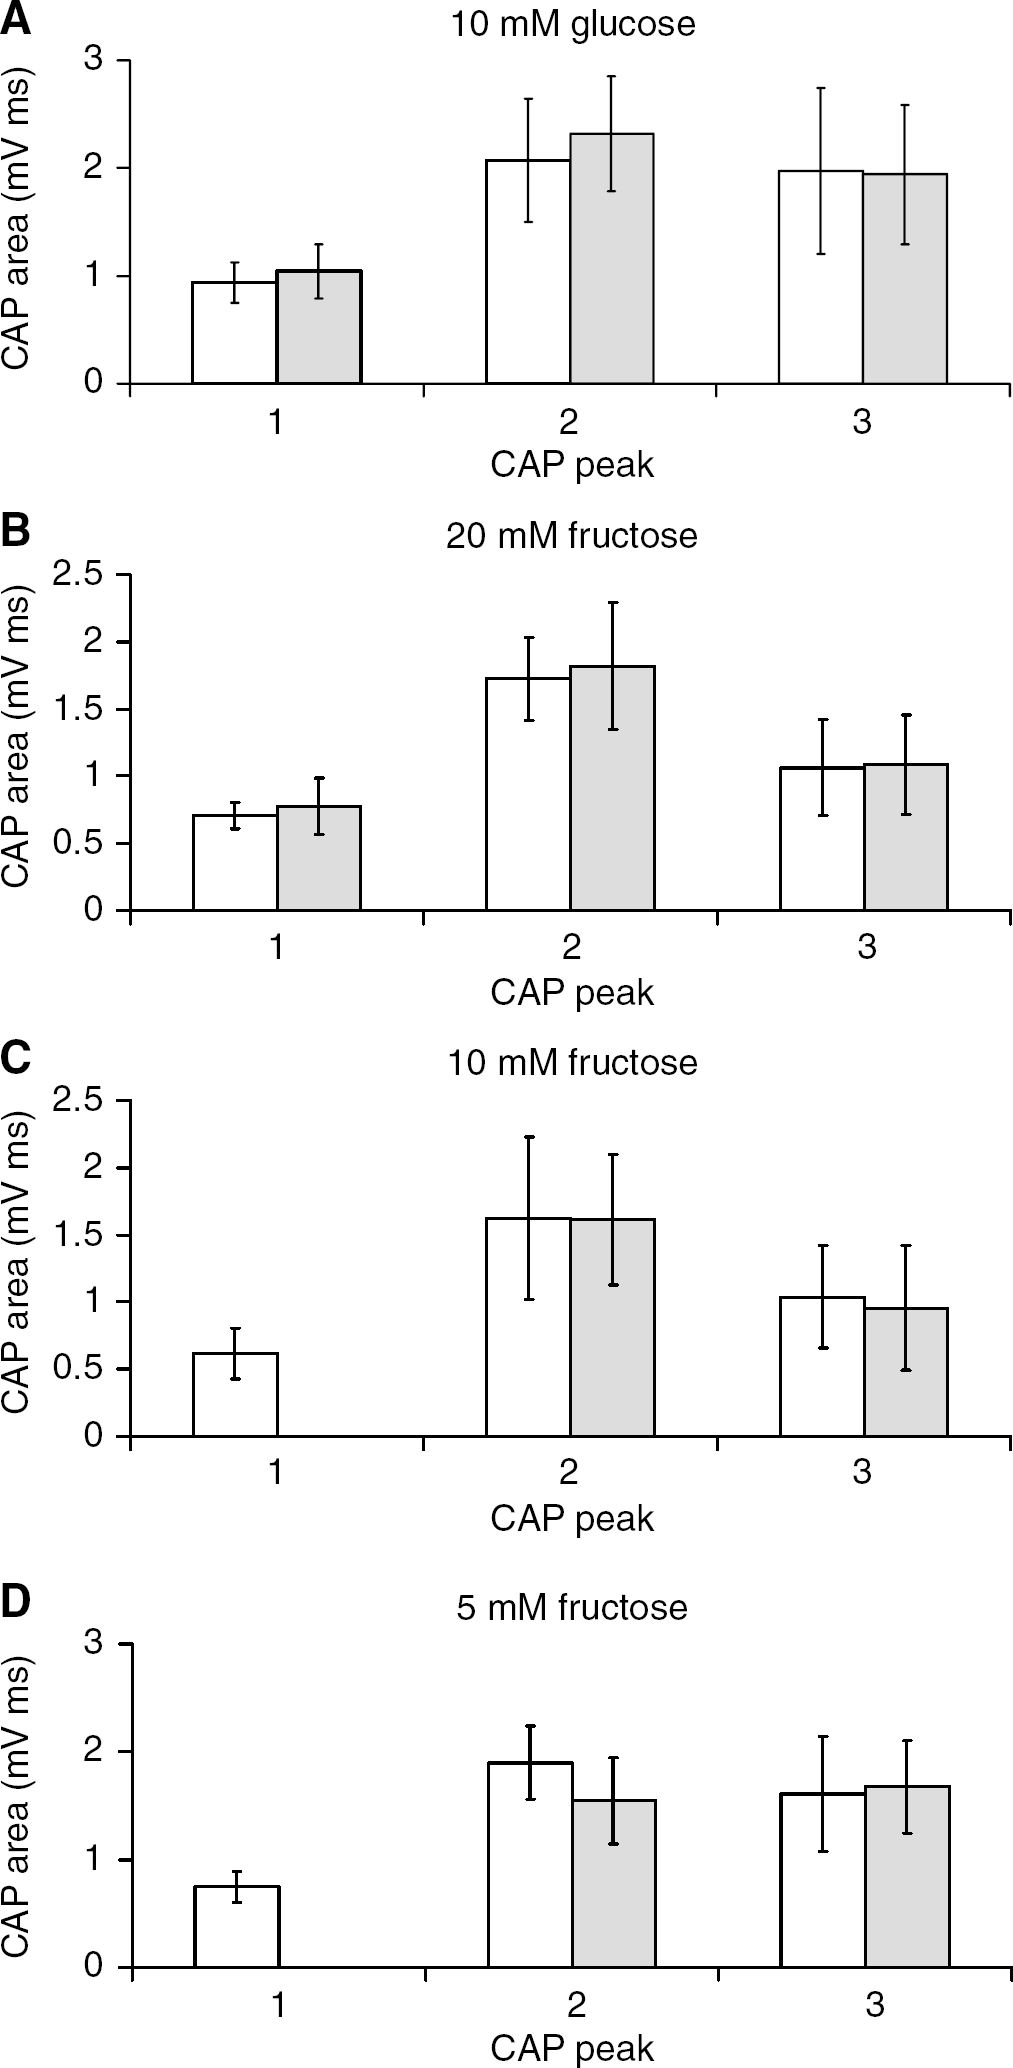
Supramaximal stimulus of the MON evoked a triple peaked CAP typical of the rodent preparation (Figure 1B), which could be accurately fit by the sum of three Gaussian peaks (Allen et al, 2006), and was stable of over several hours when perfused with aCSF containing 10 mmol/L glucose, as described previously (Figure 1A; Brown et al, 2003). The individual peaks of the CAP recorded at 60 and 180 mins in the presence of 10 mmol/L glucose aCSF showed no significant differences (1st CAP peak 0.94 ± 0.18 versus 1.04 ± 0.25 mV ms, 2nd CAP peak 2.8 ± 0.57 versus 2.32 ± 0.53 mV ms, and 3rd CAP peak 1.98 + 0.77 versus 1.94 ± 0.65 mV ms, n = 6; Figure 2A). Replacing 10 mmol/L glucose with 20 mmol/L fructose had no significant effect on the CAP, and a stable CAP was maintained for 2 hours in the presence of 20 mmol/L fructose (Figures 1C and 1D). The individual peak areas of the CAP recorded at 60 and 180 mins (after 2 hours exposure to 20 mmol/L fructose) were: 1st CAP peak 0.71 ± 0.10 versus 0.78 ± 0.21 mVms, 2nd CAP peak 1.73 ± 0.31 versus 1.82 ± 0.47 mVms, and 3rd CAP peak 1.06 ± 0.36 versus 1.09 ± 0.37 mV ms, n = 4 (Figure 2B). Substitution of 10 mmol/L glucose with 10 mmol/L fructose, however, resulted in a delayed decrease in the CAP area (Allen et al, 2006), although even after 2 hours in the presence of 10 mmol/L fructose the total CAP area was 84.8% ± 28.4% of the baseline value (Figures 1E and 1F). Closer investigation revealed that the 1st CAP peak fell after about 30 mins and continued to decrease from that point until it was completely lost, whereas the 2nd and 3rd CAP peaks were not significantly affected by the addition of 10 mmol/L fructose (Figure 1F) as reported previously (Allen et al, 2006). The individual peaks of the CAP recorded at 60 and 180 mins (after 2 hours exposure to 10 mmol/L fructose), were: 1st CAP peak 0.62 ± 0.19 versus 0 mVms, 2nd CAP peak 1.62 ± 0.60 versus 1.61 ± 0.49 mV ms, and 3rd CAP peak 1.04 ± 0.38 versus 0.96 ± 0.46 mV ms, n =7 (Figure 2C). Replacing 10 mmol/L glucose with 5 mmol/L fructose resulted in a more rapid loss of the 1st CAP peak, combined with a small but insignificant decrease in the 2nd and 3rd CAP peaks (Figures 1G and 1H): 1st CAP peak 0.75 ± 0.14 versus 0 mVms, 2nd CAP peak 1.90+ 0.34 versus 1.55 ± 0.40 mVms (P =0.317, NS), and 3rd CAP peak 1.61 ± 0.54 versus 1.67 ± 0.43 mVms, n = 4 (Figure 2D). Thus, in the presence of aCSF containing 5 to 10 mmol/L fructose, the 2nd and 3rd CAP peaks can be supported for extended periods of time, but the 1st CAP peak is rapidly lost.
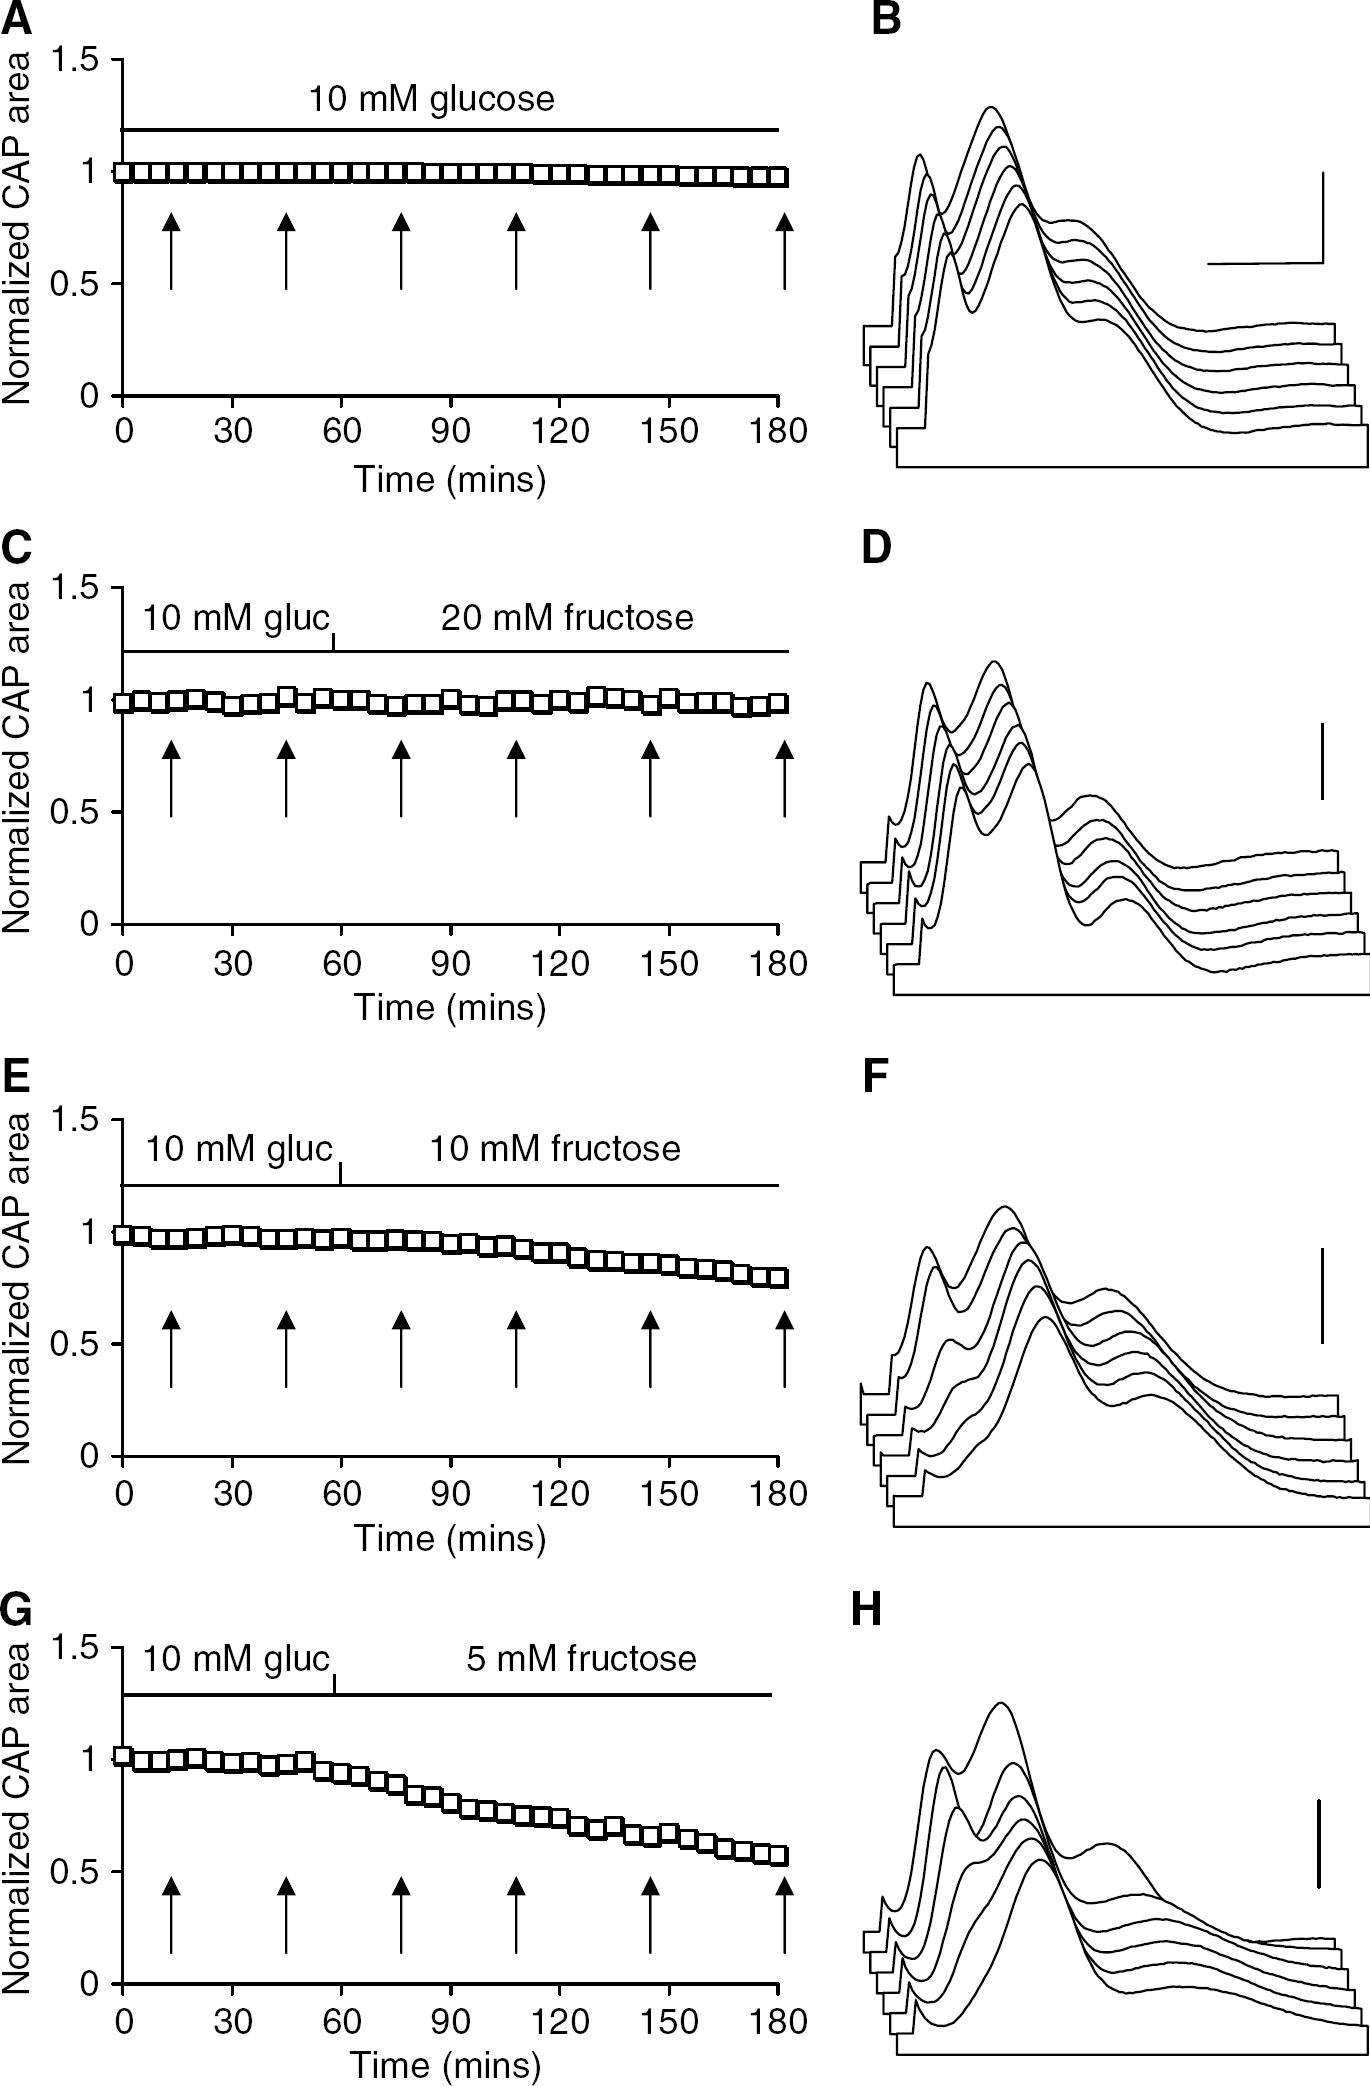
Effect of various concentrations of fructose on the compound action potential (CAP). (
Effect of various fructose concentrations the individual compound action potential (CAP) peak areas. (
Fructose Cannot Support the 1st Compound Action Potential Peak in the Absence of Glycogen
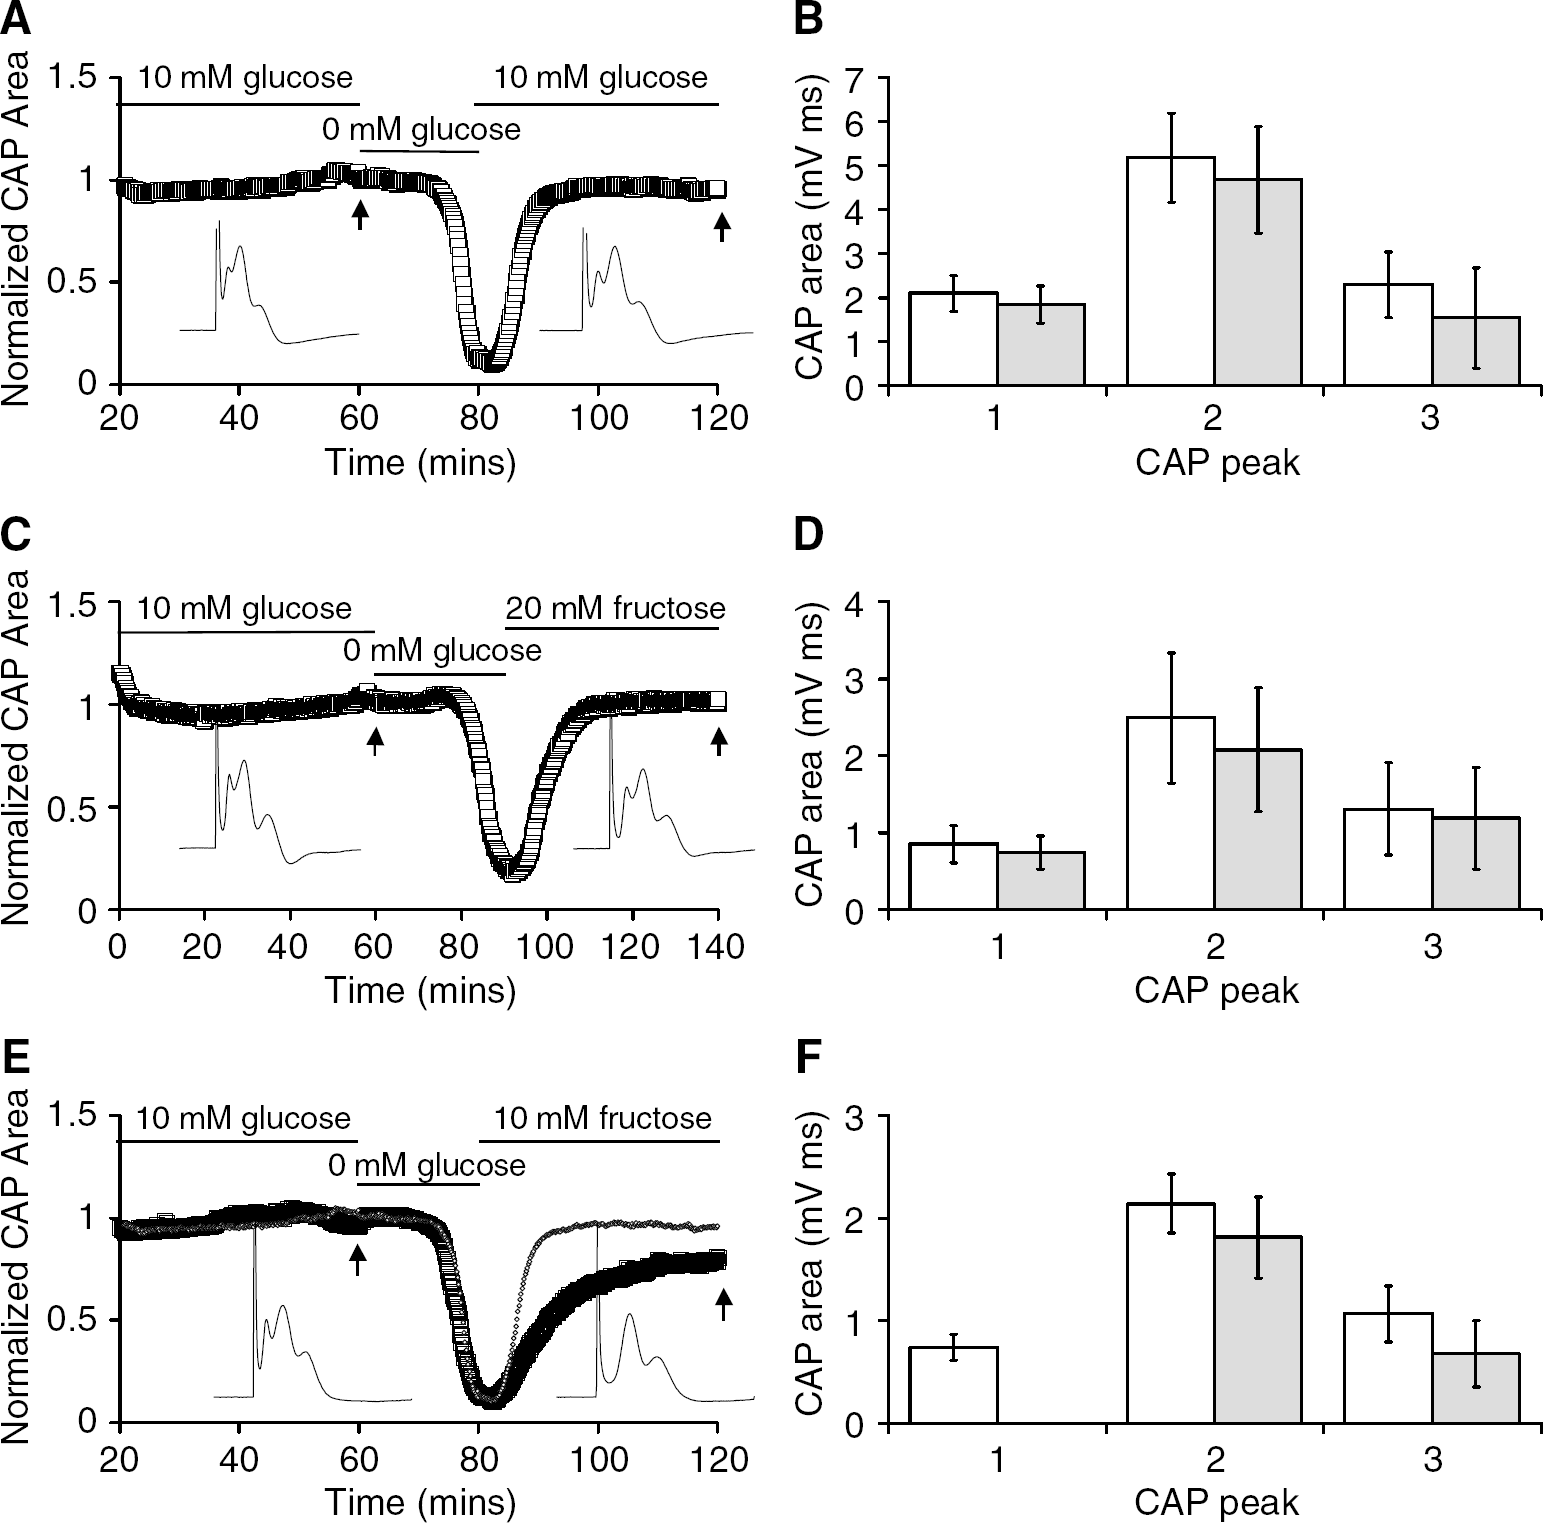
These data suggest that an endogenous compound within the MON is sustaining the 1st CAP peak during the initial 30 mins in 10 mmol/L fructose. A prime candidate for this compound is glycogen, which is located exclusively in astrocytes (Cataldo and Broadwell, 1986), as we have previously shown that glycogen can support MON function during both hypo- and aglycaemia (Brown et al, 2003). The glycogen is metabolised during aglycaemia to L-lactate, which is subsequently shuttled out of the astrocyte and taken up by the axon, where it is metabolised (Baltan Tekkök et al, 2005; Brown et al, 2003). However, once the glycogen levels are depleted during aglycaemia, the CAP fails, thus an indication of exhaustion of glycogen content is the onset of CAP failure (Brown et al, 2003). We exposed the MONs to glucose-free aCSF for 25 mins and during this time the CAP was maintained for 20.6 ± 3.8 mins (n = 5), but it then fell from this point to zero (Figure 3A). Subsequent addition of 10 mmol/L glucose aCSF resulted in almost complete recovery of CAP function to 95.9% ± 4.4% of baseline levels (Figure 3A). The 1st CAP peak recovered to 1.85 ± 0.42 versus 2.10 ± 0.40 mVms (NS), the 2nd CAP peak recovered to 4.68 ± 1.22 versus 5.18 ± 1.01 mVms (NS), and the 3rd CAP peak recovered to 1.54 ± 1.13 versus 2.30 + 0.75 mVms (NS, n = 5; Figure 3B). Recovery in 20 mmol/L fructose after a 25-min period of aglycaemia produced results that were qualitatively identical to those in 10 mmol/L glucose (Figure 3C). The 1st CAP peak recovered to 0.85 ± 0.24 versus 0.74 ± 0.22 mVms (NS), the 2nd CAP peak recovered to 2.49 ± 0.85 versus 2.08 ± 0.81 mVms (NS), and the 3rd CAP peak recovered to 1.30 ± 0.60 versus 1.19 + 0.66 mVms (NS, n = 5; Figure 3D). However, in 10 mmol/L fructose compared with 10 mmol/L glucose or 20 mmol/L fructose, the CAP recovery was slower and less complete, 78.3% ± 8.9% of control (n = 5, Figure 3E), significantly less than the recovery in 10 mmol/L glucose (P < 0.005). This was because of the total loss of the 1st CAP peak (0.74 ± 0.13 versus 0 mVms), but the 2nd (2.14 ± 0.29 versus 1.81 ± 0.40 mVms, NS) and 3rd CAP peaks (1.07 ± 0.27 versus 0.68 ± 0.33 mV ms, NS) were not significantly different from the baseline levels (n = 5; Figure 3F). These data indicate that once glycogen levels are depleted, 10 mmol/L fructose cannot support function in the axons contributing to the 1st CAP peak.
Effect of depleting glycogen content on the ability of fructose to support the compound action potential (CAP). (
Increased Energy Demand Reduces the Ability of Fructose to Support the Compound Action Potential
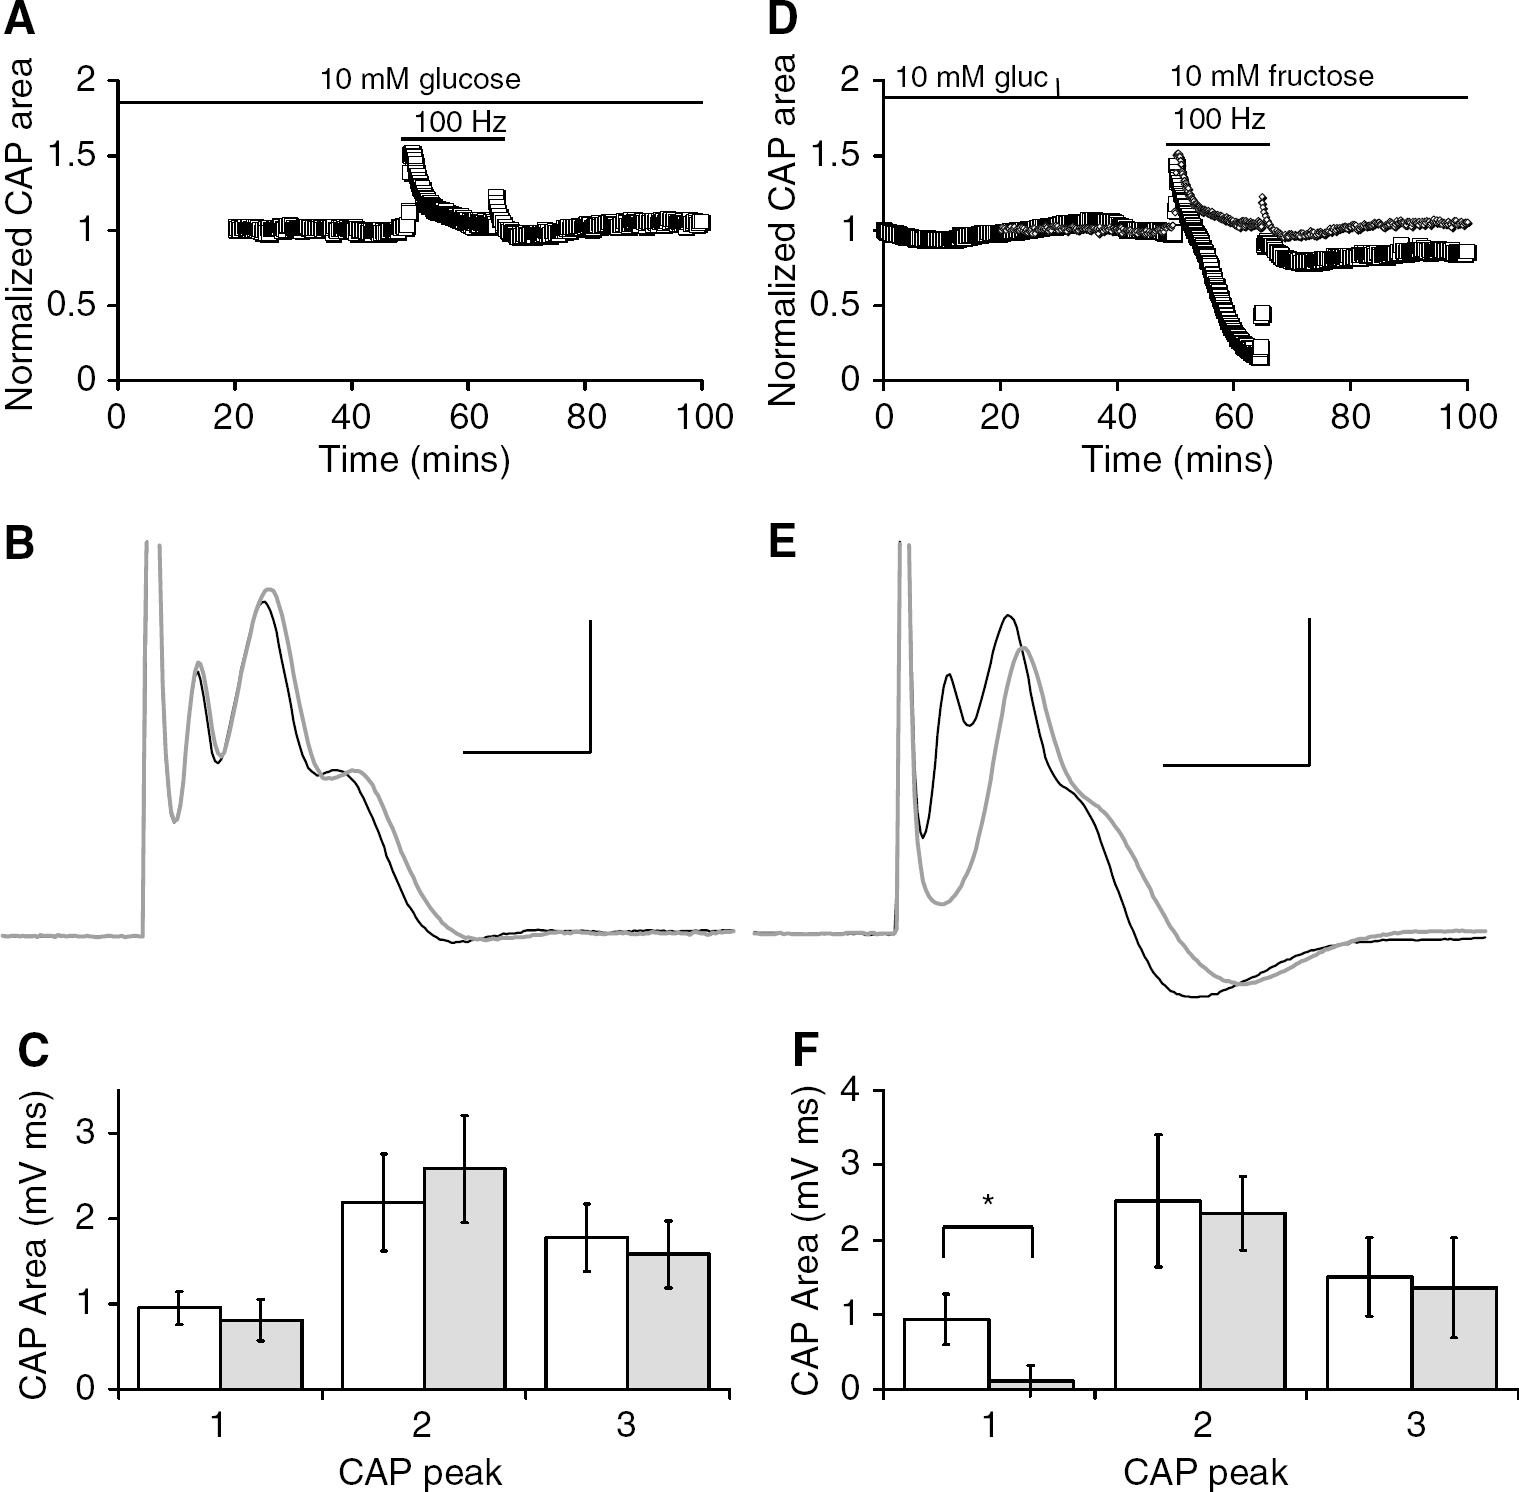
To further test the role of glycogen in supporting the 1st CAP peak in the presence of 10 mmol/L fructose, we increased the metabolic demand on the tissue, which we have previously shown to significantly deplete glycogen content (Brown et al, 2003). A 15-min period of 100 Hz stimulation was imposed on the nerve followed by a recovery period in either 10 mmol/L glucose or 10 mmol/L fructose. In MONs bathed in 10 mmol/L glucose 100 Hz stimuli did not have a significant effect on the total CAP area, which was maintained at baseline levels for the duration of the stimulus. During the recovery period in 10 mmol/L glucose, the total CAP area was maintained at baseline levels (Figures 4A and 4B), indicating that no irreversible injury had occurred. This was borne out when comparisons were made of the CAP peaks before and after the stimulus; there was no significant effect on the peak areas (1st CAP peak 0.95 ± 0.19 versus 0.79 ± 0.24 mVms, NS; 2nd CAP peak 2.18 ± 0.57 versus 2.53 ± 0.63 mVms, NS; 3rd CAP peak 1.77 ± 0.40 versus 1.57 ± 0.39 mVms, NS, n = 5; Figure 4C). However, when 10 mmol/L glucose was replaced with 10 mmol/L fructose 20 mins before the stimulus, the total CAP fell significantly once the stimulus was imposed (Figure 4D) and recovery was only partial as the 1st CAP peak area was significantly reduced from 0.93 ± 0.33 to 0.11 ± 0.21 mV ms (P < 0.005). The 2nd (2.52 ± 0.88 versus 2.35 ± 0.49 mVms) and 3rd CAP peaks (1.50 ± 0.52 versus 1.35 ± 0.57 mVms) were not significantly affected (n = 5; Figures 4E and 4F).
Effect of increased tissue energy demand on the ability of fructose to support the compound action potential (CAP). (
Hexokinase and Fructokinase Activity
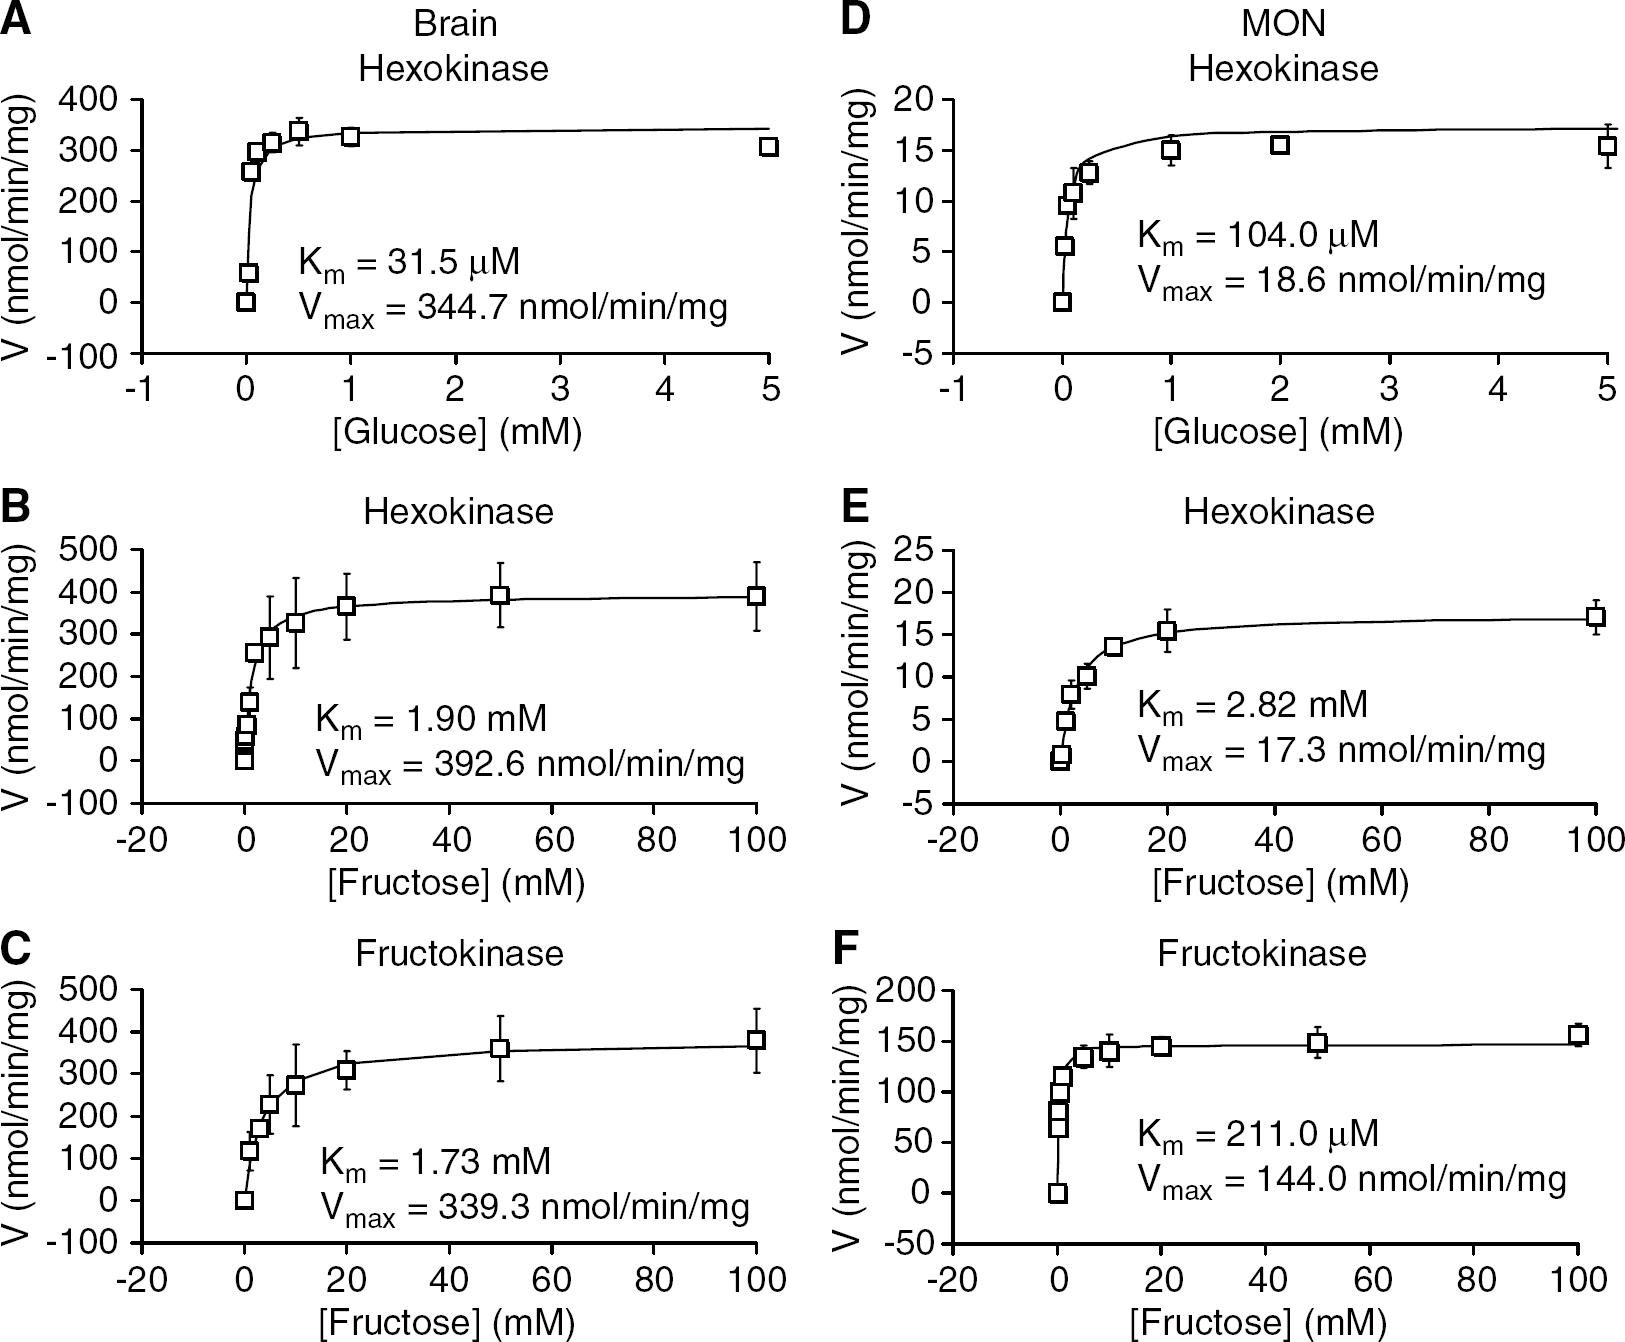
To determine the pathway of fructose metabolism in the MON, we performed enzyme assays to identify the activity of specific enzymes. Hexokinase assays of brain (occipital cortex) were performed for the sake of comparison, as the kinetic parameters of brain hexokinase are well established (McIlwain and Bachelard, 1985). The concentration dependence of brain hexokinase with glucose as substrate yielded a Km of 31.5 ± 1.5 μmol/L and a Vmax of 344.7 ± 17.5nmol/min per mg protein (n = 3; Figure 5A), which is consistent with previously published results (McIlwain and Bachelard, 1985; Newsholme and Leech, 1983). As hexokinase can phosphorylate fructose to fructose-6-phosphate, as well as glucose to glucose-6-phosphate, we determined the relationship between fructose concentrations and hexokinase activity and found the Km increased to 1.90 ± 0.45 mmol/L with a Vmax of 392.6 ± 13.6 nmol/min per mg protein (n = 3; Figure 5B). This increase in the Km of hexokinase with fructose as substrate has been reported previously (McIlwain and Bachelard, 1985; Newsholme and Leech, 1983; Sols and Crane, 1954). We next sought to determine if there was any fructokinase activity in the brain. Fructokinase assays in cortical brain tissue with fructose as substrate yielded a similar kinetic profile (Km=1.73 ± 0.99 mmol/L; Vmax 339.3 ± 44.1 nmol/min per mg protein, n = 3; Figure 5C) to the hexokinase assay with fructose as substrate. As the principal behind the fructokinase assay is dephosphorylation of ATP to ADP, which can occur with either hexokinase (fructose → fructose-6-phosphate) or fructokinase (fructose → fructose-1-phosphate), we concluded that there was little to no fructokinase activity in cortical tissue.
Kinetic analysis of hexokinase and fructokinase in cortical brain tissue (
We performed similar experiments in the MON. With glucose as a substrate the Km and Vmax for hexokinase were 104.0 ± 34.0 μmol/L and 18.6 ± 2.3 nmol/min per mg protein, respectively (n = 3; Figure 5D), whereas with fructose as a substrate, the Km and Vmax were 2.82 ± 0.08 mmol/L and 17.3 ± 2.42 nmol/min per mg protein, respectively (n = 3; Figure 5E). However fructokinase assays revealed a significant difference in the ability of the respective enzymes to phosphorylate fructose. The Km was 211.0 ± 11.3 mmol/L and the Vmax 144.0 ± 10.4 nmol/min per mg protein (n = 3; Figure 5F), that is, fructose was ‘efficiently’ metabolised in MON.
To further investigate the capacity of fructokinase and hexokinase to phosphorylate fructose in the brain or MON, we performed assays using a saturating concentration of the substrate (20 mmol/L fructose). In the cortical brain tissue, there was no significant difference in the reaction rate for hexokinase or fructokinase, respectively (302.5 ± 116.7 versus 307.9 ± 153.3 nmol/min per mg, n = 9; Figure 6). However in MON, the Vmax was far greater for fructokinase than for hexokinase (111.9 ± 45.6 versus 9.9 ± 7.4 nmol/min per mg, n = 9), again reinforcing efficient fructose metabolism in the MON compared with the cortex.
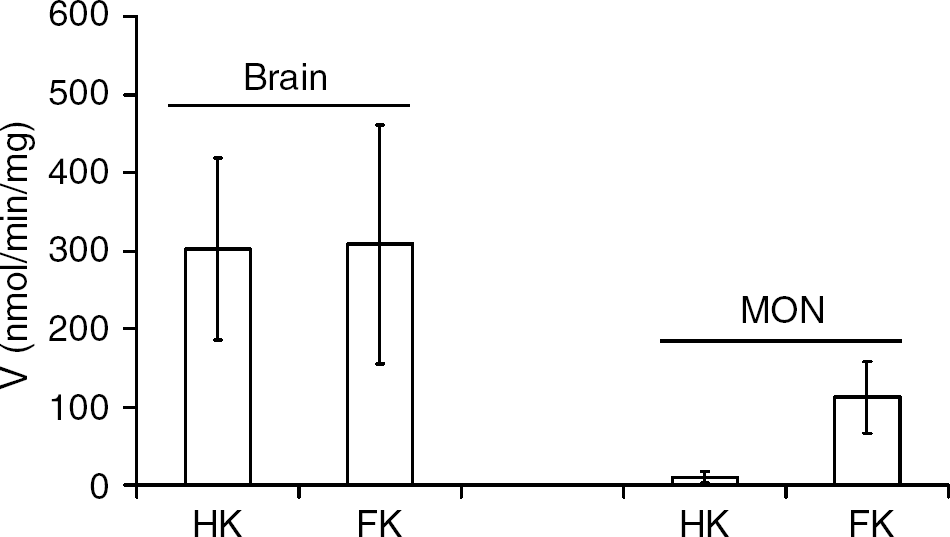
Enzyme activities of fructose metabolism in the brain and mouse optic nerve (MON). Enzyme activities were measured from brain and MON tissue, with 20 mmol/L fructose as substrate. HK = hexokinase; FK = fructokinase.
Fructokinase Expression in Optic Nerve
Western blotting revealed that fructokinase was detected in the liver and kidney as expected (Mayes, 1993), but was absent from the brain (Figure 7). However, fructokinase was detected in the optic nerve, although at a lower density than in liver or kidney.
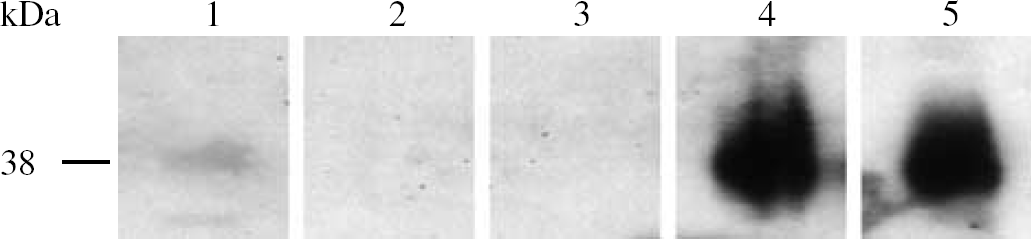
Representative Western blot of fructokinase content in mouse liver, kidney, brain, and optic nerve. All lanes are from the same gel and exposed to the film for the same length of time. Redundant lanes have been cropped and omitted. Lane 1—optic nerve; lane 2—blank; lane 3—brain; lane 4—liver; and lane 5—kidney.
Immunohistochemical labellings were performed to confirm the presence of fructokinase in the MON axons. As a preliminary step sections of liver were doubly labelled with anti-tubulin and anti-fructokinase antibodies to highlight the pattern of hepatocyte fructokinase expression. The outline of the hepatocytes could clearly be seen and the fructokinase was expressed within the cell membrane and throughout the cytoplasm, but as expected, was absent from the nucleus of the cell (Figure 8A). Double labelling with anti-GFAP and anti-fructokinase antibodies showed an astrocytic presence of fructokinase (Figure 8B). As with the hepatocytes, the fructokinase was localised at the cell membrane and throughout the cytoplasm, but was absent from the nucleus. In MON sections co-labelled with antineurofilament and anti-fructokinase, there was a degree of co-localisation as indicated by the regions of orange (Figure 8C). The red staining in the middle panel indicates axons cut in cross-section. While there is considerable colocalisation indicating the presence of fructokinase on axons, fructokinase staining was also present in a cell in the left centre of the left panel, most likely an astrocyte. Higher power images reveal that there were large axons present (diameter ∼ μm) that did not label with fructokinase (Figure 8D, right panel), which corresponds well with our functional and assay data, which led us to hypothesise that fructokinase was present in a select population of axons, those of smaller diameter contributing to the 2nd and 3rd CAP peaks.
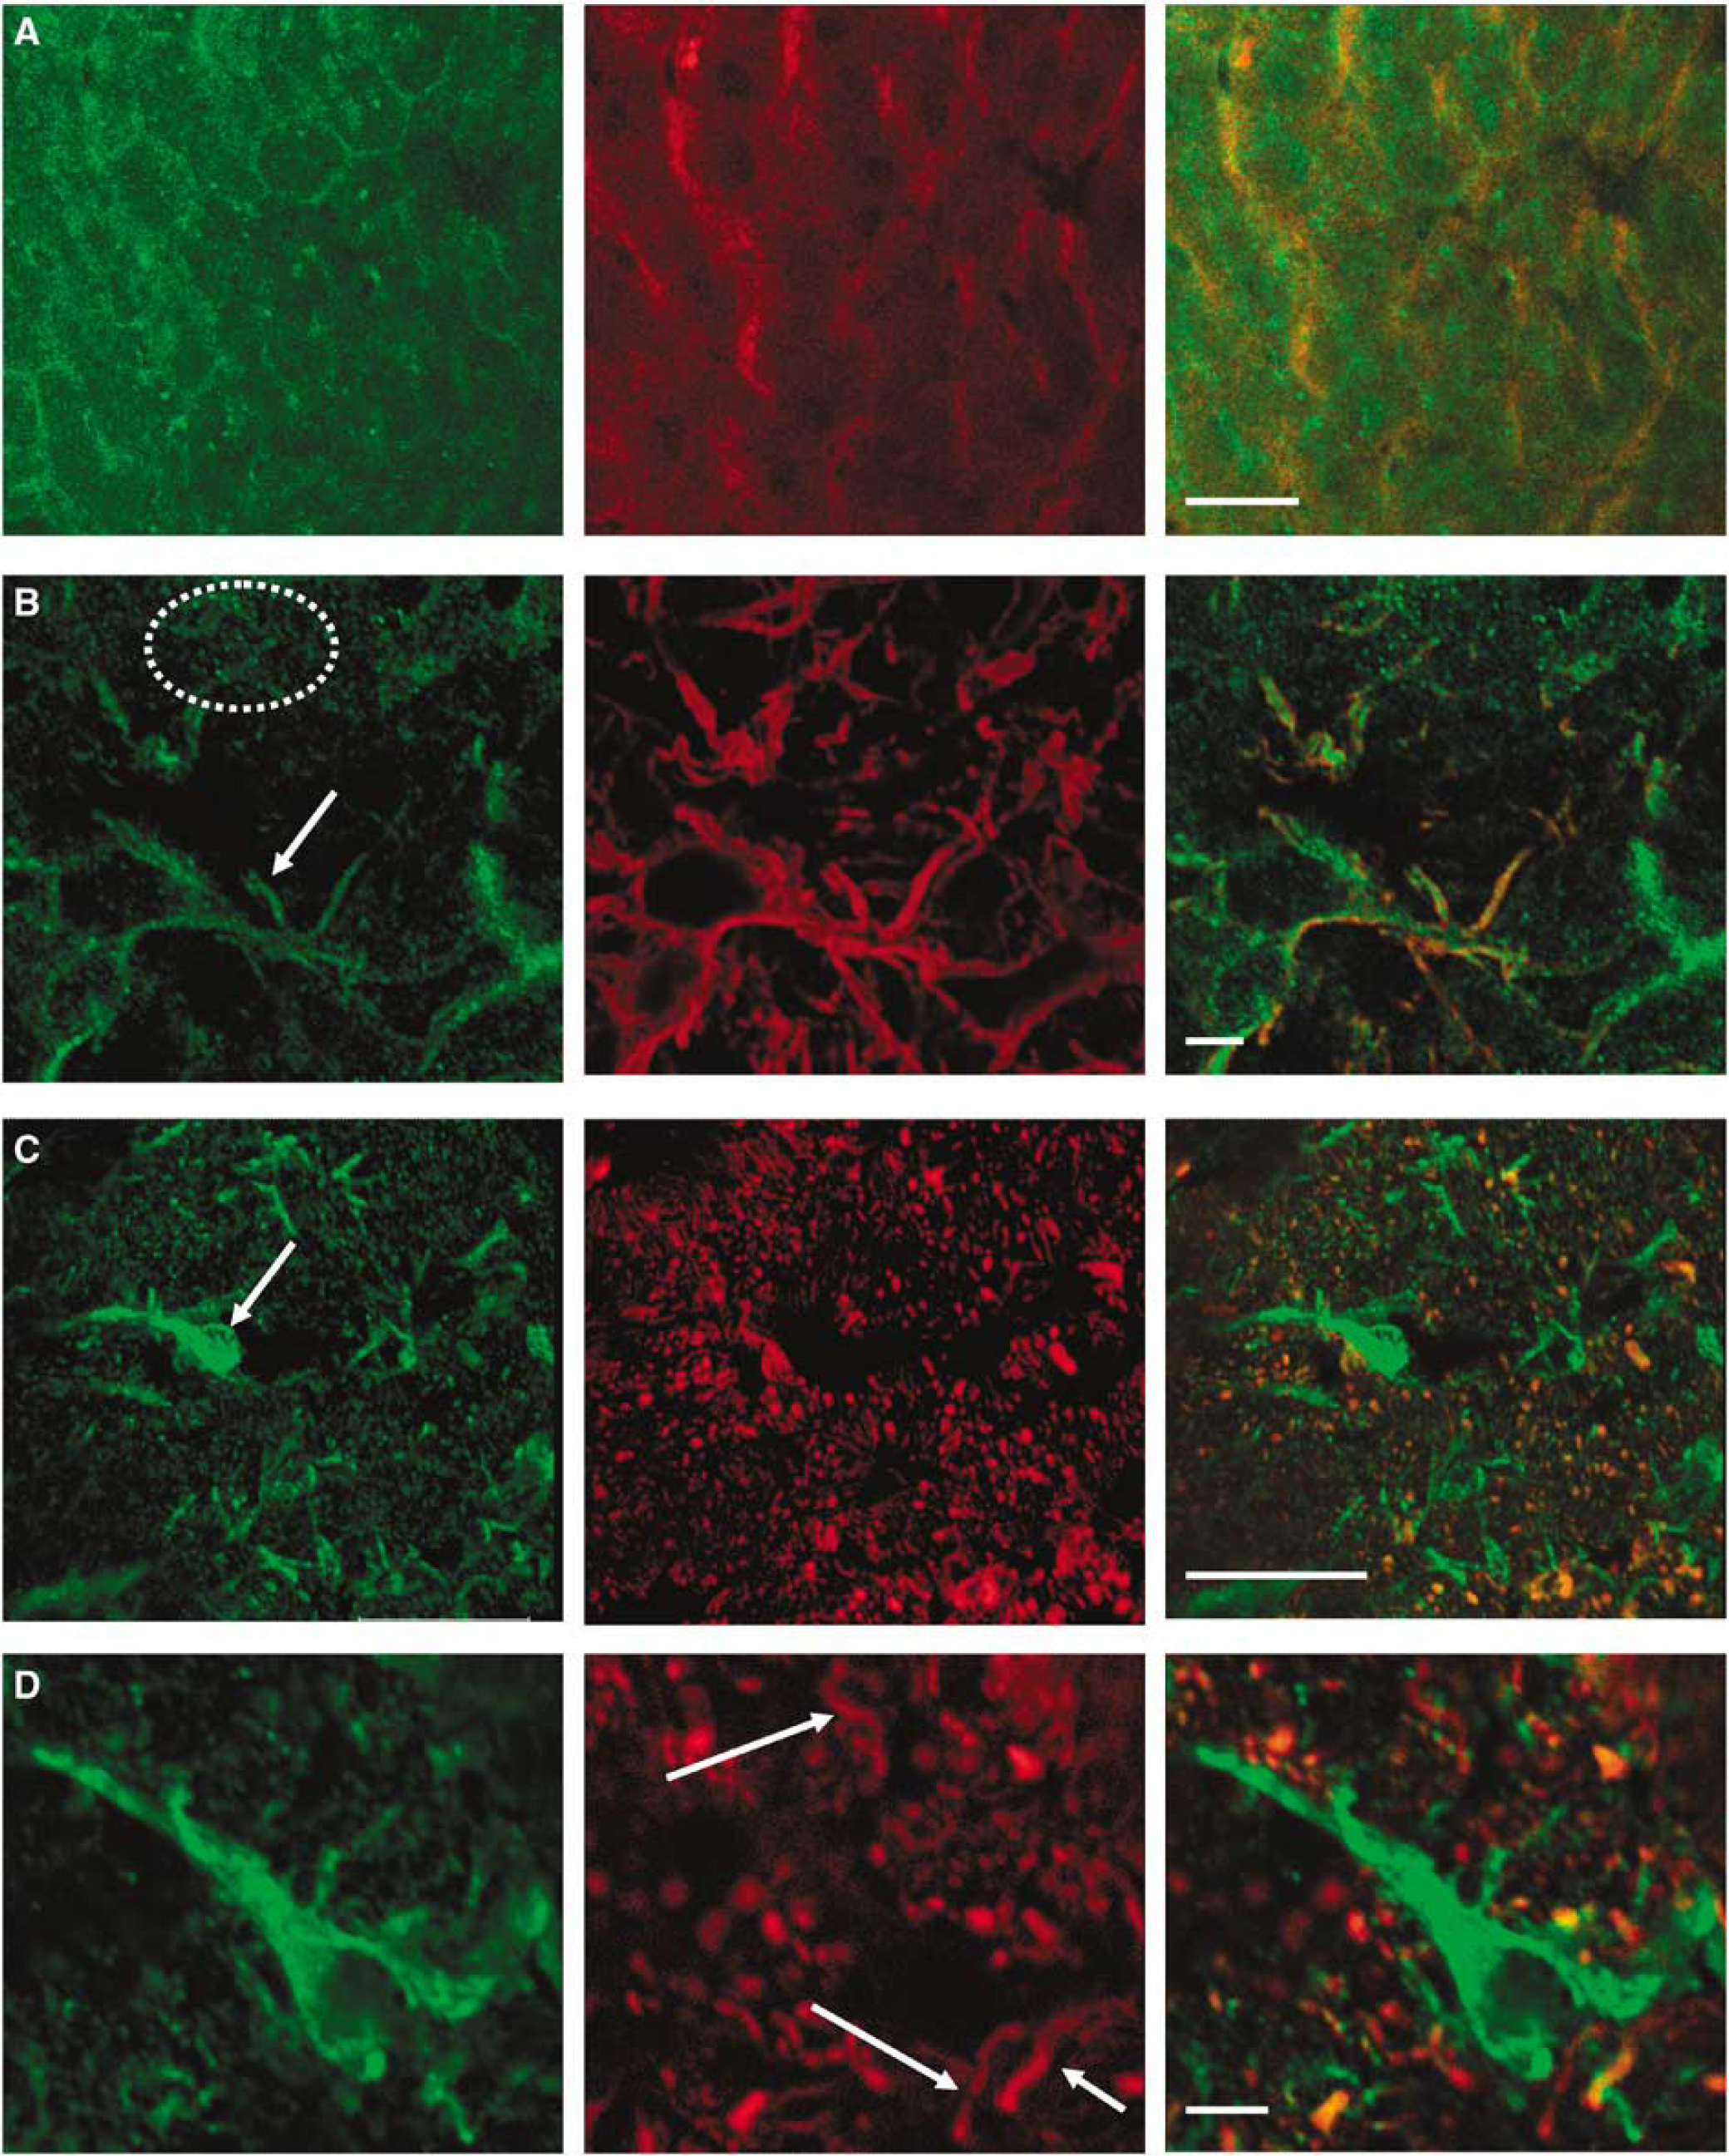
Immunohistochemical illustration of fructokinase expression in liver and mouse optic nerve (MON). (
Discussion
The results presented in this paper illustrate that MON axons can survive with fructose as sole energy substrate, if present at a sufficiently high concentration. However, if the bathing concentration of fructose is lowered, a subset of large axons (>0.75 μm diameter) contributing to the 1st CAP peak are lost after a 30 mins delay, indicating that these axons cannot efficiently metabolise fructose (Allen et al, 2006). This temporary maintenance of the 1st CAP peak in the presence of 10 mmol/L fructose is because of the metabolism of glycogen, which provides supplementary energy substrate, probably in the form of L-lactate, to support axon function. However, once the glycogen is depleted the 1st CAP peak is lost. We have shown a key difference between cortical brain tissue and the MON, a central white matter tract with regard to fructose metabolism. The cortex lacks the enzyme fructokinase, thus all phosphorylation of fructose occurs via hexokinase, but in the MON both hexokinase and fructokinase are present, although the differences in their kinetic profile suggests that fructose is preferentially metabolised by fructokinase. Our results suggest that fructokinase is expressed only in the axons that contribute to the 2nd and 3rd CAP peaks, and that the remaining MON axons do not express fructokinase, hence their inability to thrive in modest concentrations of fructose.
The Role of Glycogen in Supporting the 1st Compound Action Potential Peak in the Presence of Fructose
As aglycaemia-induced injury in MON is due to toxic influx of Ca2+, the limited duration of aglycaemia imposed in these experiments was not of sufficient duration to permit significant Ca2+ influx (Brown et al, 2001a). This is a key point as 25 mins of aglycaemia, while depleting tissue of glycogen and resulting in CAP failure, does not lead to significant axon death, that is, the effects of aglycaemia on CAP area are fully reversible if glucose is reintroduced. Similarly, if 20 mmol/L fructose is introduced after the period of aglycaemia, the CAP fully recovers. However, when 10 mmol/L fructose was introduced after the period of aglycaemia, both the rate and degree of CAP recovery were adversely affected resulting in complete loss of the 1st CAP peak. This loss was not because of irreversible injury of these axons for the reasons mentioned above. Increasing tissue energy demand by imposing a 15-min period of 100 Hz stimulus on the MON significantly decreases glycogen levels (Brown et al, 2003). In MONs bathed in 10 mmol/L glucose, there was no significant decrease in the total CAP area below baseline during the stimulus, which we have shown is because of the ambient glucose being supplemented by glycogen-derived L-lactate, which is transported to the axons (Brown et al, 2004, 2003, 2005). On cessation of the stimulus the baseline was unchanged. However, in the presence of 10 mmol/L fructose, which was added 20 mins before the stimulus to ensure both dissipation of glucose and equilibration of fructose throughout the nerve, a different scenario unfolded. At the onset of stimulus, the CAP area fell, and by the end of the stimulus had fallen to zero, but only the 2nd and 3rd CAP peaks fully recovered after stimulus: the 1st CAP peak was lost. Both sets of experiments show that in the presence of 10 mmol/L fructose, but in the absence of glycogen, the 2nd and 3rd CAP peaks can be fully supported but the 1st CAP peak cannot. Two clear points emerge from these experiments. In the presence of 10 mmol/L fructose: (1) the axons contributing to the 2nd and 3rd CAP peaks can both take up and efficiently metabolise sufficient fructose to sustain baseline axon conduction for extended periods of time, and (2) glycogen-derived metabolites are supplied to axons contributing to the 1st CAP peak, in a manner similar to that which occurs during a/hypoglycaemia where glycogen supports axon function where insufficient glucose is available to support the CAP (Brown et al, 2003).
Effectiveness of Fructose as a Metabolic Substrate in the Mouse Optic Nerve
With the exception of one paper (Brown et al, 2001b), all previous publications on the ability of fructose to support CNS function in in vitro preparations have concentrated on grey matter, and in particular on the hippocampal slice (Bachelard et al, 1984; Wada et al, 1998; Yamane et al, 2000). The first experiments to investigate the ability of fructose to support CNS function were performed over 50 years ago and showed that at a sufficiently high concentration fructose could maintain normal rates of oxygen uptake (McIlwain, 1953). Experiments where comparison was made of fructose' ability to maintain biochemical status and synaptic activity were initially puzzling. Fructose (10 mmol/L) could not support the population spike and also led to a small decrease in the excitatory postsynaptic potential (EPSP). In addition, 10 mmol/L fructose could not support baseline levels of phosphocreatine or ATP (Bachelard et al, 1984). However, increasing the concentration of fructose to 20 mmol/L could fully support both phosphocreatine and ATP levels, and support the EPSP, but still resulted in a decrease in the population spike (Bachelard et al, 1984). Similar results have been found in other studies with the key factor being the ability of fructose to sustain energy levels in hippocampal slice while failing to fully support synaptic function, with the population spike more severely affected than the EPSP (Wada et al, 1998; Yamane et al, 2000). This implies an energy demand that cannot be met by fructose, despite its ability to maintain phosphocreatine and ATP at baseline levels. Accumulating evidence points to the importance of the key glycolytic enzyme phosphofructokinase in supporting function, as hippocampal areas with the least phosphofructokinase activity were most susceptible to loss of synaptic activity (Li et al, 2000). Thus, there may be a requirement for glycolytically produced ATP to support tissue energy requirements in a manner that oxidative metabolism cannot match, perhaps because of the proximity of glycolytic enzymes to the membrane bound Na + -K+-ATPase (Yamane et al, 2000). This is supported by the inability of oxidative substrates such as lactate and pyruvate to fully support synaptic activity in the absence of glucose (Chih et al, 2001; Kanatani et al, 1995; Wada et al, 1998; Yamane et al, 2000). However, it appears unlikely that this occurs in MON as the MON is devoid of glutamatergic synapses. That 10 mmol/L fructose can fully restore the 2nd and 3rd CAP peaks from zero in the total absence of a glycogen (or glucose) indicates that fructose is a suitable metabolic substrate for at least some MON axons under baseline conditions (although during periods of high-intensity stimulus fructose is not as effective as glucose at maintaining function).
Fructose Metabolism
In isolated CNS tissue such as cerebellar cortex and hippocampus, fructose is metabolised by hexokinase (Bachelard et al, 1971; McIlwain and Bachelard, 1985). The Km for glucose is reported as 50 to 100 μmol/L (Bachelard et al, 1971; DiPietro and Weinhouse, 1959; McIlwain and Bachelard, 1985; Sols and Crane, 1954), whereas the Km with fructose as substrate is several orders of magnitude greater than this (Sols and Crane, 1954). However, there is no significant difference in the Vmax with glucose or fructose as substrate, and it has even been reported that the Vmax for fructose is greater (Newsholme and Leech, 1983; Sols and Crane, 1954). As the circulating level of glucose in the brain is in the low millimolar range, and the presumed fructose levels are in the micromolar range, under physiologic conditions glucose will be about 50% phosphorylated, whereas fructose will be less than 1% phosphorylated (Newsholme and Leech, 1983). Thus, there is minimal if any fructose phosphorylated by hexokinase in the presence of physiologic concentrations of glucose (DiPietro and Weinhouse, 1959). Under experimental in vitro conditions where the brain tissue is placed in a superfusion chamber and the blood–brain barrier is circumvented, we would expect the hexokinase activity with either 10 mmol/L fructose or 10 mmol/L glucose to be similar, given that each substrate will have free access to the brain tissue, and will be present in concentrations well in excess of the Km. In the MON the situation is different. The Vmax for hexokinase with glucose as substrate is much lower than in brain, possibly reflecting the decreased glucose utilisation in white matter compared with grey matter (Clarke and Sokoloff, 1999). It has been reported in rabbit optic nerve that the Km for phosphorylation of glucose by hexokinase is in the low millimolar range implying that glucokinase is present (Iannello et al, 1994, 1996), but we could not replicate these results. The Vmax of hexokinase in MON remains low with fructose as substrate but the Km increases reflecting decreased affinity. Thus, hexokinase in both the brain and MON displays a low Km with glucose as substrate, but orders of magnitude higher for fructose. That fructokinase, which does not phosphorylate glucose (Mayes, 1993), is present in the MON is a surprise, especially given its absence in the cortex, and its absence from cultured astrocytes, although these were of cortical origin (Bergbauer et al, 1996). Its low Km and high Vmax, similar to the values in liver (Hagopian et al, 2005), suggest that if any fructose is metabolised in the MON, it will be via fructokinase and not hexokinase. It is interesting to note that the levels of fructose in the brain (10 to 50 μmol/L) are just below the Km for fructokinase, suggesting that fructose could act as an alternate fuel when glucose is low. Thus, a possible explanation for the ability of 10 mmol/L fructose to support activity in the 2nd and 3rd CAP peaks, but not the 1st CAP peak could be because of the presence or absence of fructokinase in axons. Our immunohistochemistry data support this theory. We were able to show that fructokinase is indeed expressed in axons, but also showed the absence of fructokinase staining in some large axons. However, our immunohistochemical results cannot be used as evidence of a clear dichotomy between larger axons and intermediate/smaller axons, and it is also possible there is a continuous distribution in the ability of axons to utilise fructose, diminishing as axons get larger, and increasing as they get smaller. Of interest, but not directly relevant to the issues advanced in this current paper is the presence of fructokinase in GFAP-expressing astrocytes, whose function is currently unknown. If we hypothesise that fructokinase is selectively expressed in MON axons, then it is easy to imagine fructokinase efficiently metabolising sufficient fructose in the 2nd and 3rd CAP peak axons given its Km of 211 mmol/L and the presumed millimolar concentration of fructose in the extracellular space. It should be noted that because of diffusion, 10 mmol/L fructose in the aCSF would probably result in only low millimolar concentration in the extracellular space (Baltan Tekkök et al, 2003). However, the significantly higher Km of hexokinase in MON with fructose as substrate in the 1st CAP peak axons will not phosphorylate sufficient fructose to support function in MONs bathed in 10 mmol/L fructose. Hexokinase is obviously expressed in all MON axons contributing to the CAP, as shown by the ability of glucose to fully rescue the CAP after aglycaemia. The fact that hexokinase in these axons cannot efficiently use fructose as an energy substrate suggests the following scenarios: (1) fructose cannot efficiently enter the axons. This is unlikely to be the case as increasing fructose to 20 mmol/L fully supported the CAP implying that fructose can cross the axonal membranes when present in sufficient quantities, and even at lower concentrations (5 mmol/L) can still support the 2nd and 3rd CAP peaks. It is unlikely there are differences in the ability of axons to take up fructose. The GLUT5 transporter is present in CNS tissue, and our results suggest that the GLUT5 or equivalent fructose transporter is present in MON axons. (2) Fructokinase is expressed in 2nd and 3rd CAP peak axons but not in the 1st CAP peak axons, and although hexokinase is present in these axons, it cannot efficiently metabolise fructose.
Is Fructose Metabolised in the Optic Nerve Under In Vivo Conditions?
Fructose is not generated within the body and any fructose present in the system must occur from ingestion from one three sources. Naturally occurring in fruit, from the disaccharide sucrose, or via the actions of sorbitol dehydrogenase on sorbitol, which may in turn be obtained naturally in food, or via the action of aldose reductase on glucose (Salway, 1999). Thus, fructose is unlike glucose and will have a circulating level dependent on levels of ingested fructose. In the eye this is not the case, however, as there is evidence of the production of sorbitol and fructose via the polyol pathway (Salway, 1999). This pathway is particularly important in uncontrolled type II diabetes where both sorbitol and fructose levels are increased in the eye. Increasing evidence points to the accumulation of sorbitol and its subsequent conversion to fructose as key initiators of diabetic retinopathy (Asnaghi et al, 2003; Chung et al, 2003; Dagher et al, 2004; Lee and Chung, 1999). The mechanism of damage is hypothesised as alterations of nicotinamide adenine dinucleotide/NADH ratios resulting in the production of reactive oxygen species (Mitka, 2005). The role of fructose in diabetic retinopathy is unknown, but the fructose generated in the eye could be used as an energy substrate to fuel metabolism, but this awaits further study.
Footnotes
Acknowledgements
We thank Jon Banks and Alistair Mathie for the generous donation of equipment. We thank Herman Bachelard for stimulating discussions on fructose metabolism, Rob Layfield and Catherine Hughes for technical help with the Western blots, Susan Anderson for help with confocal imaging, and Liz Whelband for help with image analysis.