
Abstract
Brain activation maps of blood oxygenation level dependent (BOLD) signals during functional magnetic resonance imaging (fMRI) are sensitive to unwanted contributions from large vessels. Most BOLD-fMRI studies are based on a stimulus-correlated modulation of the MRI signal amplitude that is sensitive to desired microvascular effects and unwanted macrovascular effects. Aiming to suppress macrovascular effects in activation patterns, this BOLD-fMRI study evaluates brain activation during a verbal working memory task (2-back) in healthy volunteers (n =18) using the amplitude and phase components of the MRI signal. The use of the first time point as a phase reference allowed us to eliminate phase wrapping artifacts and increase the statistical power of ‘phase’ activation, and this information was used to filter out voxels with significant macrovascular (i.e., draining and pial veins) contribution in ‘amplitude’ activation patterns. Across subjects, the task produced large modulations of the relative phase in the occipital, dorsolateral prefrontal, and parietal cortices, suggesting a common distribution of draining veins in these regions across subjects, and in the rostral frontal cortex, probably associated to stimulus-correlated motion of the head. The phase filtering method partially suppressed BOLD responses in the superior and lateral prefrontal, parietal, and occipital cortices; therefore the commonly reported brain activation in these cortices during working memory tasks may include significant macrovascular contributions. This study suggests that the phase information embedded in the MRI signal can be used to suppress unwanted macrovascular contributions in fMRI studies.
Introduction
The macrovascular contribution is a serious concern for blood oxygenation level dependent (BOLD)-functional magnetic resonance imaging (fMRI) studies because this not well-localized contribution dominates the BOLD-fMRI signal change (Menon, 2002). Thus, BOLD signal changes can reflect neuronal activity at more remote locations (from several to tens of millimeters) from the activation site (Duvernoy, 1999), reducing spatial localization in gradient-echo planar imaging (GE-EPI) based BOLD-fMRI studies (Engel et al, 1997; Menon and Goodyear, 1999). Flow dephasing modalities such as arterial spin labeling, which has predominant capillary sensitivity, are less sensitive to the macrovascular contributions than BOLD-fMRI and can be also used to map brain activation (Detre and Wang, 2002; Luh et al, 2000; Yang et al, 2000). Similarly, diffusion-weighting modalities can be used to suppress signals from larger vessels preserving signals from the capillary bed (Boxerman et al, 1995a; Song et al, 1996). However, the intrinsically higher contrast to noise ratio of the BOLD effect for detecting brain activation makes this technique the gold standard for fMRI studies. Therefore, quantifying the extent of macrovascular contribution is essential for improved spatial precision in BOLD-fMRI activation maps.
While the extravascular BOLD-fMRI signal results from brain tissue other than blood, the intravascular BOLD-fMRI signal results from blood capillaries (2 to 4 μm radius), pial veins (10 to 250 μm), and cortical veins (0.5 to 2.5 mm)(Menon, 2002). The intra-, and extravascular components of the BOLD signal reflect local magnetic field variations produced by changes in the fractional oxygen saturation of hemoglobin during the fMRI tasks (Boxerman et al, 1995b; Menon et al, 1995; Ugurbil et al, 1999); however, the intravascular pool accounts for the majority of the BOLD-fMRI dependent signal (Boxerman et al, 1995a).
Blood oxygenation level-fMRI studies at different field strengths found that the BOLD signal is dominated by macrovascular contributions (Boxerman et al, 1995a), and the signal increase with field strength is enhanced for voxels containing a mixture of capillaries and veins/venules than for those containing only large vessels (Gati et al, 1997). Moreover, the relative contributions from the macro- and microvascular pools also depend on imaging parameters (i.e. echo time), and imaging modality (Duong et al, 2003).
The complex BOLD-fMRI signal can be characterized by its amplitude and phase components. For the microvascular compartment, the stimulus-related modulation of the phase component is null because of the inhomogeneous distribution of the magnetic field, which does not preserve the coherence of the voxel magnetization. In contrast, the fMRI-stimulus modulates the phase component of the signal coming from the macrovascular compartment, since the more homogeneous magnetic field partially preserves the coherence of the magnetization inside the voxel. Thus, the macrovascular contribution in activated networks can be determined by using phase information embedded in the BOLD-fMRI signal and could be removed from activation patterns (Menon, 2002).
The amplitude of the MRI signal has been traditionally used to compute activation patterns (Bandettini et al, 1993) in BOLD-fMRI studies, discarding the phase component of the signal. Recently, a method that uses both the amplitude and the phase of the MRI signal was proposed to increase the statistical power of brain activation (Rowe, 2005a, b; Rowe and Logan, 2004; Rowe and Logan, 2005), which is particularly valuable at low field strength (i.e., 1.5 T). This increase, however, is probably accompanied by decreased spatial localization, because the phase component of the BOLD-fMRI signal is associated with the macrovascular compartment and, as shown in this work, stimulus-correlated motion and susceptibility artifacts. At high field strength (i.e., higher than 3 T), however, the use of this method does not significantly increase statistical power, because of the larger BOLD contrast-to-noise at these fields (Rowe and Logan, 2004).
Theoretically, the sensitivity for the detection of stimulus-related phase modulation is enhanced by the use of high field fMRI. However, there were no attempts in the past to map brain activation in a group of subjects using phase information. Phase information can by used to detect brain regions with significant macrovascular signals, as initially suggested by Menon. However, this information has never been used to filter out voxels with significant macrovascular contribution in group analyses of brain activation. Consequently, the goal of this reanalysis of an existing BOLD-fMRI data set (Tomasi et al, 2005a) was to map and suppress the macrovascular contribution in BOLD-fMRI activation patterns of working memory processing, using the phase information embedded in the BOLD-fMRI signal.
Theory
In this section, we will introduce the basic concepts associated to phase modulations, using a cylindrical approximation for the vein shape. The z-component of the magnetic field induced by a cylindrically shaped vein of radius a located at
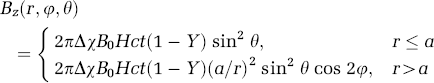
Here Δ;χ is the difference in magnetic susceptibility between blood and tissue water, Hct is the hematocrit concentration, Y is the fractional oxygen saturation of hemoglobin, φ is the polar angle, and θ; is the angle between the vessel and
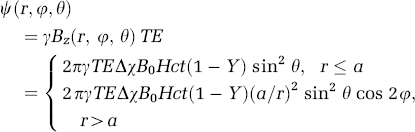
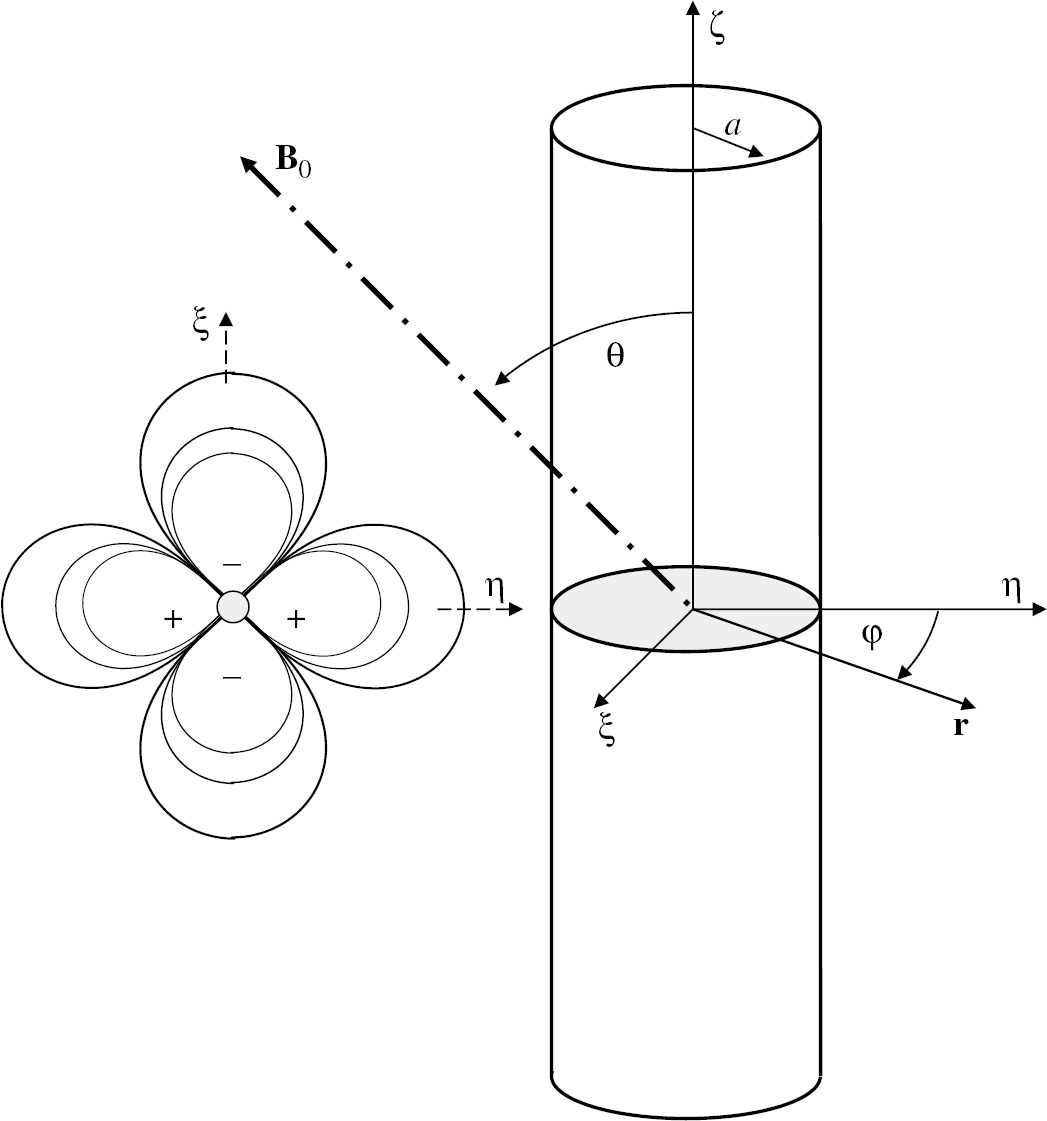
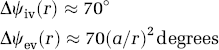
and reduces the average voxel magnetization. Here g is the gyromagnetic ratio of proton spins. We will distinguish the intravascular phase (ψiv; r⩽a) from the extravascular phase (ψev; r > a). The intra vascular phase shift is almost uniform; its amplitude, however, depends on the relative vessel orientation respect to
Schematic representation of the magnetic field (left) produced by the cylindrical distribution of a paramagnetic substance and the frame of reference used in the manuscript (right). + and — symbols highlight regions where the field produced by the magnetic cylinder is aligned or in opposition to the external magnetic field, respectively.
For motor tasks, in pial veins Y changes approximately 15% from baseline to activation conditions (Hoogenraad et al, 1998); here, for simplicity, we will assume that in the macrovascular (a >25 μm) venous compartment Y increases 10% between baseline and activation (Buxton, 2002). To estimate the radial distribution of maximum phase changes during activation, we will further assume that
As an example, based on (3) Figure 2 estimates the phase shift during activation in the extravascular pool as a function of the distance from the vein surface for (1) large draining veins (a =3 mm); (2) cerebral cortical veins (a = 1 mm); (3) large pial veins (a = 0.25 mm); and (4) small pial veins (a = 0.025 mm). A 75% decrease of the phase shift amplitude is expected at a distance a from the vein surface.
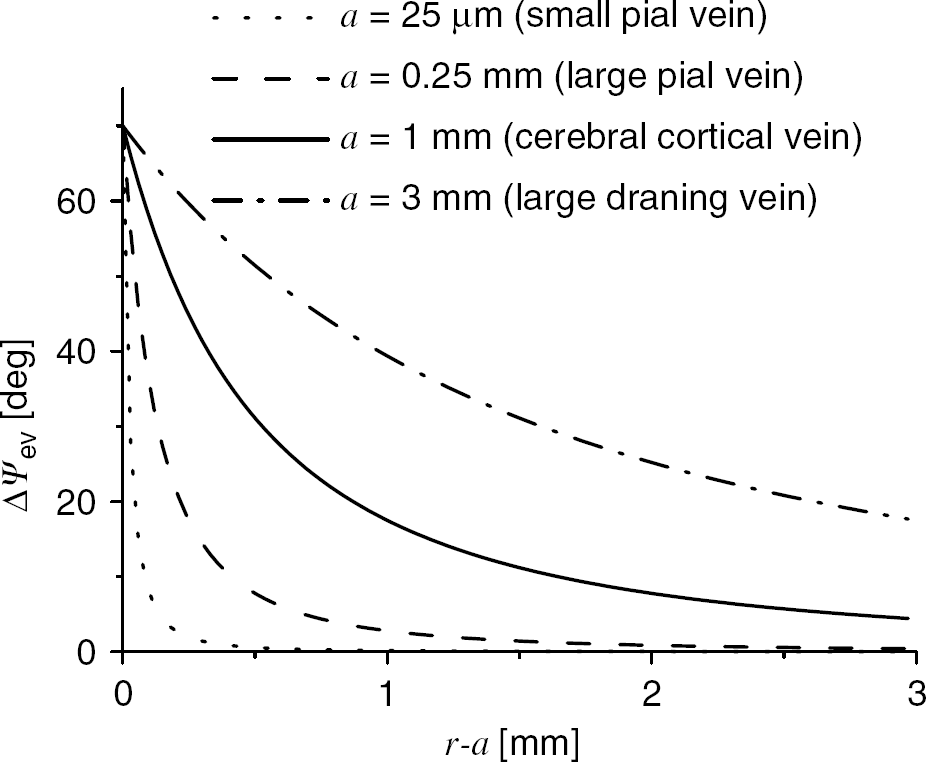
Calculated extravascular phase shift as a function of distance to the vessel's wall for different vein sizes. TE = 25 ms, B0 = 4T, Hct = 0.4, Δχ = 0.18p.p.m., ΔY =0.1, 0 = θ/2, φ = 0, and equation (2) were used.
The Macrovascular Compartment
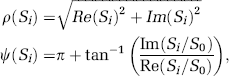
Large draining veins may occupy a significant fraction of the MRI voxel and modulate the amplitude of the MRI signal. Let a be this fraction and consider only partial volume effects of the macrovascular pool in amplitude images. Using simple vector algebra the relative signal change between baseline and activation at nonactivated brain regions that contain veins can be estimated as
Thus, draining veins that occupy half the imaging voxel (α = 0.5) produce the largest signal change (ΔS/S≅0.5%; using equation (4) and Δψ iv =0.2rad (12°)); the magnitude of this signal change is comparable to that of the BOLD effect in the brain parenchyma and can confound the results of fMRI studies.
A dense network of pial veins, which are spaced every 0.2 to 3 mm, is connected to cortical draining veins. Thus, the nonhomogeneous phase shift distribution produced by pial veins in the extravascular pool can further modulate the amplitude of the MRI signal. Using equations (3) and (4), we numerically estimated that activation of large pial veins can produce a voxel-average phase shift Δψ ∼ 1.5° in the extravascular compartment. The intravoxel dephasing produced by a network of pial veins can modulate up to 1% the amplitude of the BOLD-fMRI signal of the microvascular pool, depending on distance between veins. Therefore, even phase modulations as small as Δψ∼ 1.5° can indicate significant macrovascular contribution in BOLD-fMRI activation patterns. In this work, we present a method to minimize the macrovascular contribution in standard BOLD-fMRI activation patterns corresponding to a group of subjects.
Materials and methods
Subjects and Task
Eighteen healthy, nonsmoking, right-handed volunteers (eight men, age 28 ± 7 years, education: 16 ± 2 years) with normal vision participated in the study. Before the study, each subject signed a written informed consent. The subjects performed a verbal working memory task where alphabetical letters were presented randomly at a rate of one per second (Tomasi et al, 2005a). The subjects were instructed to hold a response button on their chest with their right hand, and to press it as fast as possible with their right thumb whenever the current letter was the same as the one presented two steps before (2-back task). During the 30-secs task period, five targets were presented randomly. During the rest period (30 secs), nonsense characters were randomly displayed at the same size, rate, and luminance, and the subjects were instructed to maintain fixation at the center cross. The stimuli were presented on MRI-compatible LCD goggles connected to a personal computer. Subjects' accuracy and reaction times during the fMRI task were 91%±1%, and 590 ± 20 ms, respectively.
MRI Acquisition and Reconstruction
Subjects underwent MRI in a 4T whole-body Varian/Siemens MRI scanner. A quadrature head-only birdcage radio frequency (RF) coil was used for transmit and receive modes; this coil produces a uniform RF field (i.e., B1-homogeneity better than 86%) within the whole brain. A T2*-weighted single-shot gradient-echo EPI sequence (TE/TR= 25/3,000 ms, 4 mm slice thickness, 1 mm gap, typically 33 coronal slices, 48 × 64 matrix size, 4.1 × 3.1 mm2 in-plane resolution, 90°-flip angle, 84 time points, bandwidth: 200.00 kHz) was used to record the BOLD responses in the whole brain. Padding between the RF coil and subjects' head was used to minimize head motion during the scans.
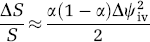
The first four volumes in the time series were discarded from further analyses to avoid nonequilibrium effects of the MR signal. For each fMRI run, two different time series were calculated using the real, Re(S), and imaginary, Im(S), components of the complex MRI signal, S: the ‘amplitude’ time series, p(S), which is commonly used in fMRI studies, and the ‘relative phase’, C(S) time series using:
where S0, and Si are the first, and subsequent time points of the complex time series. The phase of the complex ratio, Si/S0, is the phase difference between the time point i, and the first time point in the time series, which is small (< 20°) for all time points and voxels of the subject's brains; therefore the complex ratio eliminates the need for phase unwrapping. In equation (5), the factor π was added to ensure that the relative phase has a positive non-null average value for all voxels in the brain. Accuracy for ψ-measurements (voxel-by-voxel) was better than 0.5° (standard deviation). For comparison purposes, the standard phase time series was additionally calculated using π + tan−1[Im(Si)/Re(Si)].
The general linear model (GLM) in the statistical parametric mapping package SPM2 (Welcome Department of Cognitive Neurology, London, UK) was used to map the amplitude of gross phase modulation produced by the task in the subject's brain. A box-car design convolved with the canonical hemodynamic response function (HRF) and a high-pass filter with temporal cutoff of 128 secs was used to calculate activation maps for ‘relative-phase’ time series without realignment, spatial normalization, and smoothing. This information was used to create ‘filtered’ time series [ρfil(S)], where the signal amplitude at voxels with statistically significant phase modulation (two different criteria were used: ψ >4° or ψ >1.5°, using a voxel-level threshold of P =0.001) was set constant across time points, and equal to the signal intensity at the corresponding voxel in the first image volume. For this purpose, a custom program was written in IDL (Research Systems, Boulder, CO, USA).
Subsequent analyses were performed with SPM2. A six-parameter rigid body transformation was used for image realignment, to correct for head motion. Only scans with head motion less than 1-mm translations and 1° rotations were included in the analysis. The realigned data sets (ρ i (S), ρfil(S), and ψ i (S)) were normalized to the Talairach frame using a voxel size of 3 × 3 × 3 mm3; the first ‘amplitude’ time point was used to adjust the 12 free parameters of the affine transformation (Ashburner et al, 1997), then the same affine transformation was applied to the ρ i (S), ρpfil(S), and ψ i (S) time series. An 8-mm full-width-half-maximum Gaussian kernel was used to smooth the data.
The GLM and a box-car design convolved with a canonical HRF were used to calculate the activation maps for each time series (ρ(S), ρfil(S), and ψ(S)). A low-pass (HRF) filter, and a high-pass (cutoff frequency: 1/126 Hz) filter were used during this calculation. Figure 3 schematically exemplifies the image reconstruction and postprocessing steps used in this work.
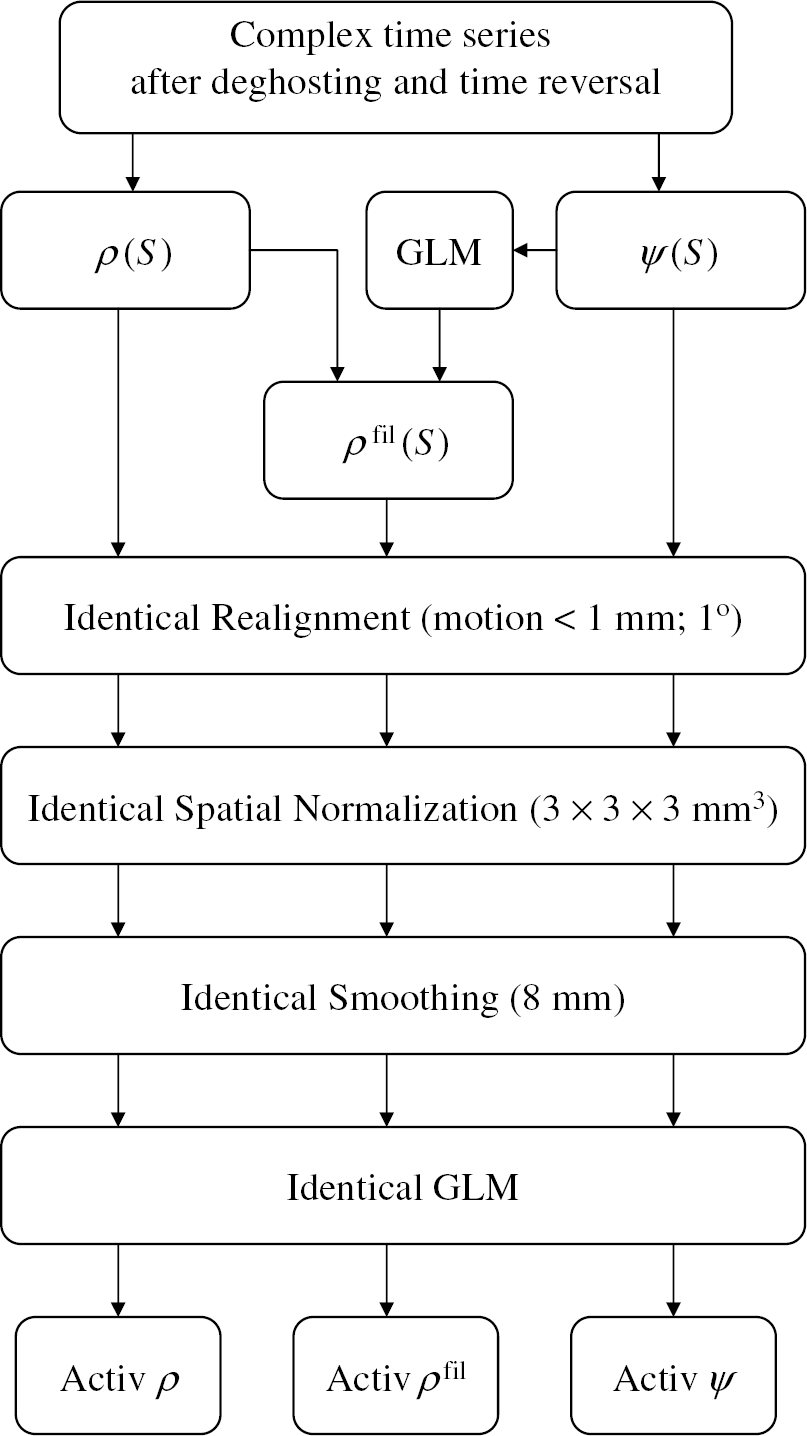
Scheme of the proposed imaging postprocessing steps.
Statistical Analyses
A voxel-by-voxel statistical analysis was applied to the parameter estimates for each trial, to identify significantly activated brain areas for the ‘amplitude’ and ‘relative phase’ time series. Separated group analyses of brain activation were conducted for the ψ-, and ρ-BOLD responses (estimated percent signal change) using one-sample t-test (for ψ-activation), and a repeated measures analysis of variance with three conditions (ρ-activation: unfiltered, ψ >4° filtered and ψ >1.5° filtered). Additionally, simple regression analyses of ψ-activation and motion parameters resulting from image realignment were conducted in SPM to rule out if ψ-changes were associated to motion-related changes in a nonuniform magnetic field. An uncorrected threshold P < 0.001 was used to map brain activation.
Results
Detection of Macrovascular Contributions
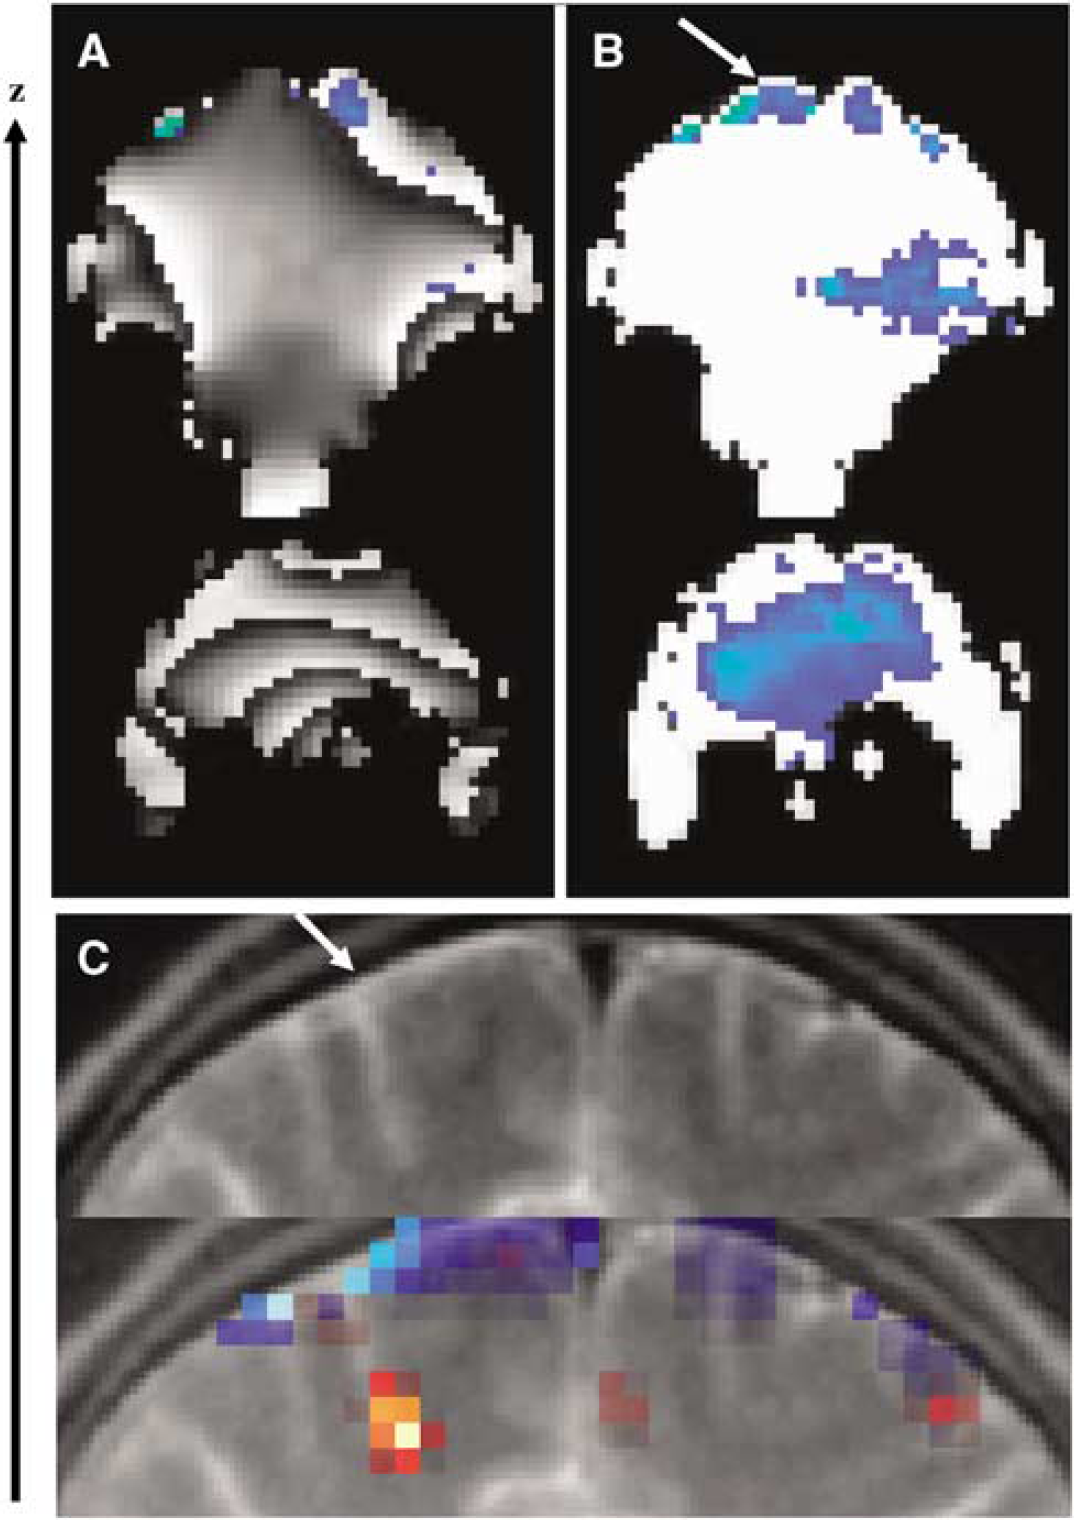
The phase component of the GE-EPI signal is linearly dependent on local magnetic field variations because of susceptibility differences between air–tissue interfaces, and it is wrapped into a period π;. As an example, the GE-EPI phase images in Figure 4A show the characteristic wrapping artifact associated to a nonuniform distribution of the local magnetic field. In general, this artifact is time dependent because of brain physiology and function, and subject motion. Consequently it can introduce large noise during estimation of BOLD-fMRI responses, and compromises ‘phase’ activation patterns (Figure 4A). The wrapping artifact is not present in the relative-phase images (Figure 4B) because (1) the phase of the complex ratio Si/S0 (the differential phase with respect to the first image in the time series) does not depend on the spatial distribution of the static field, and (2) temporal variations of magnetic field in the brain are small. Therefore, the spatiotemporal variations of the relative phase were smaller than π/2 for all subjects, preventing wrapping artifacts.
(
Figure 4C shows the superimposition of the ‘amplitude’ (ρ; red), and ‘relative-phase’ (ψ; blue) activation patterns on subject's T2-weighted structural scan. Note that the ψ-activation cluster is located at the surface of the brain. The same region is hyperintense in the structural scan (arrow), and may correspond to one of the superior cerebral veins. The ρ-activation cluster is located deeper in the superior frontal cortex at the end of the sulcus. We expected phase modulation in the superior cerebral vein, because this vein is almost perpendicularly orientated with respect to the main magnetic field (z-axis; equation (2), θ∼π/2). Conversely, we did not expect phase modulation in branches and pial veins that drain the ρ-activation cluster in Figure 4C, because the sulcus that surround these veins is almost parallel to the orientation of the main magnetic field (θ∼0; see equation (1)).
Suppression of Macrovascular Contributions
The time courses in Figure 5A demonstrate that for some brain regions the task modulated the ρ-component but not the ψ-component of the signal that is characteristic of the extravascular compartment, the major target in most fMRI studies. For other regions of the brain, however, the task modulated both the ρ-, and ψ-components (Figure 5B), or only the ψ-component of the signal (Figure 5C). The signal in these regions may include significant macrovascular contributions (probably reflecting neural activity at remote brain locations), significant physiologic noise, or be sensitive to field inhomogeneities and subject motion (i.e., the orbitofrontal cortex; see Figure 4A–B, bottom).
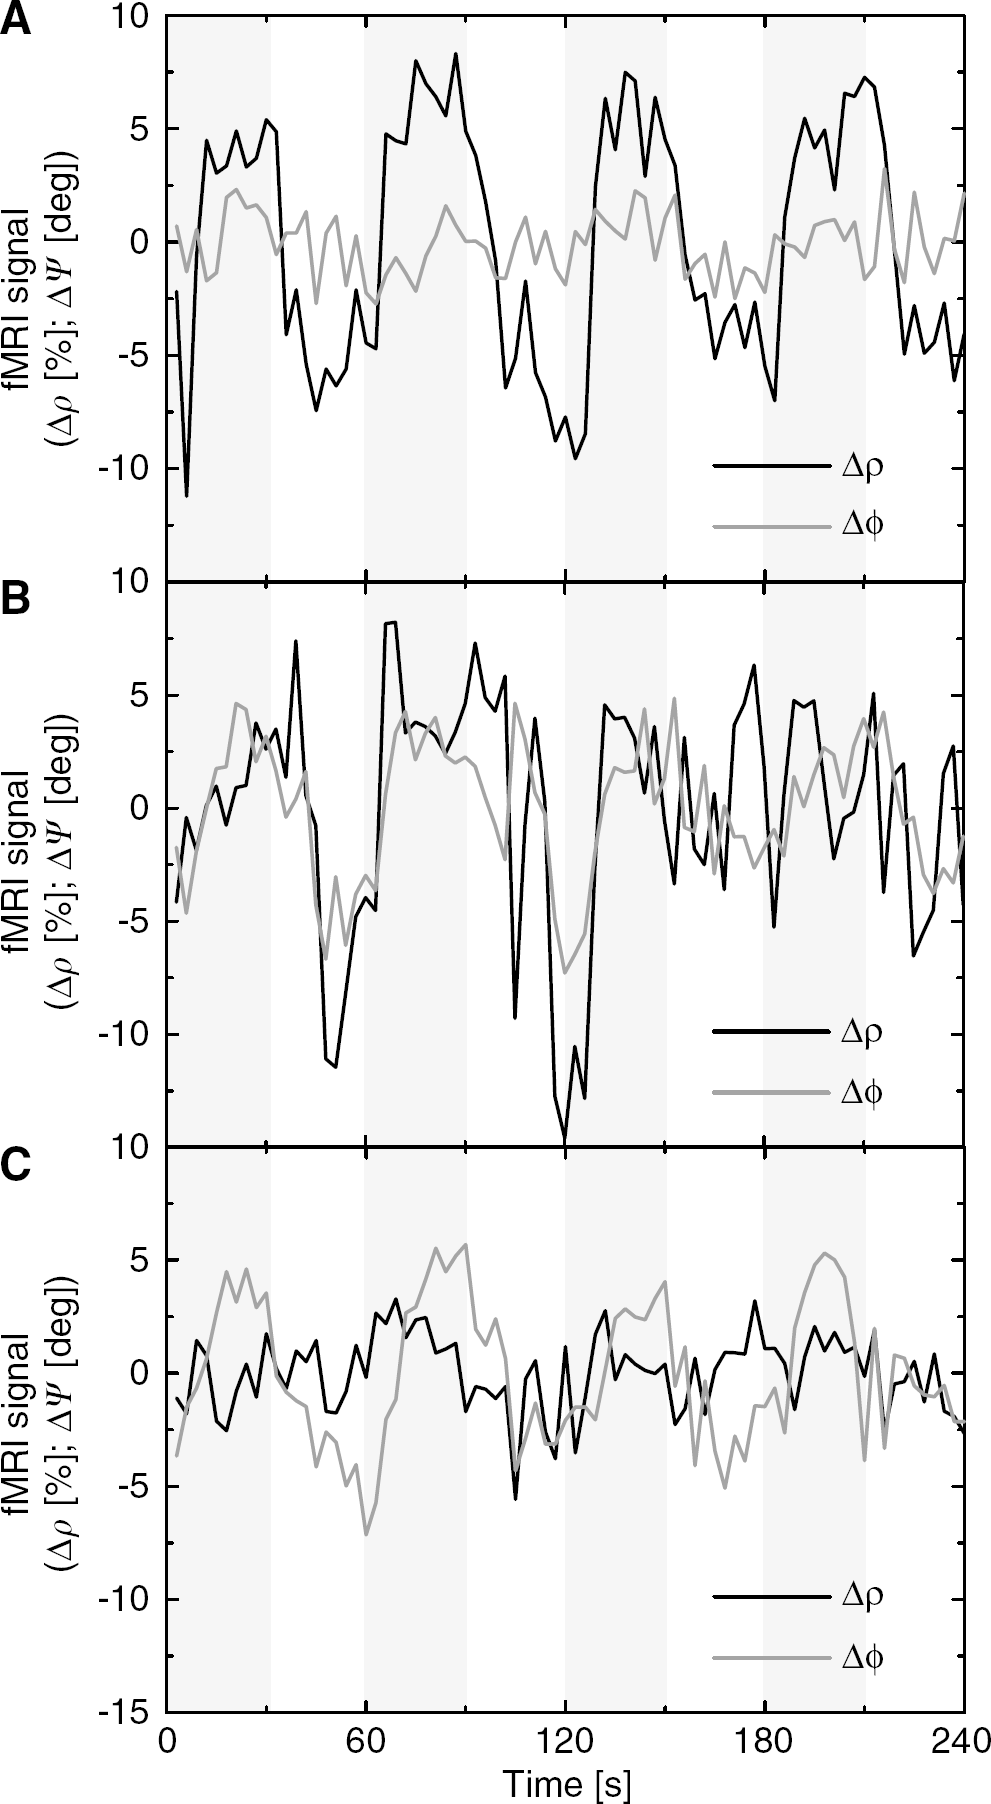
‘Amplitude’ (solid line) and ‘relative phase’ (gray line) signal time courses during the task for three different brain regions. (
Figure 6A plots the ψ-modulation versus the φ-modulation for all voxels in the brain with significant amplitude modulation (voxel level threshold: P < 0.05). Two different groups of voxels can be segregated depending on whether their amplitude modulation was positive or negative. For the former group (Δρ > 0), the ψ-modulation was lower than 1 degree for 95% of the voxels, indicating lower macrovascular contributions in these voxels. For the last group (Δρ < 0), however, 25% of the voxels have larger ψ-modulation than 1.5 degree, suggesting macrovascular, and physiological contributions in the signal, as well as those associated to small field changes due to subject motion; therefore voxels with larger phase modulation than 1.5 degree should be excluded from further analyses.
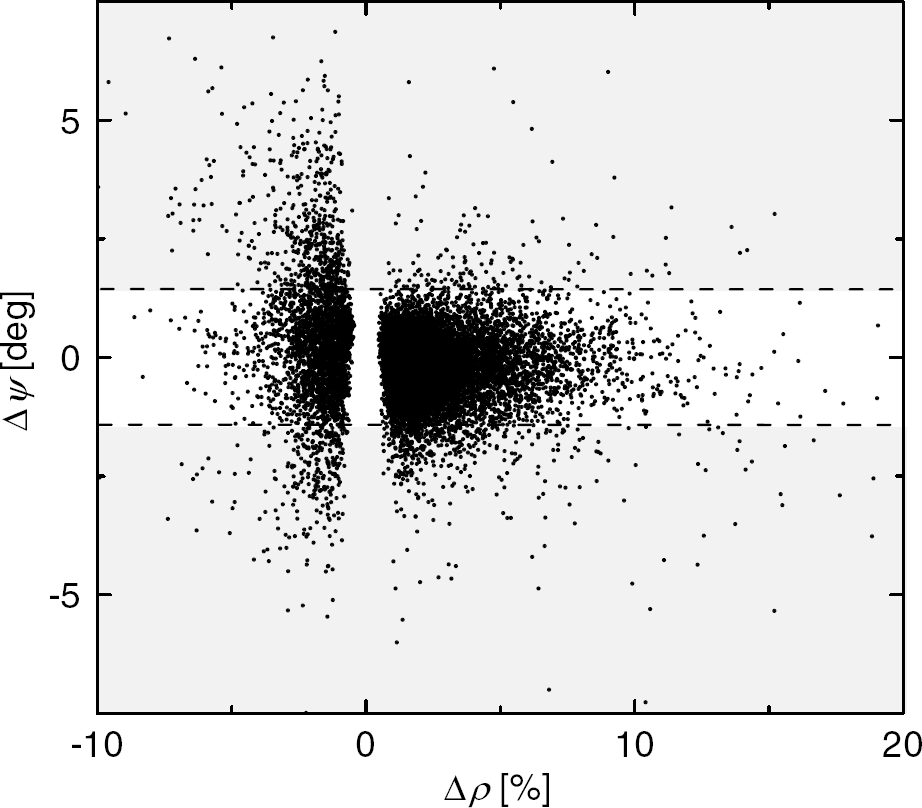
The estimated ‘relative phase’ modulation is plotted against the estimated ‘amplitude’ modulation for all voxels in the brain. All SPM image postprocessing steps (realignment, spatial normalization, and smoothing) were avoided to minimize warping errors and spatial localization of the responses. The shaded regions mark the suppressed voxels with larger ‘relative phase’ modulation than 1.5°. Single-subject analysis.
Across subjects, the task modulated the relative phase of the MRI signal in the left dorsolateral and ventral prefrontal, occipital and left temporal cortices (Figure 7, ‘Phase’). The voxel-wise regression analysis of ψ-signal changes and subject motion demonstrated that the large cluster with negative ψ-activation in the ventral prefrontal cortex was associated to stimulus-correlated motion (Pcorr < 0.02, corrected for multiple comparisons; correlation coefficient R < 0.56; pitch angle < 0.004 rad for all subjects); thus positive head rotations along the x-axis produced negative ψ-changes in a region that is strongly affected by susceptibility artifacts in GE-EPI (see Figure 4). ψ-activation did not correlate motion parameters in any other brain region. Therefore, other clusters in Figure 7 ‘Phase’ probably spot brain regions with significant macrovascular contribution across subjects.
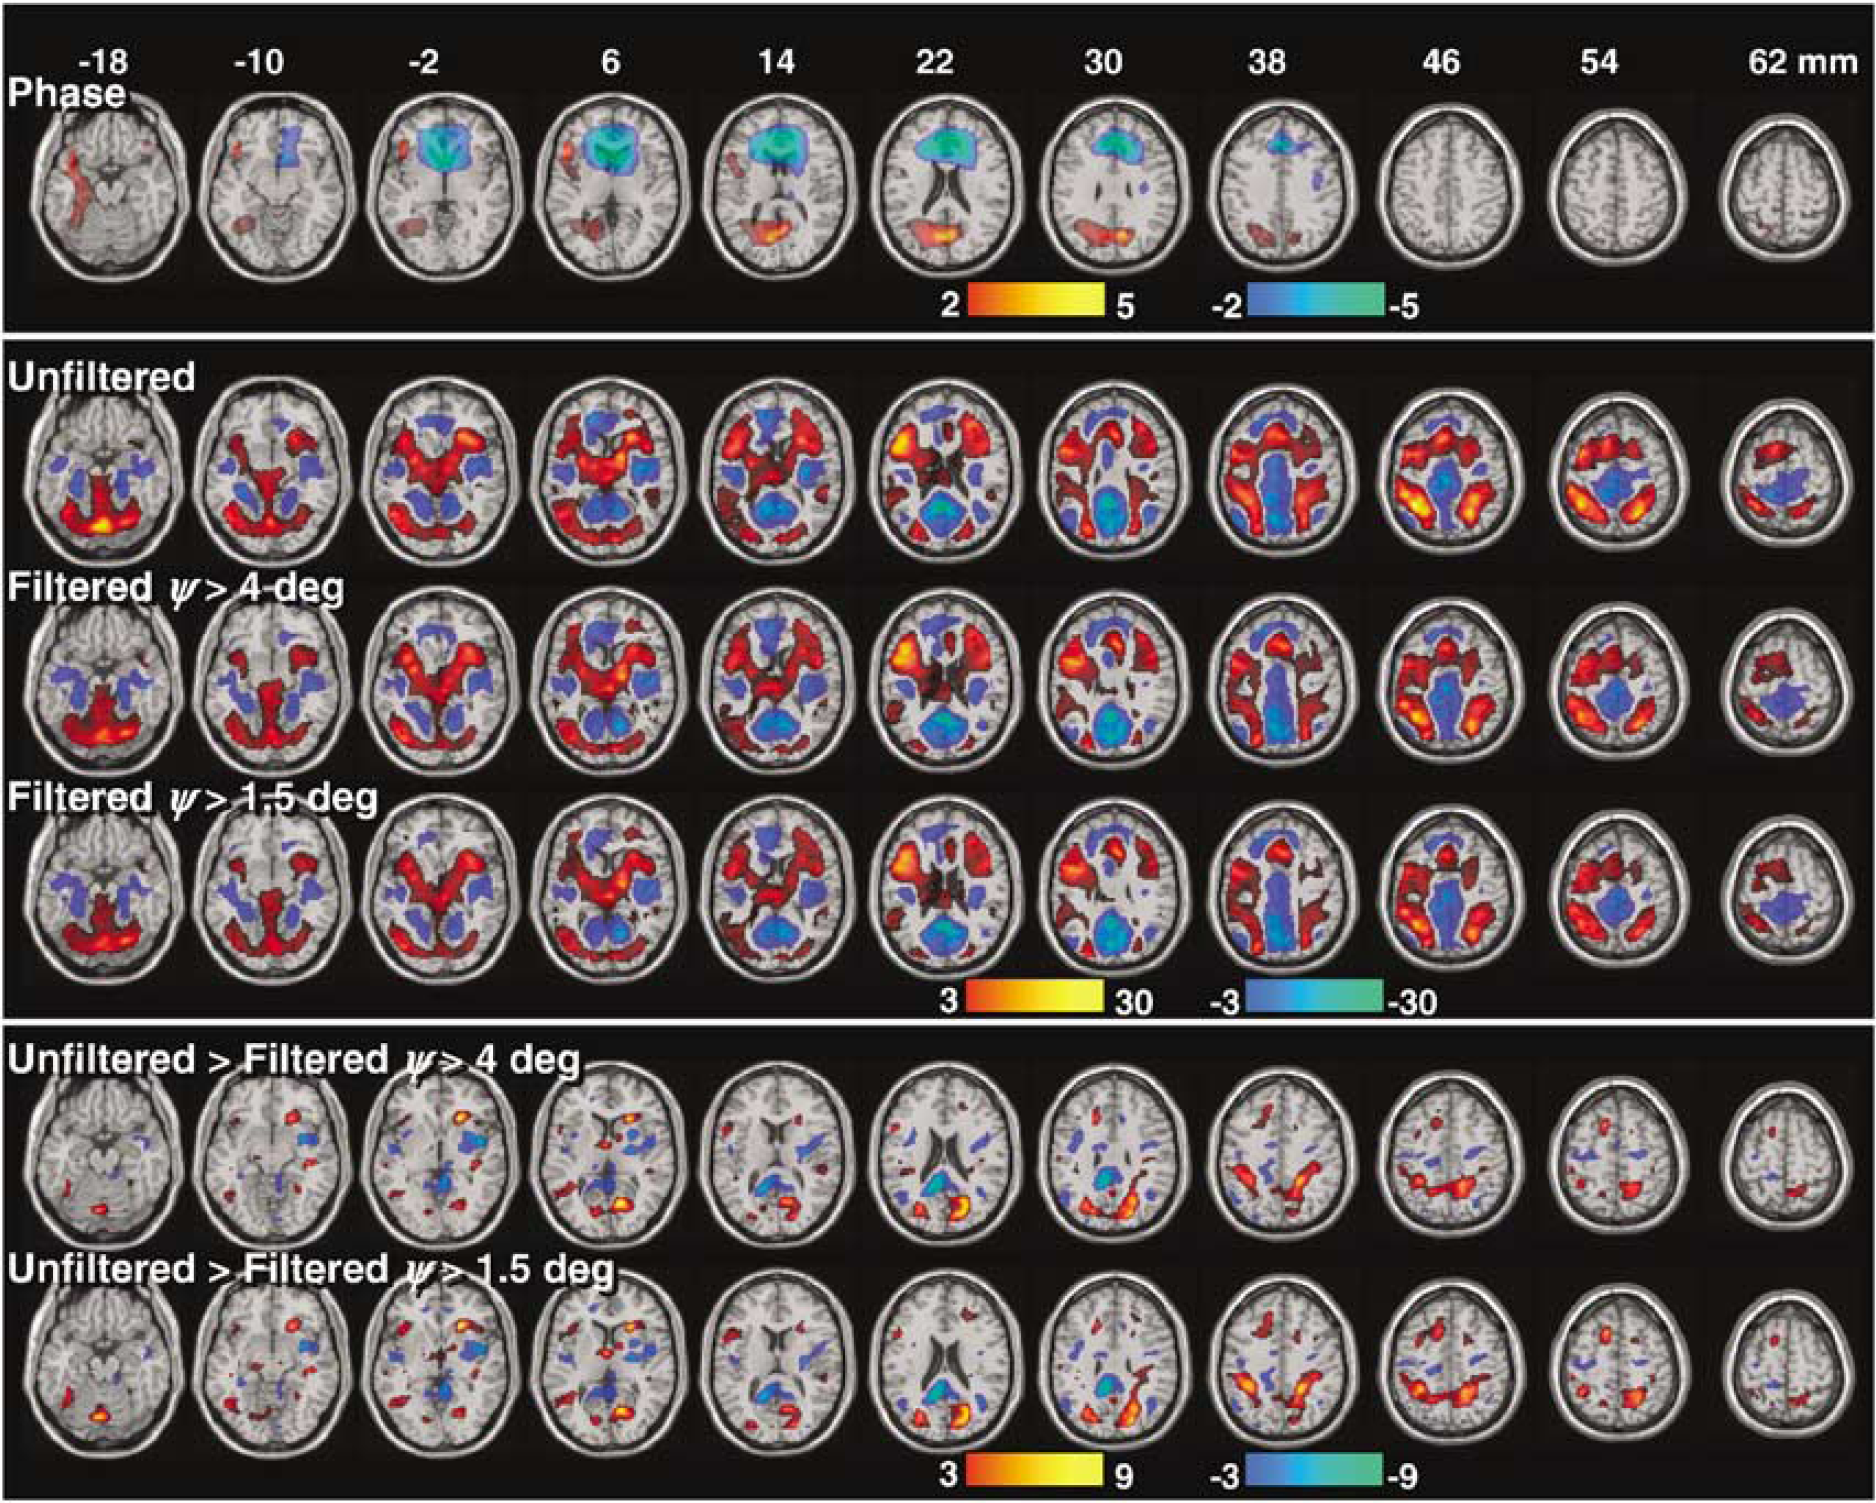
Group analyses of brain activation produced by the 2-back working memory task (n = 18 subjects). Across subjects, the ‘relative phase’ (top panel) activated the occipital and dorsolateral prefrontal and temporal cortices (red), and deactivated the rostral frontal regions near the sinus cavity. The proposed phase-filtering method reduces statistical power in ‘amplitude’ activation (red)/ deactivation (blue) patterns (middle panel). The differential activation (bottom panel) patterns show the brain regions more affected by the proposed phase-filtering method across subjects.
The task modulated the amplitude of the signal in frontal, parietal, temporal, and occipital cortices, subcortical gray matter regions and the limbic lobe (Figure 7, ‘Unfiltered’) as reported previously (Tomasi et al, 2005a, b, c). Figure 7 also shows ρ-activation patterns corresponding to the filtered time series, and their differential comparison to the unfiltered case. The proposed phase-filtering method reduced activation/deactivation at brain regions that were activated/deactivated by the task, especially in the superior parietal, prefrontal, and occipital cortices.
Baseline Fluctuations and Physiological Noise
Low-frequency (< 0.015 Hz) fluctuations of the signal baseline, and physiological noise resulting from respiratory pulsations (frequency >0.1 Hz) were assessed through Fourier analyses of the time-dependent MRI signal, averaged in the whole brain. The analysis demonstrated that ψ-, and ρ-time series have very similar spectral distribution (Figure 8). However, ψ-time series have larger (a) low-frequency components (0.015 Hz < frequency < 0.025 Hz), probably reflecting slow head motion with similar frequency to that of the stimulus (0.017 Hz), and (b) high-frequency components, probably associated to physiological (respiratory) noise, than the ρ-time series. Therefore, the use of low-, and high-pass filters to remove these sources of noise it is even more important for accurate estimation of ψ-activation than for ρ-activation.
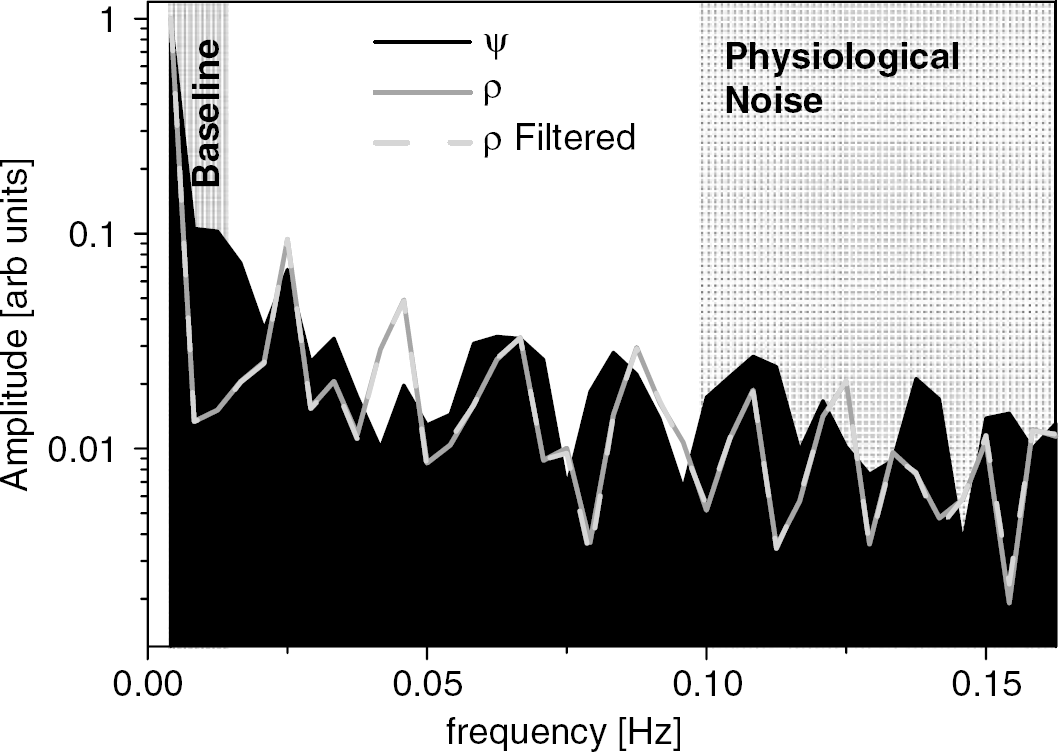
Fourier analysis of the average MRI signal in the brain for relative phase (ψ), and unfiltered and filtered (ψ >4 deg) amplitude (ρ) time series. Shadings highlight ontributions from baseline fluctuation and respiratory pulsations (physiological noise) in ψ-, and ρ-time series (raw data). Sample size: one subject.
Discussion
This is the first fMRI study that used phase information to evaluate vascular effects on activation patterns across subjects. The major finding of the study is that group analyses of brain activation may include significant macrovascular contributions. To minimize this contribution we propose a method that is fully compatible with the standard GLM.
The phase of the BOLD-fMRI signal is sensitive to small magnetic field variations. We have demonstrated that while the phase of the signal is strongly driven by global effects (local shimming), the use of a phase reference removes the unwanted global field effects allowing mapping very weak magnetic fields (∼10−9T) (Tomasi and Panepucci, 1999; Tomasi et al, 1998). In the present study, we demonstrated that the ‘relative phase’ (i.e., the phase change with respect to the first time point) of the BOLD-fMRI signal is not wrapped by global field effects and is modulated by the task, allowing whole brain mapping of task-related phase changes with high precision (Δψ > 0.5°; ΔB = Δψ/γTE > 1.3E-9 T).
The (left lateralized) occipital and prefrontal ψ-activation clusters (Figure 7 ‘Phase’) could be distant (one or more cm away) from the true (neuronal) activation sites (Ogawa et al, 1998), and reflect only a fraction of the common neurovasculature (large draining veins, such as the branches of the middle or the superior cerebral veins) across subjects. Note that the ψ-signal depends on vein orientation (θ; equation (2)), blood flow, and partial volume effects; therefore large veins could not have been mapped in Figure 7 ‘Phase’. Indeed, the association of the ventral prefrontal ψ-deactivation and subject motion (pitch rotation angle) suggest that phase changes in this region may reflect motion-related changes of the magnetic field distribution. Our findings on ψ-deactivation are further supported by previous studies that demonstrated motion-related changes in T2* relaxation near the sinus cavity (Caparelli et al, 2005). Therefore, small but stimulus-correlated motion of the head in the strong nonlinear magnetic field gradient produced by the sinus cavity may have resulted in a synchronous modulation of ψ in this region. Thus ρ-activation clusters in or near these regions may include unwanted contributions from the vascular pool or be motion related.
The proposed filtering method is based on (1) the detection of voxels with small (1.5° < ψ < 20° or 4° < ψ < 20°) but significant (P < 0.001, uncorrected) ψ-changes in the whole brain, and (2) the elimination of the time-dependent signal modulation at those voxels in the ρ-time series; this elimination is performed at early stages of image postprocessing (before spatial normalization and smoothing) to prevent further dispersion of the ψ-point spread function.
The lower significance of filtered activation clusters in the superior parietal, prefrontal and occipital cortices (Figure 7 ‘Filtered’) compared with the corresponding unfiltered (Figure 7 ‘Unfiltered’) clusters also suggest significant macrovascular contributions in these regions. Specifically, blood oxygenation changes in the superior cerebral veins and their pial and cortical branches may have contributed to the ρ-signal. These veins drain the superior, lateral, and medial surfaces of the brain and are mostly perpendicularly oriented to the scanners' magnetic field. Consequently, the task-dependent modulation of deoxyhemoglobin concentration in these veins could have modulated the magnetic field in both the microvascular and macrovascular pools in these cortices. The differential ‘Filtered > Unfiltered’ activation pattern depicts brain regions having significant ρ-, and ψ-effects across subjects, including the superior parietal cortex, medial frontal, middle, and inferior frontal gyri. Therefore, the middle cerebral vein, which begins on the lateral surface of the PFC and runs along the lateral cerebral fissure (Huettel et al, 2004), and its pial and cortical branches, could have also contributed to the BOLD-fMRI signal during working memory tasks.
Hence, the commonly observed large activation in the superior prefrontal as well as parietal regions in fMRI studies using working memory and other cognitive tasks may not reflect large recruitment of network resources in these regions during the tasks; activation in these regions could include significant macrovascular contributions reflecting neuronal activation at remote locations. Other activated regions (basal ganglia and cerebellum), however, did not show a stimulus-dependent modulation of the phase component of the MRI signal; therefore brain activation in these regions might not include significant macrovascular contributions and be more closely located to the sites of neuronal activation. This study further demonstrates that the phase component of complex BOLD-fMRI data sets can be used to produce activation patterns reflecting dynamic vascular changes in the brain.
Footnotes
Appendix A
Let us consider the magnetic field distribution,
Thus, considering the angle θ between the vessel and B0, the magnetization current can be
written as:
and the z-component of B can be calculated by direct integration of all wall elements
This equation can be solved by using the definite integrals (Gradshteyn and Ryzhik, 1980)
Thus, the solution of equation (A3) is given by