
Abstract
A recently reported quantitative magnetic resonance imaging (MRI) method denoted OxFlow has been shown to be able to quantify whole-brain cerebral metabolic rate of oxygen (CMRO2) by simultaneously measuring oxygen saturation (S v O 2 ) in the superior sagittal sinus and cerebral blood flow (CBF) in the arteries feeding the brain in 30 seconds, which is adequate for measurement at baseline but not necessarily in response to neuronal activation. Here, we present an accelerated version of the method (referred to as F-OxFlow) that quantifies CMRO2 in 8 seconds scan time under full retention of the parent method's capabilities and compared it with its predecessor at baseline in 10 healthy subjects. Results indicate excellent agreement between both sequences, with mean bias of 2.2% (P = 0.18, two-tailed t-test), 3.4% (P = 0.08, two-tailed t-test), and 2.0% (P = 0.56, two-tailed t-test) for SvO2, CBF, and CMRO2, respectively. F-OxFlow's potential to monitor dynamic changes in SvO2, CBF, and CMRO2 is illustrated in a paradigm of volitional apnea applied to five of the study subjects. The sequence captured an average increase in SvO2, CBF, and CMRO2 of 10.1 ± 2.5%, 43.2 ± 9.2%, and 7.1 ± 2.2%, respectively, in good agreement with literature values. The method may therefore be suited for monitoring alterations in CBF and SvO2 in response to neurovascular stimuli.
INTRODUCTION
The brain relies almost entirely on aerobic metabolism. Alterations in cerebral metabolic rate of oxygen (CMRO2) may represent an important index of metabolic dysregulation in common brain diseases including Alzheimer's, Parkinson's, multiple sclerosis, and Huntington's disease.1–4
So far, most studies involving measurement of CMRO2 have relied on positron emission tomography.5,6 Another method for CMRO2 quantification is based on measurement of brain oxygen saturation (SvO2) via jugular vein catheterization, 7 while the cerebral flow is measured by either optical coherence tomography or Doppler ultrasound.
In recent years, some noninvasive magnetic resonance imaging (MRI) approaches have emerged for measuring CMRO2 based on quantifying SvO2 via measurement of blood transverse relaxation time (T2).8–10 The most commonly used approach, T2-relaxation under spin tagging (TRUST), is combined with phase-contrast MRI to quantify the total cerebral blood flow (CBF). TRUST in its various embodiments8,11–14 has been found to be reliable and reproducible and has showed its usefulness in a number of translational patient studies including multiple sclerosis. 1 However, its relatively long acquisition time of about 4 minutes limits its utility for assessing dynamic CMRO2 changes in response to physiologic challenges.
In recent work by some of the authors, global CMRO2 was measured at 30-second temporal resolution, 15 here referred to as OxFlow (as the method quantifies both CBF and oxygen saturation in a single step). OxFlow was designed to quantify superior sagittal sinus (SSS) SvO2 by means of MR susceptometry-based oximetry16,17 and simultaneously CBF in the major arteries feeding the brain, by means of four interleaved gradient-recalled echoes alternating between brain and neck locations, yielding SvO2 and CBF.
The 30-second temporal resolution OxFlow was implemented to detect changes in CMRO2 in response to a hypercapnic challenge. 18 Measurement of cerebrovascular reactivity can be achieved by means of volitional apnea in the form of a breath-hold test (BHT). 19 Previous reports showed that BHT is useful to obtain functional information in patients with carotid occlusive disease.20,21 It also simulates the chronic intermittent hypoxia that occurs in obstructive sleep apnea, and thus the BHT may provide a particularly relevant metric of cerebrovascular reactivity in these patients. 22 However, OxFlow's acquisition time of 30 seconds limits the technique's use for obtaining time-resolved CMRO2 measurements in response to the BHT. More recently, a very fast (3-second temporal resolution) MRI method for whole-brain CMRO2 measurement that quantifies both SvO2 and CBF in the SSS was introduced. 23 However, the method requires an initial calibration step to quantify the SSS blood flow (SSS-BF) to total CBF (tCBF) ratio, allowing subsequent derivation of tCBF from continuously-measured SSS-BF.
There are several motivations for measuring neurometabolic parameters with high temporal resolution. Among these are blood oxygen level-dependent-based methods to ascertain whether the gas mixture breathing stimuli (hypercapnia and hyperoxia) 24 or breath-hold 25 are isometabolic and over what time frame. This is achievable by applying the technique via global stimuli. Apnea, as in obstructive sleep apnea is another important area of investigation. Again, this is associated with global variations in oxygen metabolism and is therefore assessable via global CMRO2 measurement.
The purpose of this work was to design and implement a substantially enhanced OxFlow sequence (henceforth referred to as fast OxFlow or F-OxFlow) that quantifies CMRO2 with fourfold increased temporal resolution (8 seconds) compared with the original implementation, 15 and to evaluate its performance at baseline and during a volitional apnea paradigm.
MATERIALS AND METHODS
Principle of Magnetic Resonance Imaging-Based Cerebral Metabolic Rate of Oxygen Quantification
Cerebral metabolic rate of oxygen is quantified by combining venous and arterial oxygenation and CBF using Fick's law:
26

where Ca is the blood's oxygen carrying capacity expressed in μmol O2 per 100 mL blood. Ca was calculated for each subject based on their hemoglobin level assuming 1.39 mL of O2 per gram of hemoglobin as the O2 carrying capacity of hemoglobin. 27 Global CBF represents the total in-flow through the feeding left and right internal carotid and vertebral arteries. SaO2 and SvO2 are the arterial and SSS venous oxygen saturation, respectively. For healthy subjects SaO2 was assumed to be 98% at baseline but during the volitional apneic paradigm SaO2 was monitored with a digital pulse oximeter clipped to the right middle finger.
The MR susceptometry-based oximetry was used to quantify SvO2 in the SSS instead of internal jugular veins to avoid severe static field inhomogeneity due to the proximity of oral cavity and trachea. Previous studies8,28 have shown good agreement between the SvO2 measured in the SSS and internal jugular veins SvO2.
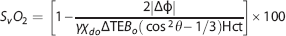
Susceptometry-based oximetry relies on measurement of the magnetic susceptibility difference ΔX = Xdo Hct (1 – SvO2/100) between the intravascular blood and surrounding tissue, with Xdo = 4π (0.27) p.p.m. representing the susceptibility difference (in SI units) between fully deoxygenated and fully oxygenated blood,
29
and Hct the hematocrit. By modeling the vessel as a long paramagnetic cylinder,16,17 the induced magnetic field (ΔB) relative to the surrounding tissue can be approximated as:

where θ is the vessel tilt angle relative to the main field Bo. Cerebral blood flow was quantified using a nongated phase-contrast technique as described in Jain et al. 15
Pulse Sequence for Cerebral Metabolic Rate of Oxygen Quantification
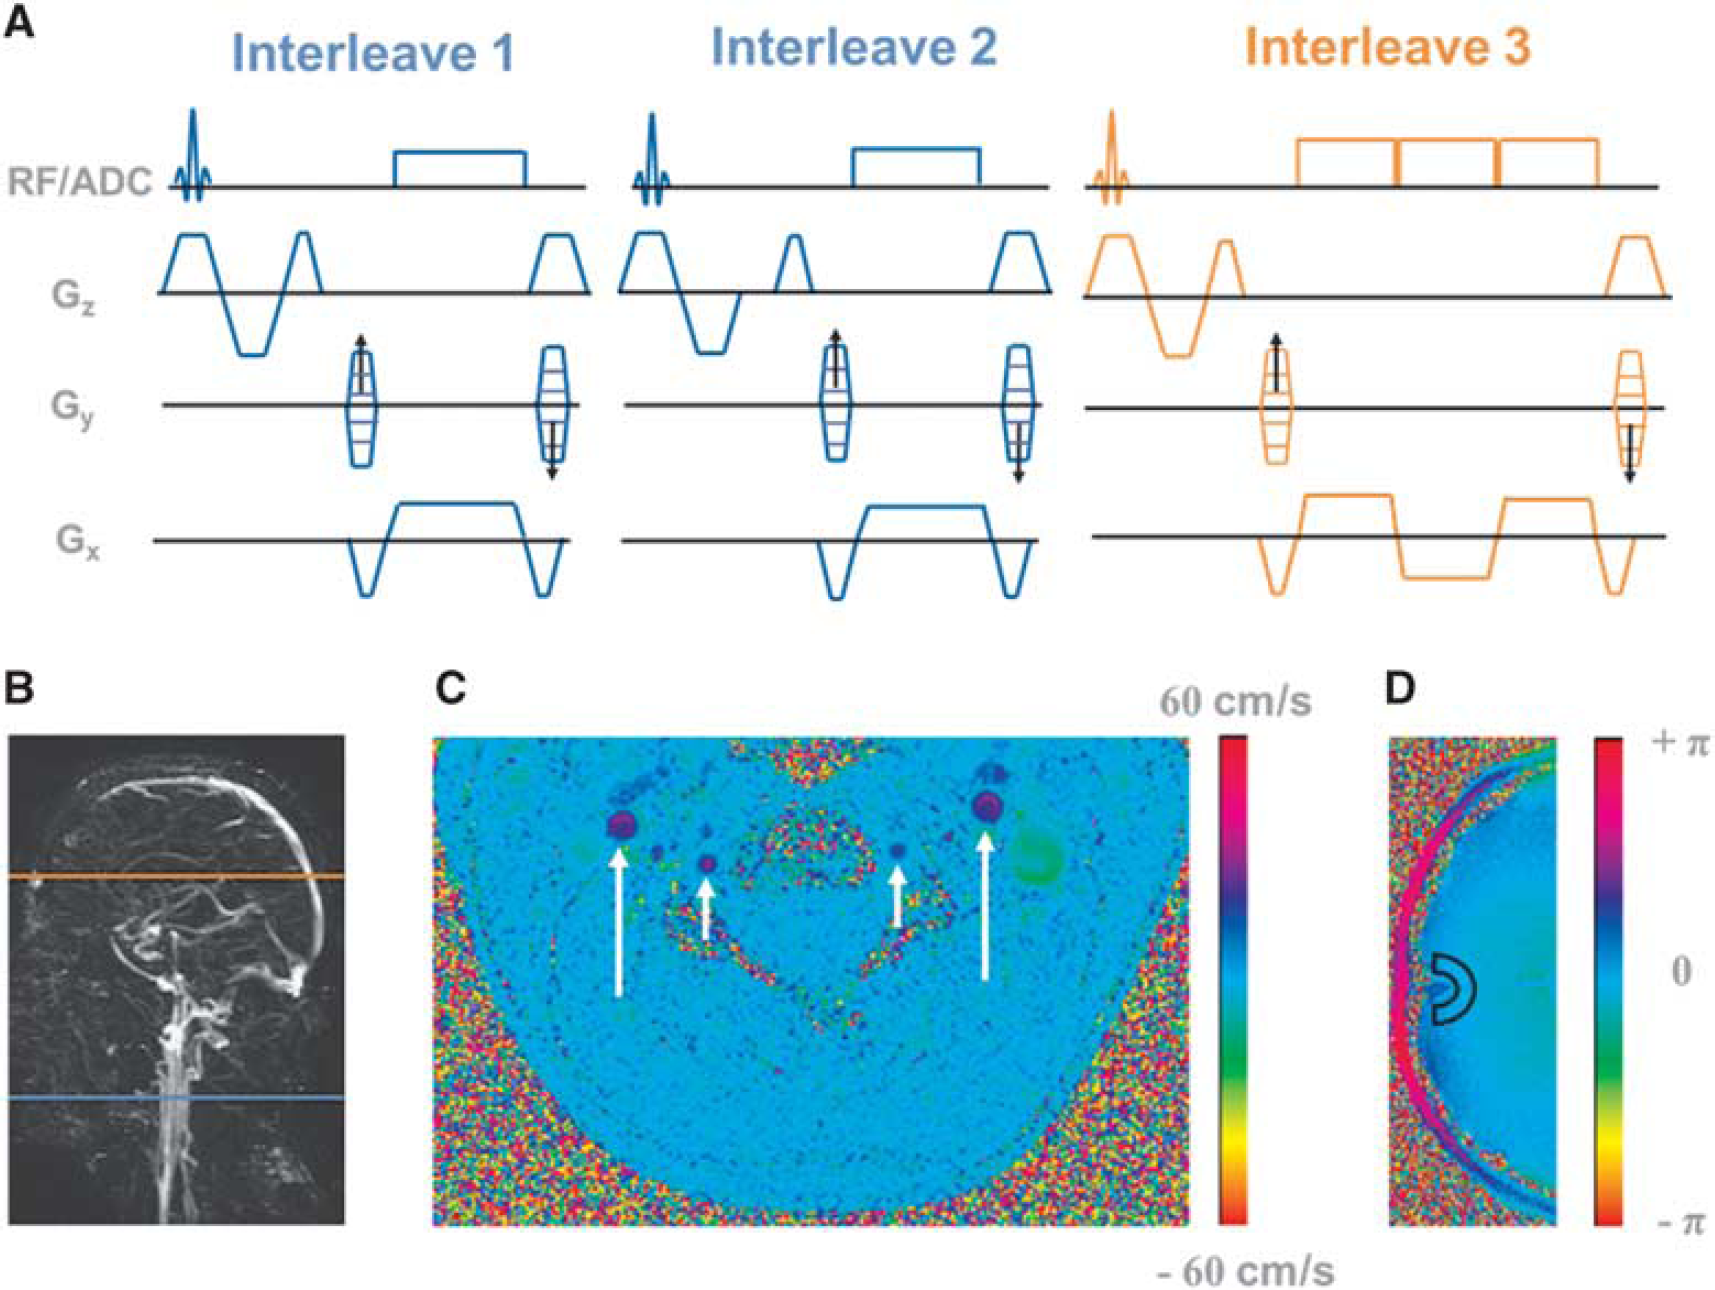
The parent OxFlow pulse sequence 15 was designed to simultaneously quantify SvO2 in the SSS and average blood flow velocity in internal carotid and vertebral arteries with four interleaves of RF-spoiled gradient-recalled echoes alternating between the two anatomic locations. To increase the temporal resolution of CMRO2 quantification, the OxFlow sequence was modified to three interleaves with a different acquisition order (Figure 1A). The order of interleaves and corresponding slice locations are shown in Figures 1A and 1B. Henceforth, the modified sequence will be referred to as fast OxFlow or F-OxFlow. Pulse sequences were coded in SequenceTree, an open-source integrated software environment, and exported to MRI scanner with a custom-designed export module. 30
(
All but the second interleave were flow compensated. The first and second interleaves were acquired above the carotid bifurcation to quantify CBF by computing the phase difference image (Figure 1C). In the first interleave, the first gradient moment (m1) of the slice-selection gradient (Gz) is nulled whereas in the second interleave the third lobe of Gz is shifted to yield m1 > 0. The third interleave acquires three echoes at the level of the SSS. However, the phase difference was computed between the equal-polarity echoes to quantify SSS SvO2. The second RF excitation pulse is applied at the level of the neck 12 ms after the first RF excitation, the third at the level of the SSS 12 ms after the second RF excitation pulse. The scheme of Figure 1A is repeated again 16 ms later. In this manner, spins at the level of the neck are excited with effective repetition times (TRs) of 12 and 28 ms, while at the level of the SSS TR = 40ms. Experiments were conducted with the following scan parameters: FOV = 208 × 208 mm 2 , slice thickness = 5 mm, matrix size = 208 × 208. Scan parameters for the first and second interleaves: bandwidth = 240 Hz/pixel, VENC = 60cm/s at baseline and 80cm/s during the apneic paradigm, flip angle = 15°; for the third interleave, bandwidth = 320 Hz/pixel, echo spacing (ATE) between equal-polarity echoes = 7 ms, flip angle = 16°.
The difference in the TR between interleave one and two is a potential cause of signal modulation from the inflow effect, which could lead to a systematic error in CBF quantification. Another source of error results from the slight difference in the T1 steady-state characteristics between the acquired signals used for CBF quantifications at interleaves one and two. However, the error associated with the variations in the T1 steady-state characteristics is negligible given the average longitudinal relaxation time of the arterial blood (1,700 ms), 31 which is two orders of magnitude longer than difference in TR between interleaves one and two.
The potential ramifications of these problems were investigated in four healthy subjects by using a three-interleave phase-contrast sequence. The first and third interleaves were flow encoded (VENC = 60cm/s) while the second interleave was flow compensated. Velocity maps were obtained from interleaves one and two, and two and three. To investigate potential bias caused by computing velocity maps with different degrees of T1 steady-state mismatch, a range of TR values were chosen for the third interleave (TR3 = 12, 16, 25, and 40 ms), while TR = 12 ms was used for first and second interleaves.
Image Processing and Analysis
For SvO2 quantification, a phase difference image (Figure 1D) was computed from echoes 1 and 3 in the third interleave as Δφmap = arg(Z1Z*3) = γΔB × ΔTE, where Z1 and Z3 are the complex pixel values of the two echoes and the asterisk indicates the complex conjugate; γ is the proton gyromagnetic ratio.
The static background field inhomogeneity is characterized by a low spatial-frequency modulation across the FOV so its effects can be approximated and reduced with a second-order polynomial.
32
After subtracting the polynomial fit from the raw phase difference image Δφmap, the phase difference (Δφ) between intravascular blood and surrounding tissue was computed to quantify SvO2 as:
For CBF quantification, a phase difference image (Figure 1C) was computed from the first and second interleaves.
Magnetic Resonance Imaging Experiments
All imaging was performed at 3T on a Siemens Tim Trio system (Siemens Medical Solutions, Erlangen, Germany) with a 12-channel head and neck coil combination. Human subject studies were approved by the Institutional Review Board of the University of Pennsylvania. Analysis of patient data was performed in accordance with the Declaration of Helsinki. Written consent was obtained from all subjects. Ten healthy human subjects (mean age = 33 ± 6 years, two females and eight males) participated in the study of baseline CMRO2, which consisted of measurement of SSS SvO2 and CBF at the level of the neck using 8-second and 30-second temporal resolution OxFlow sequences in the same session with five successive measurements being made for each method. Hct was measured for each subject via a capillary blood sample obtained from the fingertip (Hb 201+, Hemocue, Angelholm, Sweden).
The angiogram of the head and neck vessels was generated with a 2D time-of-flight sequence to determine the proper location of the axial plane transecting the SSS at approximately right angle, as well as the slice distal to the carotid bifurcation, and the tilt angle of the SSS with respect to Bo. 15 The location of both slices is indicated in the maximum intensity projection sagittal image (Figure 1B). Further, to calculate CMRO2 per 100 gram of brain mass, a T1-weighted 3D MPRAGE (magnetization-prepared rapid gradient-echo) image of 1 mm isotropic spatial resolution was acquired to estimate brain volume for each subject. A brain density of 1.05 g/mL was used to calculate the brain mass. 33
Quantification of Cerebral Metabolic Rate of Oxygen in Response to An Apneic Challenge
The apneic paradigm involved three repeated blocks of 32-second normal breathing baseline, 32-second breath hold apnea, and 88-second normal breathing recovery period. The time-course data of the apneic paradigm were averaged over the three repeated blocks to improve SNR. The subjects performed breath-hold at normal end expiration after being instructed to breathe in and breathe out. Arterial oxygen saturation (SaO2) was continuously measured during the apneic paradigm using a digital pulse oximeter.
To exclude artifacts from inspiration and expiration during the last 6 seconds of the baseline period, 23 the first three data points in the time-course data of the apneic paradigm were averaged to quantify baseline oximetric parameters value of SvO2, SaO2, and CBF, from which CMRO2 was derived. The average CMRO2 in response to the breath-hold challenge was quantified using the last two data points of the breath-hold challenge and the first point in the recovery period from the time-course data for each subject. In this manner, errors from residual signal modulations during successive inspiration and expiration before the start of the breath-hold period are minimized. 23 The temporal delay in the measured SaO2 using the pulse oximeter was corrected by shifting backward in time the measured SaO2 curve for each subject such that the oxygen resaturation in the arterial blood takes place approximately 8 seconds after the end of the breath-hold period. 23 This corresponds to the circulatory transport delay time between the lungs and brain. 34
RESULTS
Figure 1B shows an example of a sagittal localizer venogram indicating the location of SvO2 and CBF measurements. Representative phase difference images at two anatomic locations for velocity and SvO2 quantification are shown in Figures 1C and 1D, respectively.
The CBF values (i.e., CBF1 and CBF2) from both velocity maps quantified for four subjects using the three-interleave phase contrast sequence are listed in Table 1. The average fractional differences between CBF1 and CBF2 for TR3 ranging from 12 to 40 ms were 1.03%, 1.05%, 2.4%, and 2.5 %, i.e., the bias resulting from unequal TR is negligible.
CBF (mL/100 g/min) quantified from pairs of velocity-encoded images (referred to as CBF1 and CBF2) and the relative difference between them for a range of TR values for the third interleave in four subjects obtained with the three-interleave phase-contrast sequence
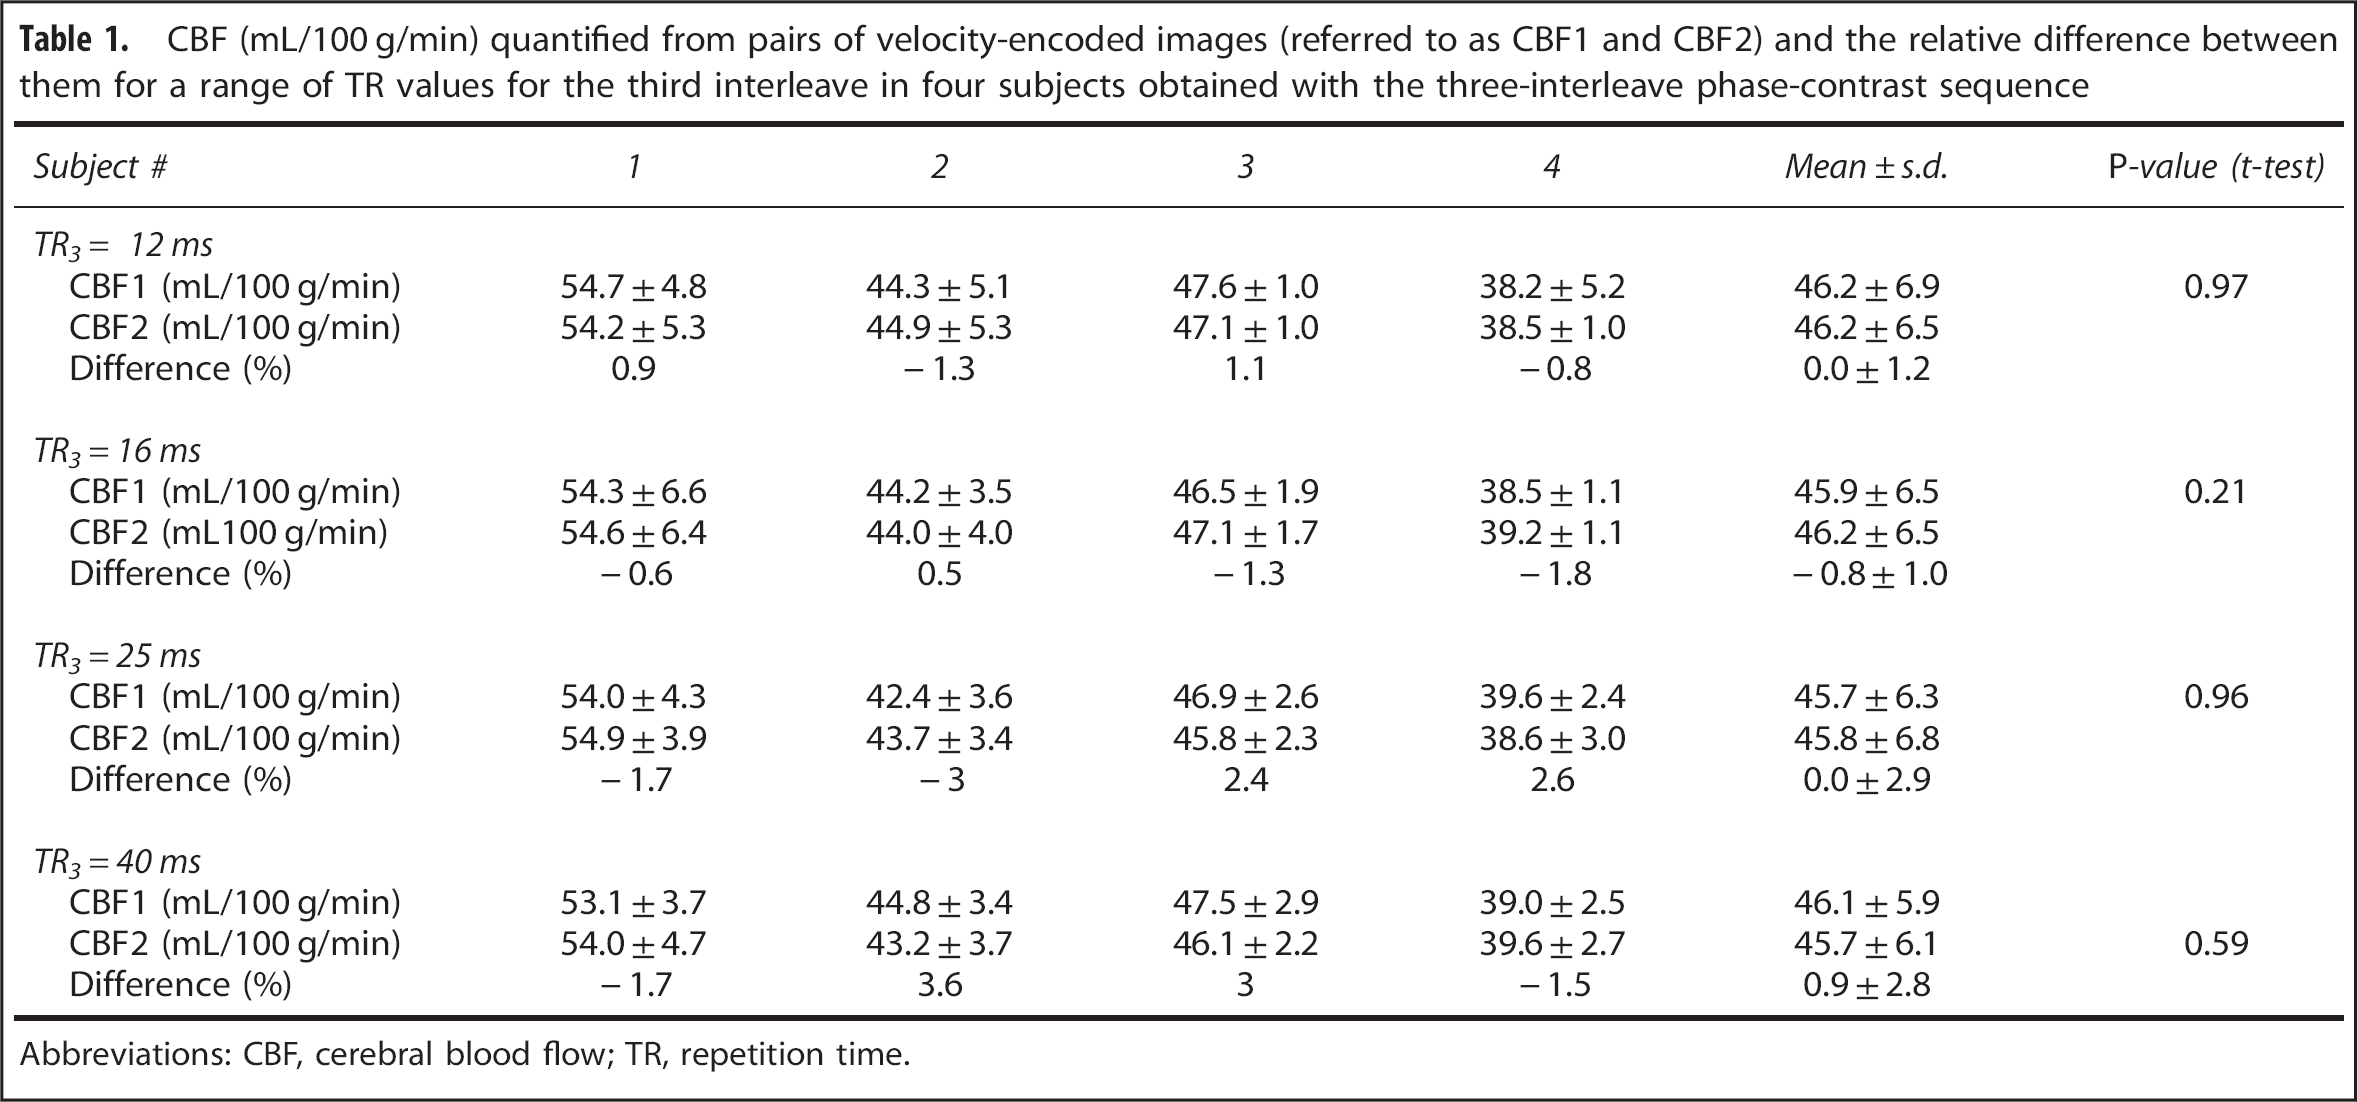
Abbreviations: CBF, cerebral blood flow; TR, repetition time.
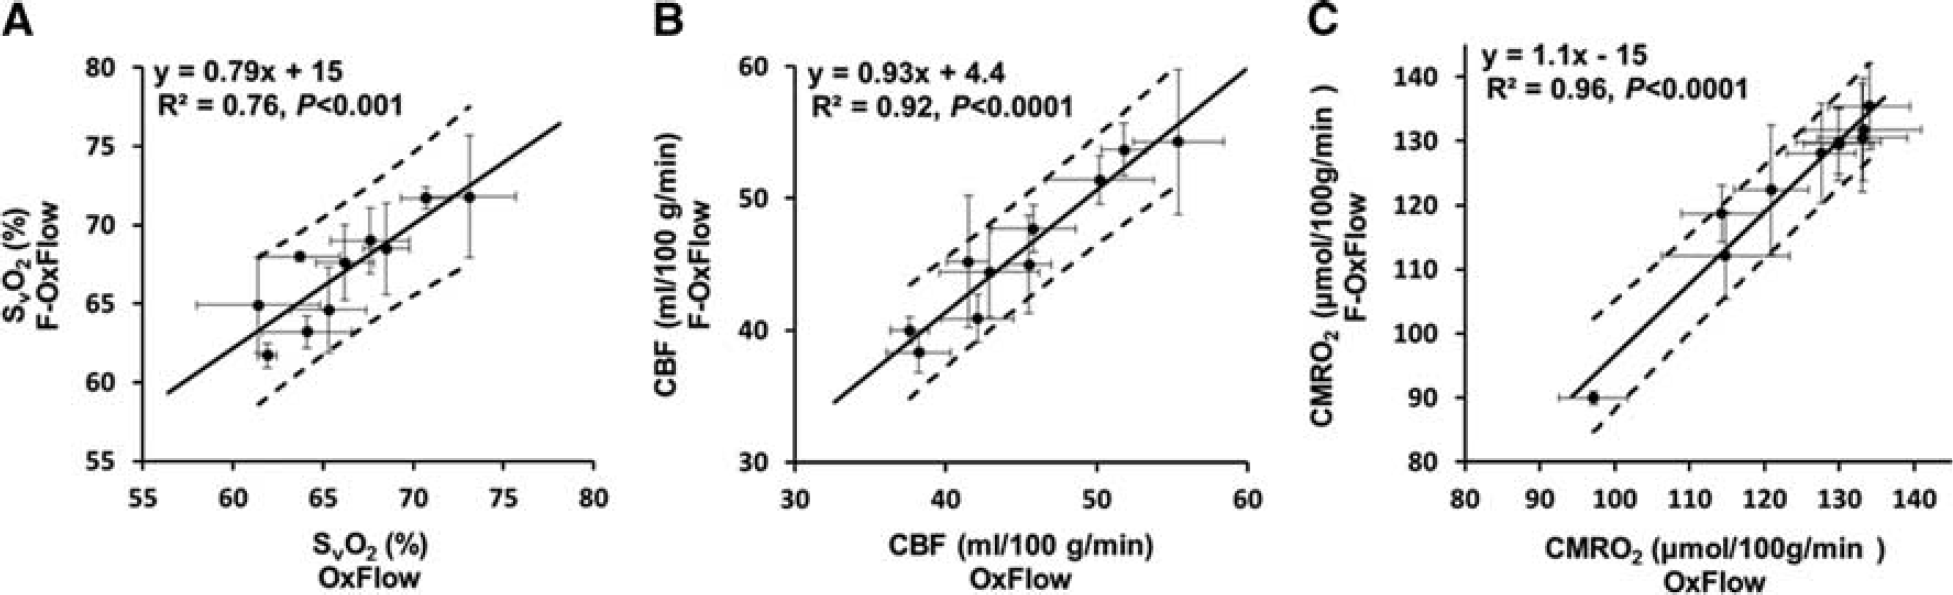
Baseline SvO2, CBF, and CMRO2 values quantified with OxFlow and F-OxFlow are listed in Table 2. Average SvO2, CBF, and CMRO2 values across all 10 subjects for F-OxFlow and OxFlow were 67.1 ± 3.4% and 66.3 ± 3.8% (P = 0.18, paired two-tailed t-test), 46.1 ± 5.6 and 45.1 ± 5.9 mL/100 g/min (P = 0.08, paired two-tailed t-test), and 123 ± 14 and 124 ± 12 (μmol/100 g/min) (P = 0.56, paired two-tailed t-test). These values are in good agreement with those reported recently in similar cohorts of young subjects.15,18 Further, a recent study by some of the authors of the current paper showed excellent agreement between susceptometry-based oximetry and TRUST in quantifying venous oxygenation (SvO2). 35 It thus seems appropriate to compare F-OxFlow with its parent version. Figures 2A to 2C show correlations of the quantified parameters between the data obtained with the two methods. All three functional parameters were strongly correlated among the two sequences: SvO2 (R 2 = 0.76, P < 0.001), CBF (R 2 = 0.92, P < 0.0001), and CMRO2 (R2 = 0.96, P < 0.0001).
Oximetric parameters (means ± s.d.) at baseline: SvO2 (%), CBF (mL/100 g/min), CMRO2 (μmol/100 g/min) for 10 subjects obtained with F-OxFlow and OxFlow
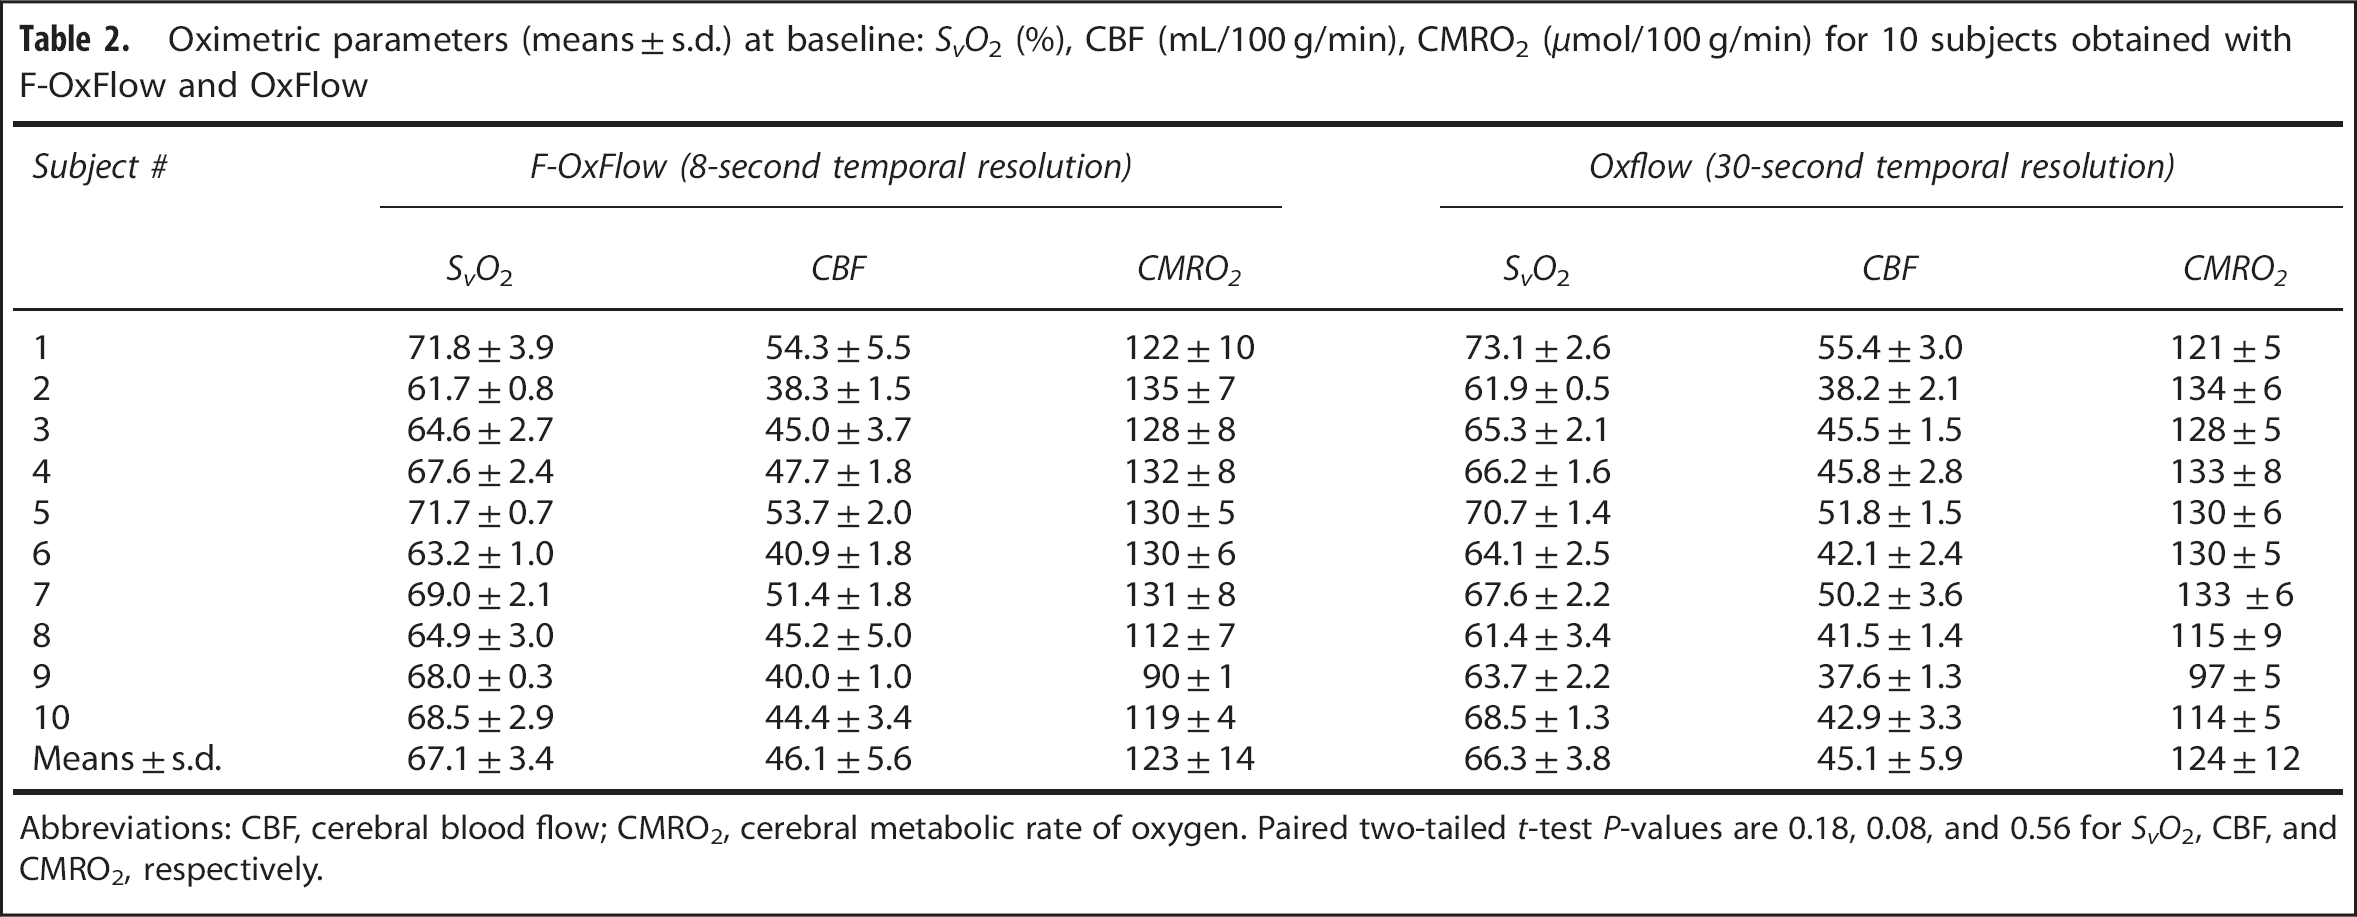
Abbreviations: CBF, cerebral blood flow; CMRO2, cerebral metabolic rate of oxygen. Paired two-tailed t-test P-values are 0.18, 0.08, and 0.56 for SvO2, CBF, and CMRO2, respectively.
Correlations comparing SvO2 (
The sensitivity of the sequence in capturing changes in the oximetric parameters in response to a breath-hold challenge is illustrated in Figure 3, which represents the group-averaged time-course plots over five subjects of the measured parameters SvO2, SaO2, CBF, and CMRO2. The data show the expected increases in CBF and SvO2 along with a slight reduction in SaO2. Average increases in SvO2, CBF, and CMRO2 were 10.1 ± 2.5% (P = 0.0008, two-tailed t-test), 43.2 ± 9.2% (P = 0.0005, two-tailed t-test), and 7.1 ± 2.2% (P = 0.002, two-tailed t-test), respectively, while the average decrease in SaO2 was −3.4 ± 0.9% (P = 0.0011, two-tailed t-test). The average baseline values, average maximum values, and average change (i.e., increase or decrease) in SvO2, SaO2, CBF, and CMRO2 for the five subjects evaluated are listed in Table 3.
Summary of the average values of oximetric parameters (means ± s.d.): SvO2 (%), SaO2 (%), AVO2 (%), CBF (mL/100 g/min), and CMRO2 (μmol/100 g/min) at rest state and in response to breath-hold challenge for five subjects obtained with F-OxFlow (P = 0.0008, 0.0005, and 0.002 for SvO2, CBF, and CMRO2, respectively)
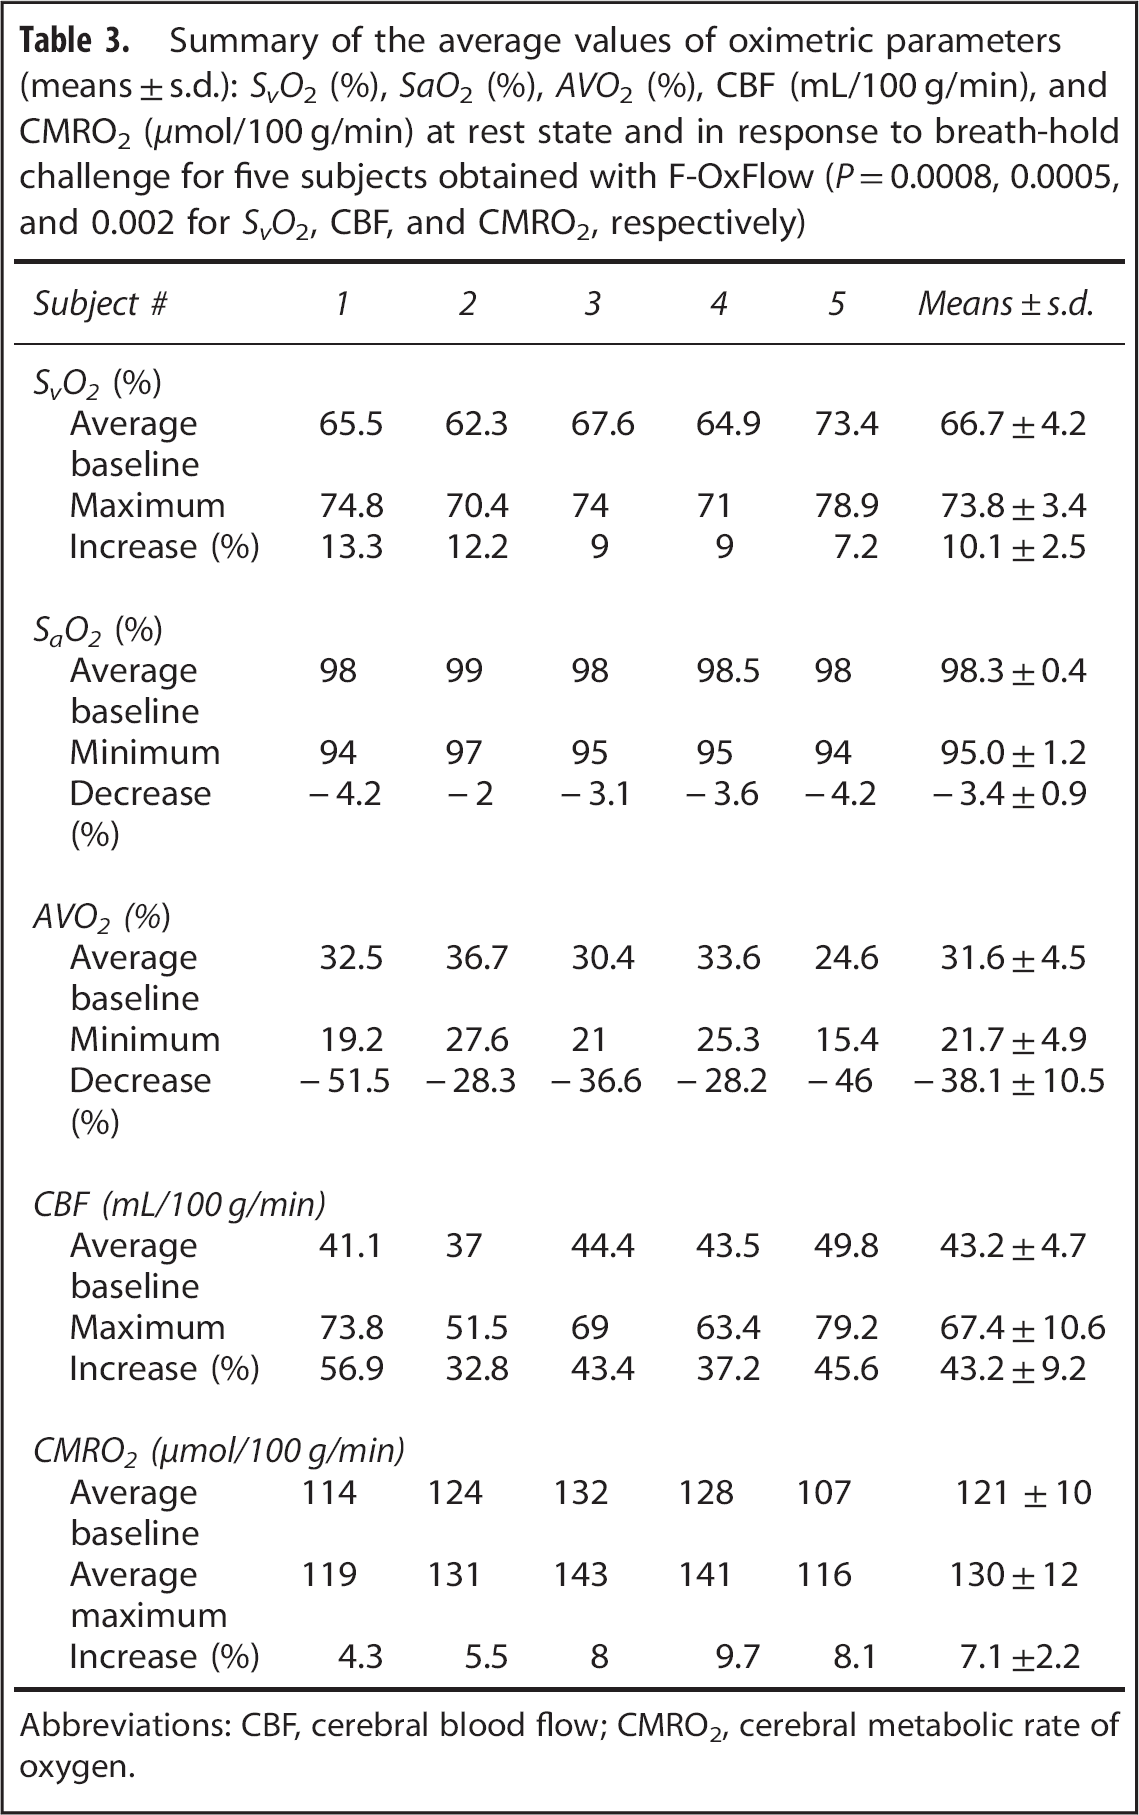
Abbreviations: CBF, cerebral blood flow; CMRO2, cerebral metabolic rate of oxygen.
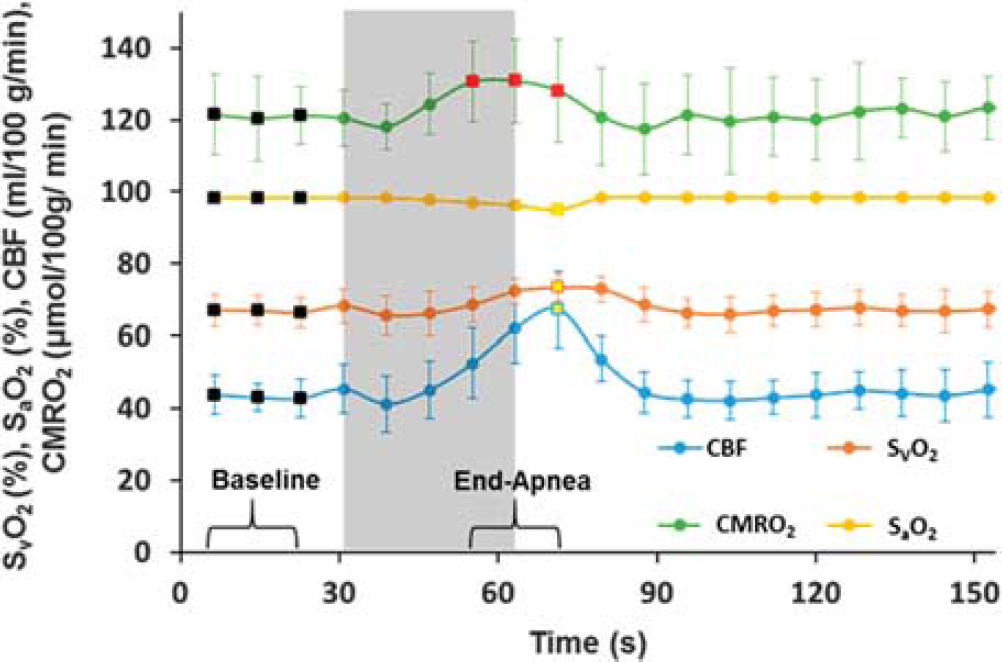
Group-averaged time-course SvO2 (%), SaO2 (%), cerebral blood flow (CBF) (mL/100 g/min), and cerebral metabolic rate of oxygen (CMRO2) (μmol/100 g/min) over five subjects during an apneic paradigm. The shaded area represents the volitional apnea period. Average values of the oximetric parameters at baseline were calculated from the first three data points (black-filled squares corresponding to the bracketed section ‘Baseline’) from the time-course data for each subject. The average CMRO2 in response to volitional apnea is calculated from the three CMRO2 data points (red-filled squares corresponding to the bracketed section ‘End-Apnea’) from the time-course data for each subject. Maximum SvO2 and CBF and the minimum SaO2 values were calculated using data points denoted by the yellow-filled squares from the average time-course data of the five subjects.
DISCUSSION
An MRI-based method denoted OxFlow has recently been reported for quantifying whole-brain CMRO2 in 30 seconds scan time. 15 Although adequate for assessing baseline CMRO2 and in response to hypercapnia, 18 the metabolic response to the stimulus often takes place on a shorter time-scale.
Here, we designed and implemented a substantially faster version of the parent OxFlow pulse sequence 15 that allows for simultaneous quantification of SSS SvO2 and CBF in 8 seconds. The shortened scan time makes the technique potentially suited for monitoring dynamic changes. Comparison of the performance of the two sequences yielded strong correlations for SvO2 (R 2 = 0.76, P < 0.001), CBF (R 2 = 0.92, P < 0.0001), and CMRO2 (R 2 = 0.96, P < 0.0001) (Figure 2). Further, the data indicate excellent agreement between both sequences with mean absolute differences of 2.2%, 3.4%, and 2.0% for SvO2, CBF, and CMRO2, respectively, none of the means being significantly different from each other (P = 0.18, P = 0.08, and P = 0.56 for SvO2, CBF, and CMRO2, respectively). Each measurement was repeated five times consecutively in each session resulting in an average SD in the quantified SvO2, CBF, and CMRO2 of 2.0%, 2.8%, and 6.4%, respectively (Table 2). The data suggest that at baseline the quantified SvO2, CBF, and CMRO2 to be stable physiologic parameters.
The data in Figure 3 suggest that F- OxFlow is able to monitor the hemodynamic and metabolic changes occurring during an apnea paradigm. Although Doppler ultrasound 36 and near-infrared spectroscopy 37 have provided insight into the physiologic response to apneic events in subjects with obstructive sleep apnea, the latter two techniques detect the relative dynamic changes in either CBF or cerebral tissue oxygenation, rather than CMRO2 in absolute physiologic units. Our results are in good quantitative agreement with those reported for a nearly identical paradigm using a rapid MRI-based technique in which both CBF and SvO2 were measured in the SSS. 23 The observed increase in CMRO2 likely arises because breath-hold (i.e., volitional apnea) is a mixed hypercapnic/hypoxic stimulus. In a previous study by some of the authors of the present paper based on a similar susceptometric approach showed that hypercapnia is isometabolic. 18 However, T2-based oximetry (i.e., TRUST) showed 5 ± 2% increase of CMRO2 in response to mild hypoxia. 10 Therefore, the increase in CMRO2 in response to volitional apnea is plausible, if seen as a combination of isometabolic (hypercapnia) and pro-metabolic (hypoxia) stimuli, as observed in recent work by Rodgers et al. 23
To achieve accurate nontriggered PC velocity quantification, it is necessary to minimize the inflow-related blood signal modulation between successive pulse cycles due to variation in blood-flow velocity during the cardiac cycle. 38 Of course, as long as TR is long enough for complete spin replacement between successive excitations, no amplitude modulation can occur. This is easily achieved in OxFlow where the slice thickness and effective TR are 5 mm and 70 ms, respectively, i.e., blood water protons will be refreshed for average blood flow velocity as low as 7.2 cm/s. However, in F-OxFlow the duration of the pulse sequence cycle at the level of the flow measurement is much shorter, alternating between 12 and 28 ms. Nevertheless, our data comparing F-OxFlow to the parent pulse sequence (Table 1) indicate nonsignificant bias in the extracted data. These findings are in accordance with results by Bakker et al, 38 who showed that for monophasic flow waveforms (such as carotid and vertebral arteries) signal modulation for small flip angles ≤ 15° is negligible as a source of error in nontriggered phase-contrast velocity measurements.
In recent work by some of the present authors, a three-second temporal resolution sequence was reported for quantification of CMRO2 by measuring both SvO2 and CBF at the SSS (SSS-BF) instead of in the neck arteries. 23 This sequence, although faster by a factor of 2.5, requires running a 12-second phase-contrast reference scan with two-slice interleaves alternated between the SSS and neck arteries at baseline. The reference sequence is required to estimate tCBF from the SSS-BF:CBF ratio at baseline. In dynamic applications such as the study of the response to breath-hold, it is assumed that SSS-BF:CBF ratio remains constant during the paradigm. This ratio was shown to remain constant for healthy subjects in response to a mixed hypercapnic-hypoxic paradigm. 23 However, it is conceivable that this ratio could vary during physiologic challenges in certain disease populations, for example, those with disorders affecting venous hemodynamics. Recently, a simplified version of the OxFlow technique in which, similarly, both SvO2 and tCBF were measured in the SSS, has been applied in a translational study in neonates. 39 However, rather than measuring the SSS-BF:CBF ratio it was assumed to be 50%.
One potential problem of all methods designed to quantify temporal changes in AVO2 (such as induced apnea) is pulse oximetry used for measuring SaO2. Errors resulting from poor perfusion at the measurement site (e.g. finger) may provide false readings. 40 In principle, SaO2 can be quantified in the internal carotids and vertebral arteries using MR susceptometry. However, the presence of the trachea and air spaces in the neck cause severe static field inhomogeneities, making it difficult to measure SaO2 in the neck arteries. Further, it is challenging to detect small desaturation effects since the phase difference of the signal with respect to tissue is small. This is an area of future investigation, especially with the better background field removal methods that now exist. Finally, all image reconstruction and analysis is currently performed offline from the raw k-space data. The logical next step will be to more tightly integrate the processing into the scanner's pipeline and operator console to facilitate its use in a clinical setting.
In conclusion, we have introduced an accelerated version of an MRI-based method that allows estimation of global brain CMRO2 at 8-second temporal resolution by simultaneously quantifying CBF and SvO2. The method may be suited for monitoring the response to nonsteady-state stimuli such as apnea.
Footnotes
MCL, ZBR, and FWW conceived the study and edited the manuscript. MCL, ZBR, JFM, and CL contributed to the development of the MRI pulse sequences. SB analyzed and drafted the manuscript. CSR contributed to data interpretation. All authors reviewed the manuscript critically for intellectual content, and read and approved the final manuscript.
The authors declare no conflict of interest.