
Abstract
Vasoreactivity to hypercapnia has been used for assessing cerebrovascular tone and control altered by ischemic stroke. Despite the high prognostic potential, traits of hypercapnia-induced hemodynamic changes have not been fully characterized in relation with baseline vascular states and brain tissue damage. To monitor cerebrovascular responses, T2- and T2∗-weighted magnetic resonance imaging (MRI) images were acquired alternatively using spin- and gradient-echo echo plannar imaging (GESE EPI) sequence with 5% CO2 gas inhalation in normal (n = 5) and acute stroke rats (n = 10). Dynamic relative changes in cerebrovascular volume (CBV), microvascular volume (MVV), and vascular size index (VSI) were assessed from regions of interest (ROIs) delineated by the percent decrease of apparent diffusion coefficient (ADC). The baseline CBV was not affected by middle cerebral artery occlusion (MCAO) whereas the baseline MVV in ischemic areas was significantly lower than that in the rest of the brain and correlated with ADC. Vasoreactivity to hypercapnic challenge was considerably attenuated in the entire ipsilesional hemisphere including normal ADC regions, in which unsolicited, spreading depression-associated increases of CBV and MVV were observed. The lesion-dependent inhomogeneity in baseline MVV indicates the effective perfusion reserve for accurately delineating the true ischemic damage while the cascade of neuronal depolarization is probably responsible for the hemispherically lateralized changes in overall neurovascular physiology.
INTRODUCTION
Systemic hypercapnia, induced by inhaling excessive CO2, is known to evoke significant cerebral vasodilation, in which both the overall cerebral blood volume (CBV) and the blood flow (CBF) are dramatically elevated.1,2 Such vasodilatory effects are related to changes in extracellular fluid pH that accompany the blood pCO2 increase. The extracellular pH change directly mediates several mechanisms capable of controlling smooth muscle cells via (1) ATP-sensitive K+ channels, (2) prostanoids derived from cyclooxygenase-1, and (3) nitric oxide signaling to maintain homeostasis under normal healthy brain condition. In occlusive cerebrovascular diseases, the vascular responsiveness to a vasodilator (e.g., PaCO2) is expected to be impaired in brain regions where the cerebral perfusion pressure is below the low limit of autoregulation. In this regard, induction of systemic hypercapnia has been used to estimate the disrupted vascular tone and maximum cerebral perfusion reserve after stroke for assessing ischemic brain damage and vascular status.3–5 Moreover, mild hypercapnia has been even suggested as a therapy option due to the strong vasodilatory response.6,7
In the study of altered cerebrovascular tonus after focal or global cerebral ischemia, most investigations have focused to monitor changes in CBF. A number of studies using autoradiography with C 14 -iodoantipyrine, 8 microspheres, 9 or magnetic resonance imaging (MRI) 10 reported that the CO2 reactivity in CBF is abolished in the ischemic core but partially remains in the brain tissue surrounding the core area (peri-infarct zone). Although the reduced perfusion response to hypercapnia may indicate a lack of cerebrovascular tone and control, the link between ischemic cell damage and such disrupted hemodynamics has not been validated. In particular, we hypothesized that characterization of microvascular blood distribution in respect to tissue blood content is required to confirm the utility of hypercapnic stimulation. In fact, among all vascular populations, capillary bed offers the main site of chemical exchange, nutrient delivery, and waste product removal, thus the welfare of microvascular environment is in direct association with brain cell survival. Although quantitative measurement of total CBV has been often performed for understanding brain pathophysiology in ischemic stroke,11,12 microvascular parameters have been overlooked mostly due to technical difficulties. In the current study, using a novel MRI method and animal stroke model, (1) characteristics of the hypercapnia-induced responses in different vascular populations and (2) interdependence among multiple MRI-derived hemodynamic and tissue parameters were investigated to understand whether the hypercapnic stimulation could be used to delineate localized cellular and vascular damage.
Among modalities used to quantify vascular responses, MRI provides a unique means for noninvasively quantifying physiologically relevant hemodynamic parameters (i.e., blood oxygen level-dependent (BOLD) signal, CBF, and CBV) with excellent structural resolution. Until recently, most MRI studies have used BOLD signals to investigate the neurovascular effects of stimulants and inspired gases.13,14 However, because BOLD signal is derived from multiple independent vascular parameters including blood oxygenation, CBV, CBF, and cerebral metabolic rate of O2, interpretation of BOLD signal is not always straightforward. To compensate such demerits and improve the measurement sensitivity of vascular parameters, the use of nonleaky intravascular MR contrast agents, such as superparamagnetic iron oxide nanoparticles (SPION) with a long half-life in the blood pool15,16 has been introduced to evaluate both relative and regional CBV changes as well as the relative blood volume changes pertaining only to microvasculature (i.e., microvascular volume (MVV)).
Magnetic resonance imaging signals acquired using gradient-echo (GE) sequence before and after intravenous administration of SPION reveal the total relative CBV (rCBV, ~ ΔR2*),17,18 while spin-echo (SE) MRI signal is sensitive to the relative blood volume occupying small sized microvessels (rMVV, ~ ΔR2).15,19,20 In addition, the vessel radii (vessel size index, VSI) can be estimated by calculating the ratios of relaxation rate changes (ΔR2*/ΔR2), which was previously showed to be linearly proportional to the vessel radius.21,22 As such, the use of several MRI techniques in concert provides extensive vascular information and can facilitate the detection of spatial and temporal changes in neurovascular physiology.
Our previous study showed significant rCBV, rMVV, and VSI responses to systemic hypercapnia in normal cerebral tissue. In this study, repeated hypercapnic stimulations were performed sequentially to obtain separate GE and SE signals for rCBV and rMVV measurements, respectively, in which not only additional scan time but also the recovery time to baseline (> 5 minutes) had to be considered. 23 In the application of the hypercapnia-induced hemodynamic response (i.e., vasoreactivity) to assess acute stroke, it is apparent that simultaneous acquisition of both GE and SE sequences is advantageous since the short total acquisition time would minimize the measurement error derived from rapidly changing animal physiology. For this purpose, gradient- and spin-echo (GESE) echo plannar imaging (EPI) is used in the current study, which continuously alternates GE and SE EPI to capture time-dependent hemodynamic events in a synchronous manner. Such dynamic visualization of vasoreactivity at the multiple vascular levels offers a technical advantage for real-time monitoring of vascular events and is expected to improve our understanding of ischemic tissue function and the related neurovascular damage. The experiments were designed to characterize the relationship between the MRI-derived vasoreactivity in response to hypercapnia and baseline vascular states during the acute stage of ischemic stroke and with the specific goal to test whether the impaired vascular control correlates with acute tissue damage defined by decreased apparent diffusion coefficient (ADC).
MATERIALS AND METHODS
All procedures used in this study performed according to a protocol approved by the Massachusetts General Hospital Subcommittee on Research Animal Care, in accordance with the guidelines established by the Institutional Animal Care and Use Committee.
Theory
The compartmentalization of paramagnetic contrast agent within the vasculature induces long-range magnetic field perturbations that extend over many microns and increases the transverse relaxation rates (R2 and R2*) of tissue. Since susceptibility contrast mechanisms designed to study the distribution of vessel sizes entirely rely on the compartmentalization of the contrast agent within the vasculature, SPION, a large intravascular T2 contrast agent, can be used to measure the regional relative CBV, which itself is a nonlinear function of the blood flow.15,16 In this study, ΔR2 and ΔR2* changes before and after injection of SPION were measured. Using the different dependence of ΔR2 and ΔR2* sensitivity on vascular geometry (i.e., vessel radius), VSI was defined by ΔR2*/ΔR2 ratio to provide a measure of the average blood vessel size.21–24 Assuming a monoexponential signal decay, the enhancement of R2 and R2* caused by SPION can be expressed in forms of relative vascular volumes as follows:


Animal Preparation
Adult Male Wistar rats (Charles River, MA, USA) weighing 280 to 300 g were used for this study. Both stroke (n = 10, with permanent middle cerebral artery (MCA) occlusion (MCAO)) and control (n = 5, without MCAO) groups were randomly chosen from these subjects. For MCAO surgery, the rats were anesthetized with 1.5% isoflurane in 70% N2O/30% O2 (flow rate, 1.0 L/min), and then the right MCA was permanently occluded using the intraluminal filament technique as previously described. 29 In brief, the common carotid artery and the proximal pterygopalatine artery were ligated using 4-0 silk suture. Thereafter, the superior thyroid and occipital branches of the external carotid artery were electro-coagulated and transected. This was followed by ligation, electrocoagulation, and transect of the external carotid artery, creating a stump to allow a commercialized silicon rubber-coated 5-0 nylon monofilament (tip diameter: 0.31±0.02 mm) to advance 18 to 19 mm from the carotid bifurcation, along the internal carotid artery for the occlusion of the MCA permanently. The GESE EPI scan was initiated ~ 3 hours after the MCAO onset.
One femoral artery and both femoral veins were cannulated using polyethylene catheters (PE50). One venous catheter was used for infusion of SPION and the arterial catheter was used for monitoring mean arterial blood pressure and blood gas analysis. The other venous catheter was inserted to accommodate continuous infusion of anesthesia solution (α-chloralose) containing muscle relaxant (pancuronium bromide). The change of anesthesia regimen to α-chloralose was based on the previous studies2,18,24 and used to avoid the neuronal activity suppression and blood vessel dilation that are typically associated with the use of isoflurane. 30 Animals were tracheotomized and mechanically ventilated with 1.5% isoflurane in 50% air/50% oxygen at a respiratory rate of 35 to 40 breaths/min, 23 in which the oxygen concentration was determined from the in-house experience to ensure the stable physiologic conditions in blood pressure, body temperature, oxygen saturation, and heart rate.23,24 Before each MRI experiment, the anesthetic regimen was switched from the isoflurane gas mixture used for surgery to continuous infusion of α-chloralose (30 mg/kg per hour), preceded by a loading bolus (35 mg/kg).
Concurrently with α-chloralose administration, rats were paralyzed with an intravenous bolus of pancuronium bromide (1.2 mg/kg), which was followed by continuous infusion (1 mg/kg per hour). Animals were secured in an MR-compatible rat stereotaxic headset with ear and tooth bars throughout the experiment, during which a temperature-controlled water blanket was placed under the rat's torso to maintain the body temperature at 37.0°C.
Gas Stimulation Paradigm
The hypercapnic challenge involved an exposure to a premixed gas consisting of 5% CO2, 47.5% air, and 47.5% oxygen. Each gas trial included a 2-minute baseline (50% air and 50% oxygen), a 5-minute hypercapnia (5% CO2, 47.5% air, and 47.5% oxygen), and a 5-minute return to baseline (50% air and 50% oxygen). The inspired gas mixtures were manually controlled using a multi-gas flowmeter (Surgivet/Anesco, Colonial Medical Supply, Waukesha, WI, USA).
Magnetic Resonance Image Acquisition
The MRI measurements were performed using a horizontal bore 9.4 T Bruker/Magnet system equipped with a gradient coil (peak strength = 440 mT/m; peak slew rate = 3,440 T/m/s) and a home-built rat head surface transmit-receive RF coil, approximately 30 mm in diameter. Magnetic field homogeneity was optimized by automatic shimming (Bruker Biospec, Billerica, MA, USA). Before GESE EPI, multi-slice multi-echo sequence (MSME) was performed to outline the brain anatomy. Parameters for the MSME sequence were repetition time = 3,000 ms, echo time = 15, 30, 45, 60, 75, 90, 105, and 120 ms, field of view = 2.35 × 2.35 cm2, matrix = 80 × 80 (resolution 0.294 mm), slice thickness = 1 mm, 16 slices, and scan time = 4 minutes. To delineate the lesion and draw the ADC-defined regions of interest (ROIs), a single-shot echo-planar diffusion tensor imaging data set was acquired with the following parameters: repetition time = 9,000 ms, echo time = 50 ms, field of view =2.35 × 2.35 cm2, matrix = 80 × 80 (resolution 0.294 mm), number of diffusion direction = 7 and b factor = 0, 800 seconds/mm2, and scan time = 4 minutes 12 seconds. Field of view, matrix size, slice thickness, and number were same with the MSME sequence.
For the simultaneous monitoring of rCBV and rMVV responses, T2- and T2*-weighted images were acquired alternatively using the newly developed GESE EPI sequence before (preGESE, repetition number = 20, 2 minutes) and after (postGESE, repetition number = 120, 12 minutes) administering SPION (20 mg/kg). PostGESE sequence is composed of prehypercapnia (duration for baseline measurement, 2 minutes), hypercapnia (duration of stimuli, 5 minutes), and posthypercapnia (duration of rest, 5 minutes) periods. Repetition time/echo time for GE and SE was 3,000/15.16 ms and 3,000/27.73 ms, which resulted in the average signal-to-noise ratio of 17.04±2.56 and 16.84±2.08 for GE and SE EPI images, respectively. Other geometric parameters such as field of view, slice thickness, and number were the same as the MSME and diffusion tensor imaging sequences except for the matrix size. The spatial and temporal resolutions for the GESE were 0.367 mm and 6 seconds, respectively.
Data Analysis
Analysis of Functional NeuroImages was used for all MRI signal analysis. Image conversion into the Analysis of Functional NeuroImages format, motion correction, image separation of SE and GE, calculation of cerebrovascular parameters, defining ROIs, adjustment of spatial resolution, and vasoreactivity analysis during the hypercapniawere performed using Analysis of Functional NeuroImages. Voxel-wise hemodynamic maps were calculated described by the equation (1, 2, 3) over the postGESE scan time. The MRI time courses were analyzed using the standard general linear model approach. 31 The functional activation maps from CO2 stimuli were acquired, for which the stimulus paradigm is convolved with the respective hemodynamic response function for rCBV, rMVV, and VSI, to generate a maximum likelihood estimator. The relative contrast-to-noise was computed using a t-test provided by deconvolution program (http://afni.nimh.nih.gov/pub/dist/doc/program_help/3dDeconvolve.html) between the baseline (during the last 30 seconds before the hypercapnic challenge) and hypercapnia (during the last 30 seconds before the CO2 is turned off) period after the injection of SPION. The spatial resolution of ADC maps produced from diffusion tensor imaging data sets resolution (0.294 mm) was interpolated to match that of the functional hemodynamic voxelwise maps (0.367 mm) using the reorientation program (http://afni.nimh.nih.gov/pub/dist/doc/program_help/3dresample.html). Regions of interest were classified by the percent decrease of ADC compared with the contralesional cortex. (1) core: area with greater than 35% decrease in ADC, (2) peri-infarct: area with ADC decrease between 15% and 35%, (3) subnormal: subcortex, and (4) cortex-normal: cortex area with the ADC decrease less than 15%. Regions of interest in contralesional hemisphere were placed in the homologous regions of the ipsilesional hemisphere.
Quantitative analysis of the lesion sizes, baseline blood volumes, and vasoreactivities were performed using ADC-defined ROIs. The Friedman test was performed to compare the CO2 reactivity and baseline differences among three kinds of ROI, which were obtained from the normal rat brain, ipsilesional and contralesional of the stroke rat brains. For analysis of the relationship between the core/peri-infarct size and baseline blood volume, and core/peri-infarct size and the vasoreactivities during hypercapnia, the correlation coefficients squared (R 2 ) were calculated using regression and nonparametric correlation analysis (Spearman correlation) method. An R 2 indicated the degree of correlation, in which R 2 values were divided into three groups: 0.3 to 0.49, 0.5 to 0.69, and >0.7 showing mild, moderate, and strong correlation groups, respectively. Wilcoxon rank-sum test was performed to compare the baseline and the vasoreactivity during hypercapnia between the normal and stroke group, Wilcoxon signed-rank was for the internal difference measurements in the individual rats. All statistical significance was accepted at a confidence level of 0.95. Values in Figures 2, 3, 4, 5 are presented as the mean ± standard deviation.
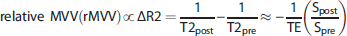
The comparisons of baseline vascular parameters (rCBVbase, rMVVbase, and VSIbase) between normal and stroke rat brain in cortex (
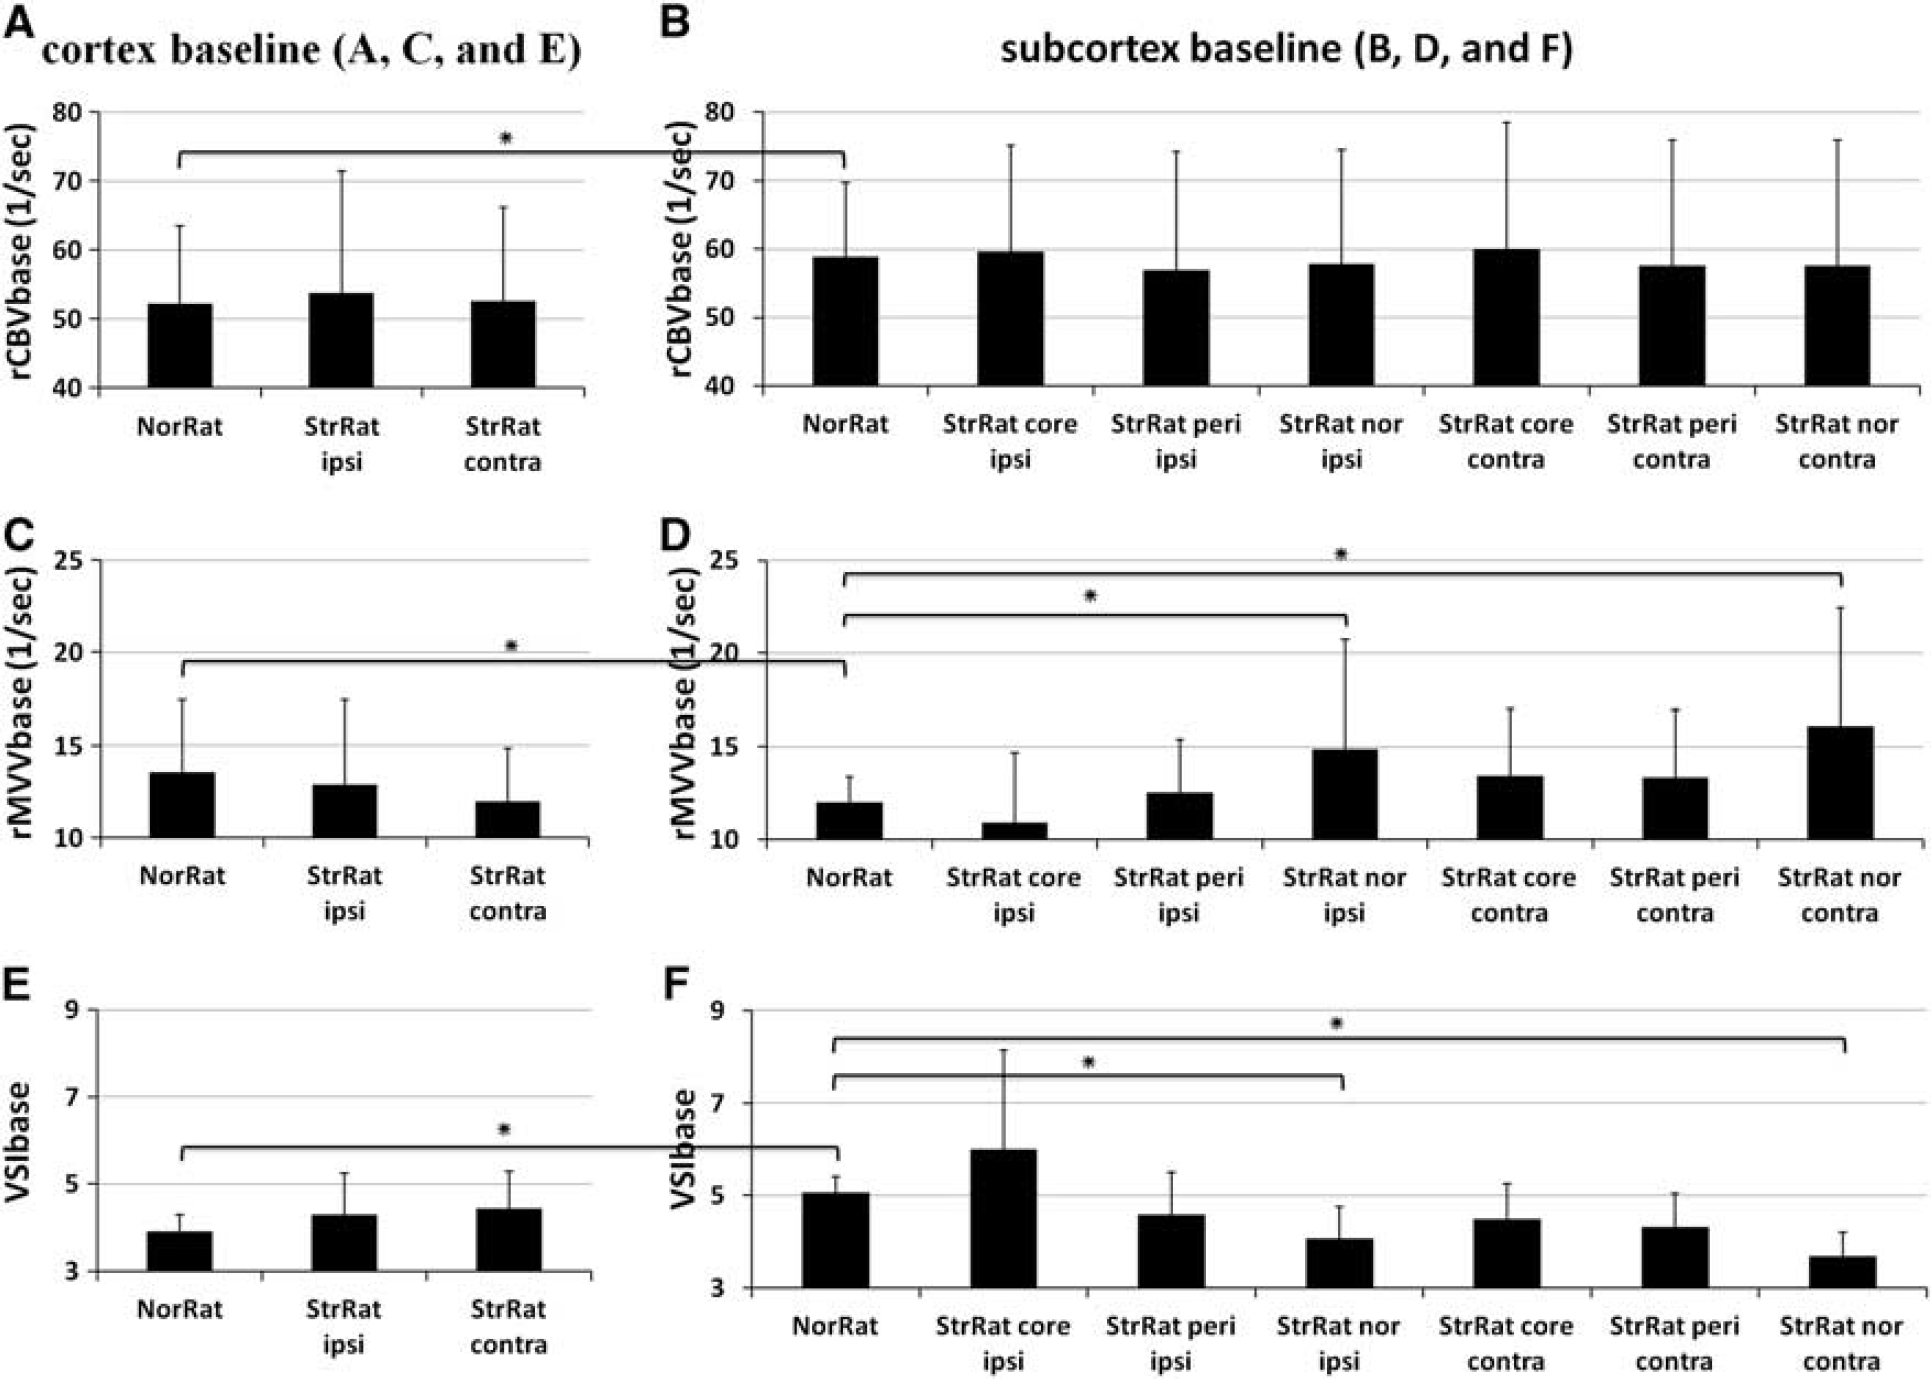
The relative % ADC (
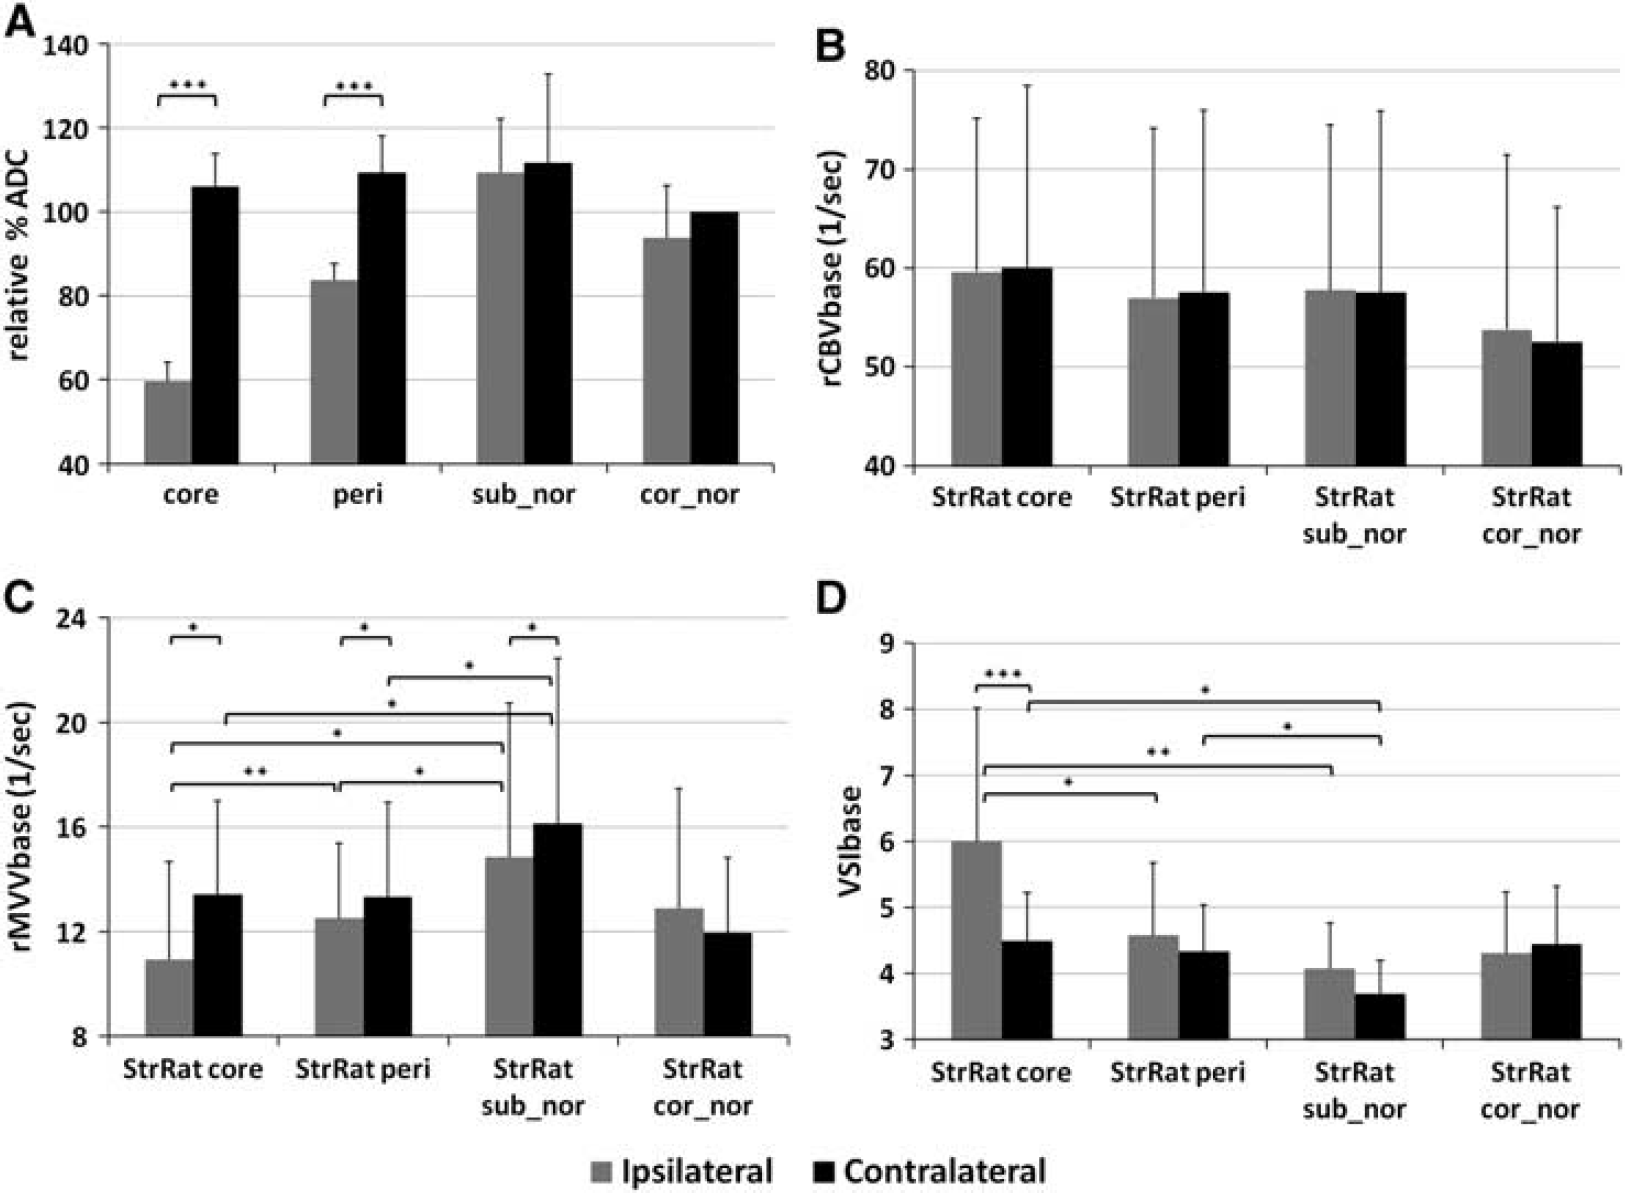
Mean percent increases during hypercapnia in normal (
The mean rCBV (
RESULTS
Physiologic Measurements
Before and after GESE data acquisition, mean arterial blood pressure results were within normal physiologic ranges, consistent with previously reported measurements. 23 During hypercapnia, the mean arterial blood pressure measured before the hypercapnic challenge decreased from 113.1±15.6 to 90.3±21.6 mm Hg (P < 0.05). However, blood gas results (pH, PaO2, PaCO2, etc) obtained before and after GESE image acquisition times showed no significant differences (data are not shown).
Interrelationship between Stroke Volume, Baseline Volumes, and Vasoreactivities
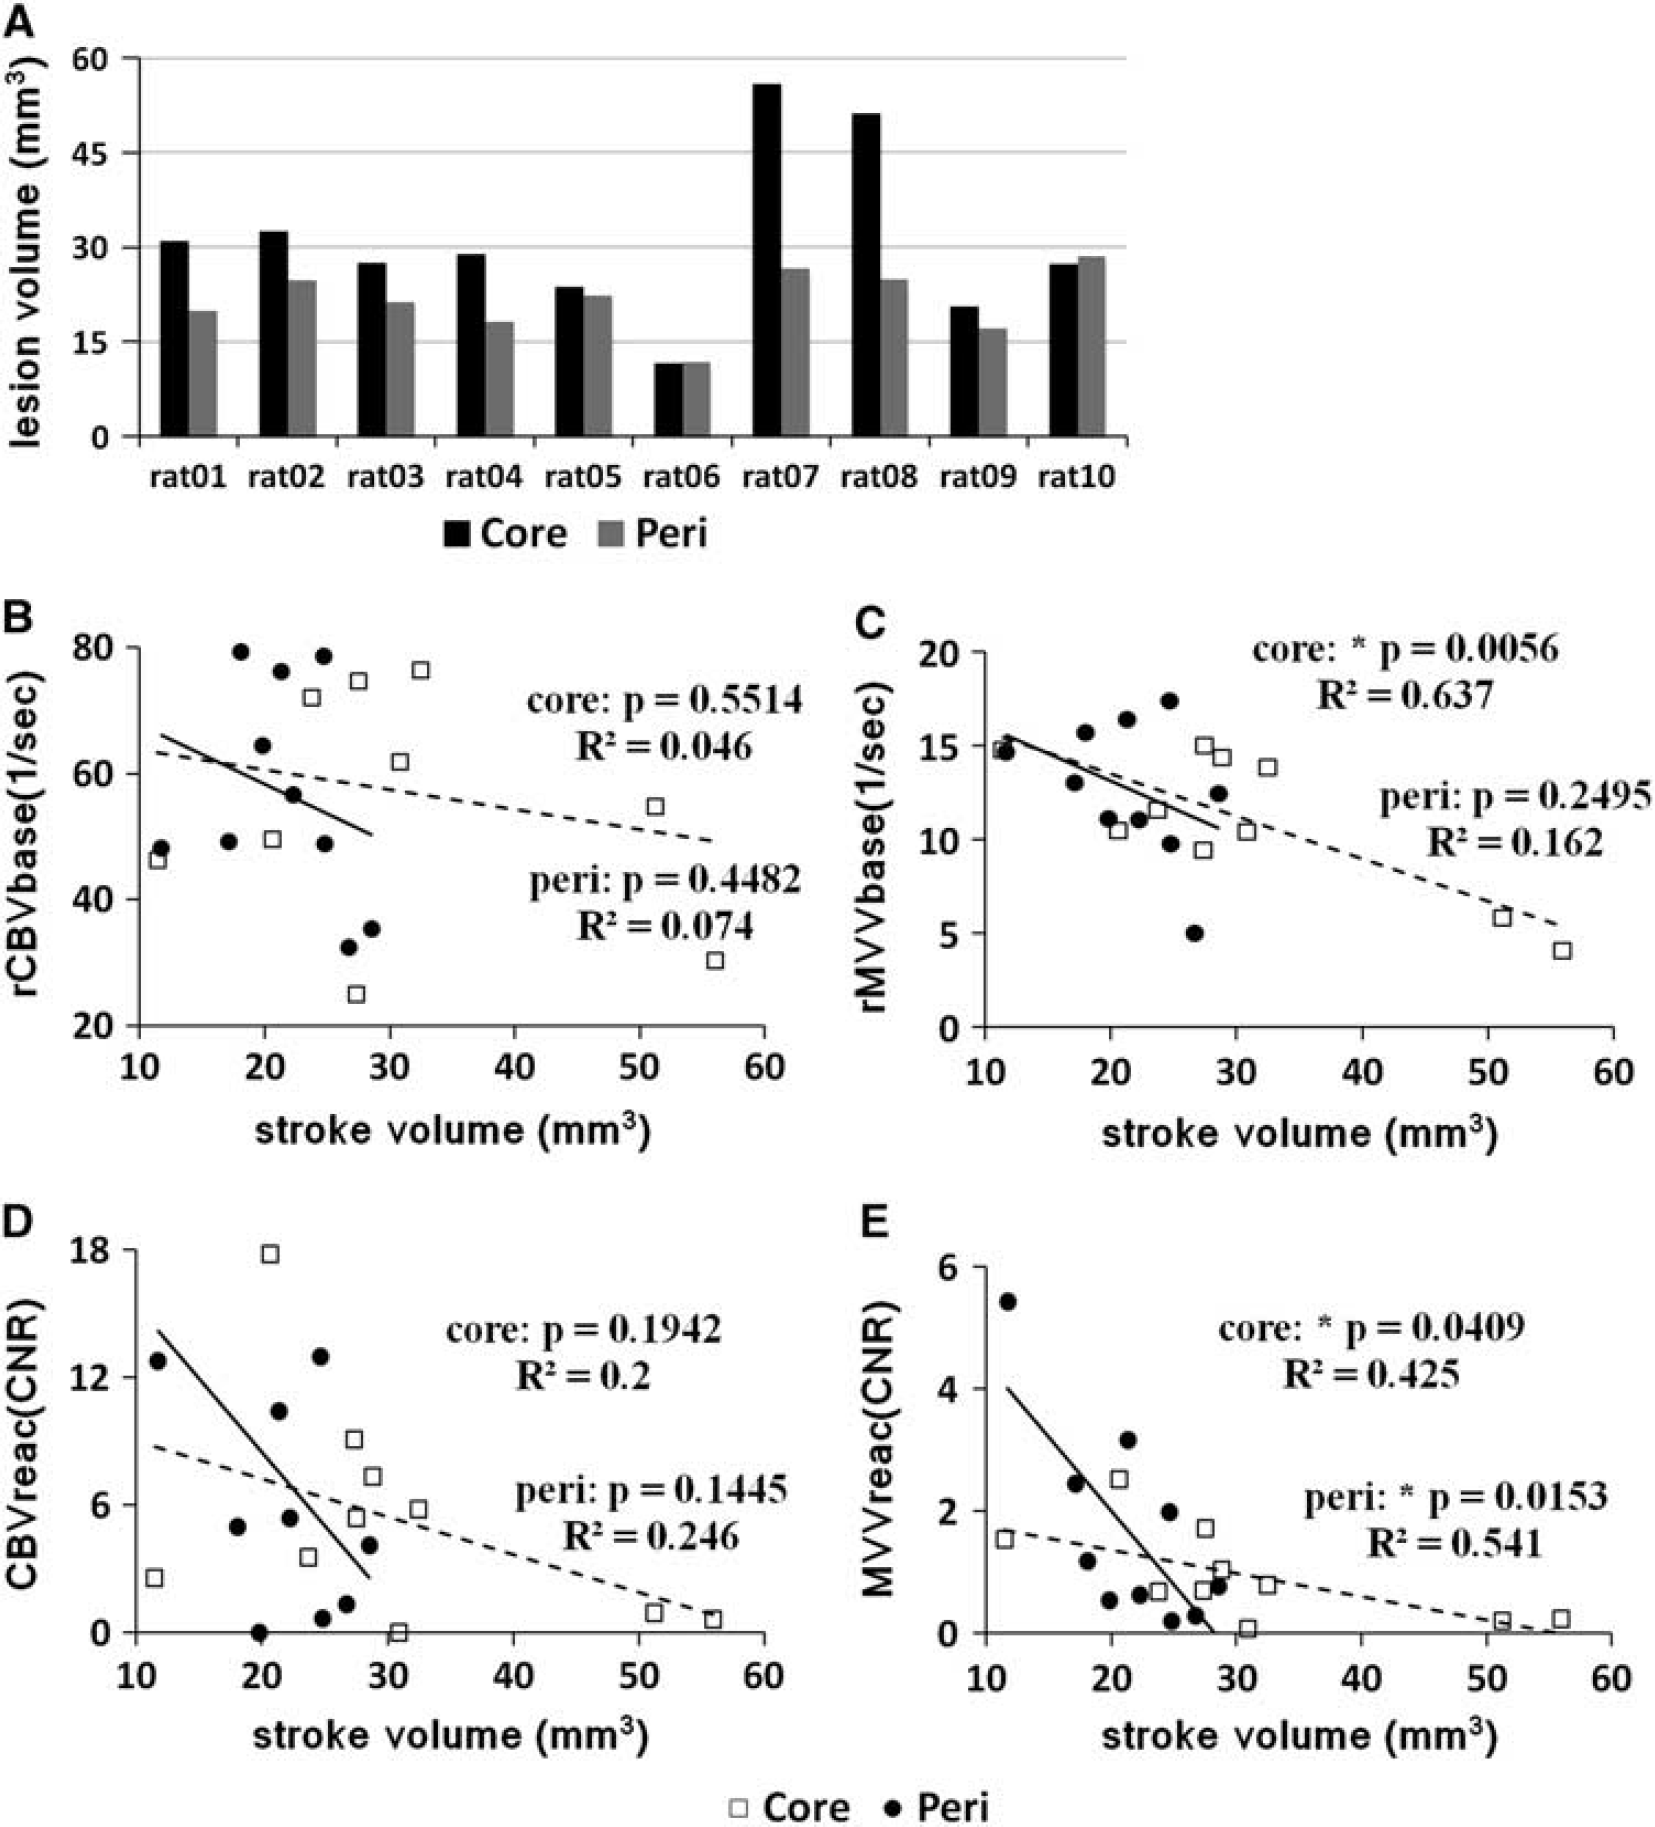
Relationships between the lesion (core, peri-infarct) volumes, baseline blood volumes (rCBVbase, rMVVbase), and vasoreactivities (CBVreac, MVVreac) are shown in Figure 1. Middle cerebral artery occlusion led to the apparent DWI signal intensity increase and ADC decrease in the affected cerebral tissue, majority of which were located in subcortex. The mean infarct core volume, defined as the brain tissue volume with ADC < 65% of the contralesional cortical ADC, was 30.98±13.35 mm3, while the mean peri-infarct volume, with the ADC between 65% and 85% of the contralesional cortical ADC, was 21.4±5.03 mm3 (Figure 1). No statistically significant relationships were found for either lesion volumes (i.e., core and peri-infarct) with rCBVbase and CBVreac or peri-infarct volume and rMVVbase. However, statistically significant negative correlations were established between stroke core volume and rMVVbase (P < 0.01, R 2 = 0.637; moderate correlation), core volume and MVVreac (P < 0.05, R 2 = 0.425; mild correlation), and peri-infarct volume and MVVreac (P < 0.05, R 2 = 0.541; moderate correlation) (Figures 1C and 1E).
The total lesion volumes (
Baseline Blood Volumes
Baseline characteristics of vascular parameters (rCBVbase, rMVVbase, and VSIbase) are displayed in Figures 2 and 3. First, the internal variation test within the control rat brains revealed similar rCBVbase, rMVVbase, and VSIbase values between left and right hemispheres, showing the absence of hemispheric bias. Upon comparing cortex with subcortex, significantly greater subcortical rCBVbase and VSIbase than those measured in the cortex were observed, whereas the subcortical rMVVbase was lower than the cortical value (Figure 2). In the stroke group, independent of hemispheric laterality, the baseline vascular parameters acquired from either ipsi or contralesional cortical areas pertaining to the normal ADC were not different compared with those measured in the normal healthy cortical tissue of control rat brains (Figures 2A, Figures 2C, and 2E). Similarly for subcortex, both the rCBVbase and rMVVbase values in the core and peri-infarct areas were not significantly different from those measured in the normal control rats (see Figures 2B, 2D and 2F). However, the rMVVbase values in the ipsilesional normal ADC subcortical areas and their contralesional counterpart areas were increased compared with those measured in either any other areas in the stroke rat brains or the normal rat brains (Figure 2D), which results in the decrease of mean VSIbase (Figure 2F).
In the stroke rat group, although the cortical rCBVbase values measured in both ipsi or contralesional hemisphere were slightly less than those measured from the subcortical other regions, the rCBVbase values were not statistically distinguishable and independent of ADC (Figures 3A and 3B). However, the significant differences of rMVVbase between ipsi and contralesional hemispheres were found in all subcortex areas (Figure 3C and Table 1). Of particular note, the ipsilesional rMVVbase was negatively correlated with the lesion severity defined as ADC decrease, in which the mean rMVVbase in core, peri-infarct, and normal ADC subcortical areas was 10.92±3.76, 12.51±2.87, and 14.85±5.88 1/s, respectively (Figures 3A and 3C). Similarly, the mean ipsilesional VSIbase, an indicator of vessel dilation, was significantly greater than that measured in the contralesional only in the core infarct area, in which the VSIbase was positively correlated with the lesion severity (Figures 3A and 3D).
The whole baseMVV values of the stroke rat brains in bilateral hemispheres
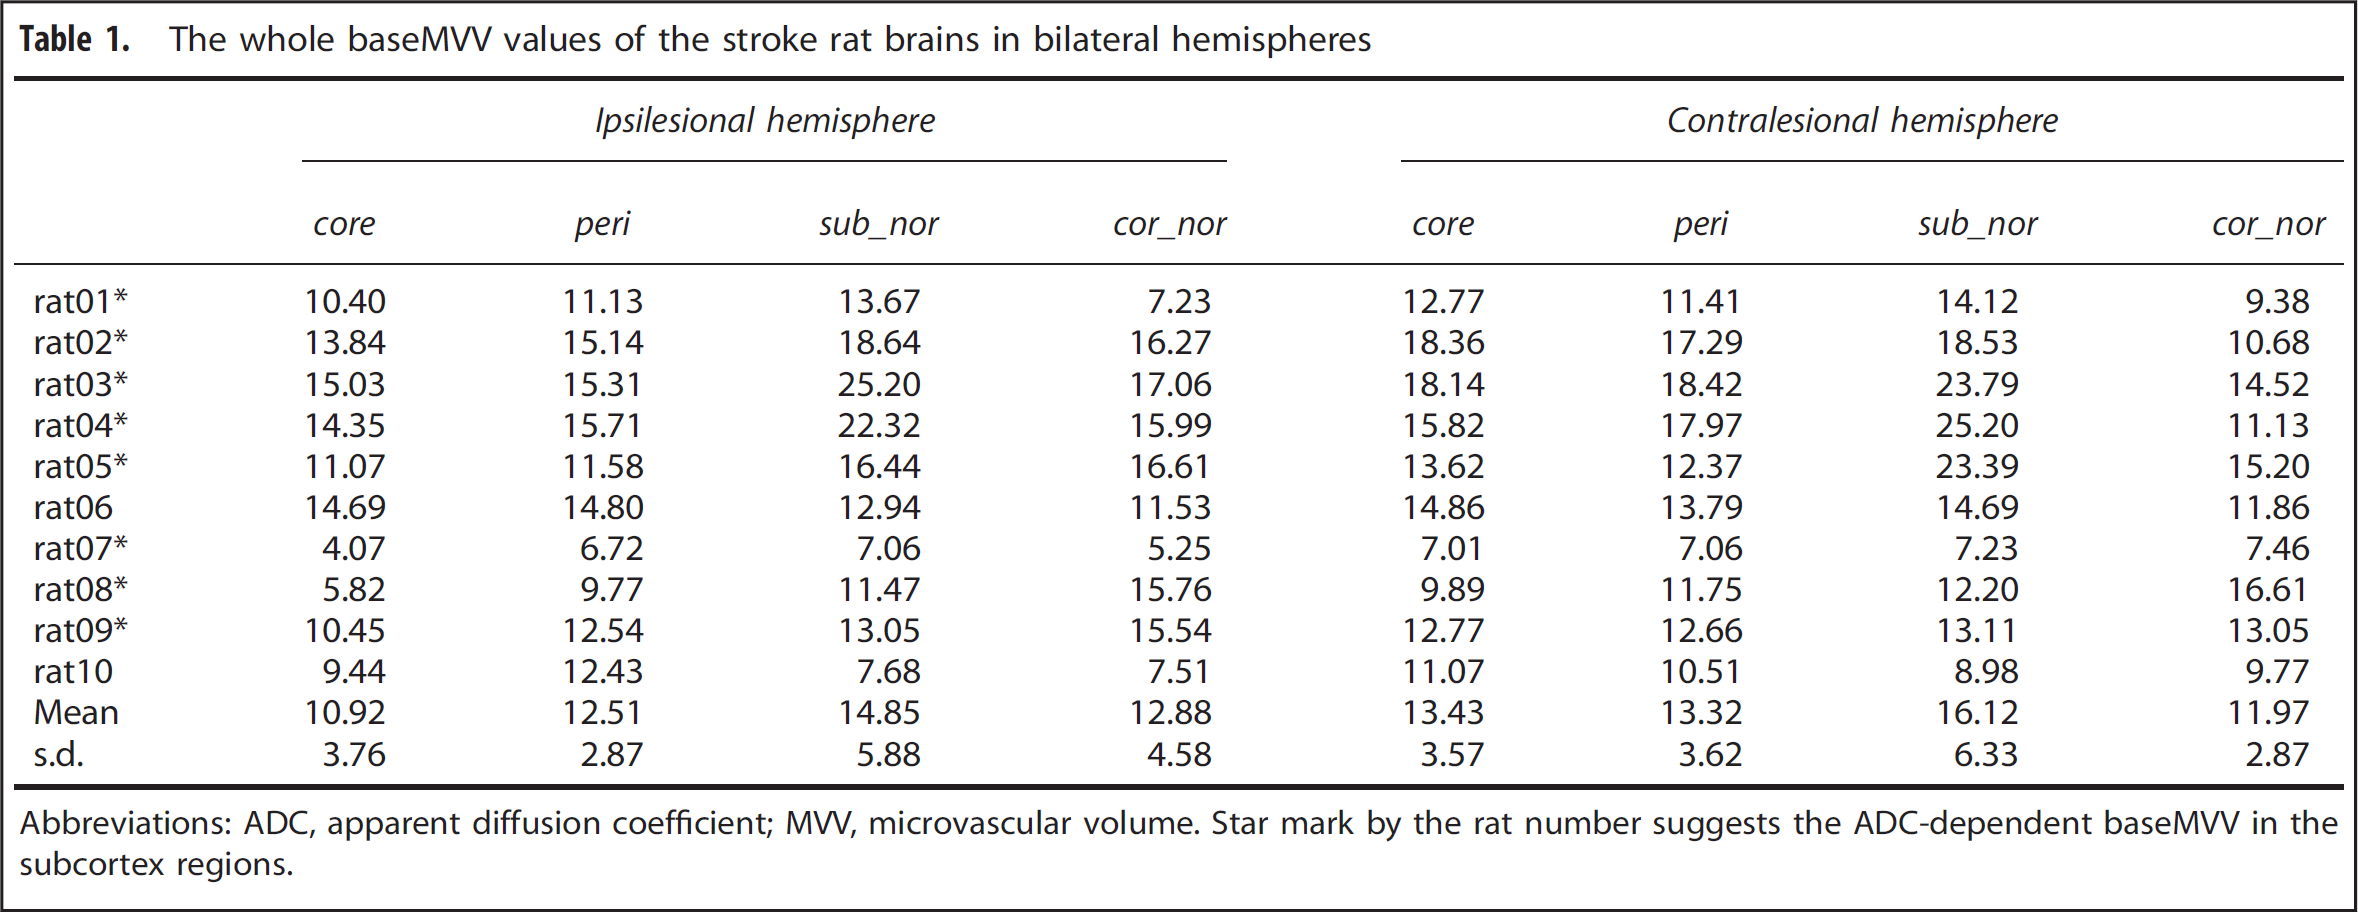
Abbreviations: ADC, apparent diffusion coefficient; MVV, microvascular volume.
Star mark by the rat number suggests the ADC-dependent baseMVV in the subcortex regions.
Vasoreactivities During Hypercapnia
Vasoreactivity in response to hypercapnia was quantified by calculating the time average (during the last 30 seconds before the CO2 is turned off) of percent changes in rCBV, rMVV, and VSI as shown in Figure 4. These vascular responses were not different between bilateral hemispheres in normal control rats (Figure 4A) while those measured in the ipsilesional tissue of stroke rats were hemispherically deficient in all areas including the normal ADC regions (Figure 4B). In fact, the reduced CBVreac and MVVreac within the ipsilesional hemisphere of the stroke rats were not significantly different among all four ipsilesional ROIs, indicating that the vasoreactivity was not dependent on either the ADC-defined stroke severity or the status of baseline blood volume. The VSIreac was not statistically different from that in normal rat brain, in which the VSIreac in all ROIs of the normal and stroke rat brains converged to zero due to the proportionally comparable CBVreac and MVVreac (Figure 4).
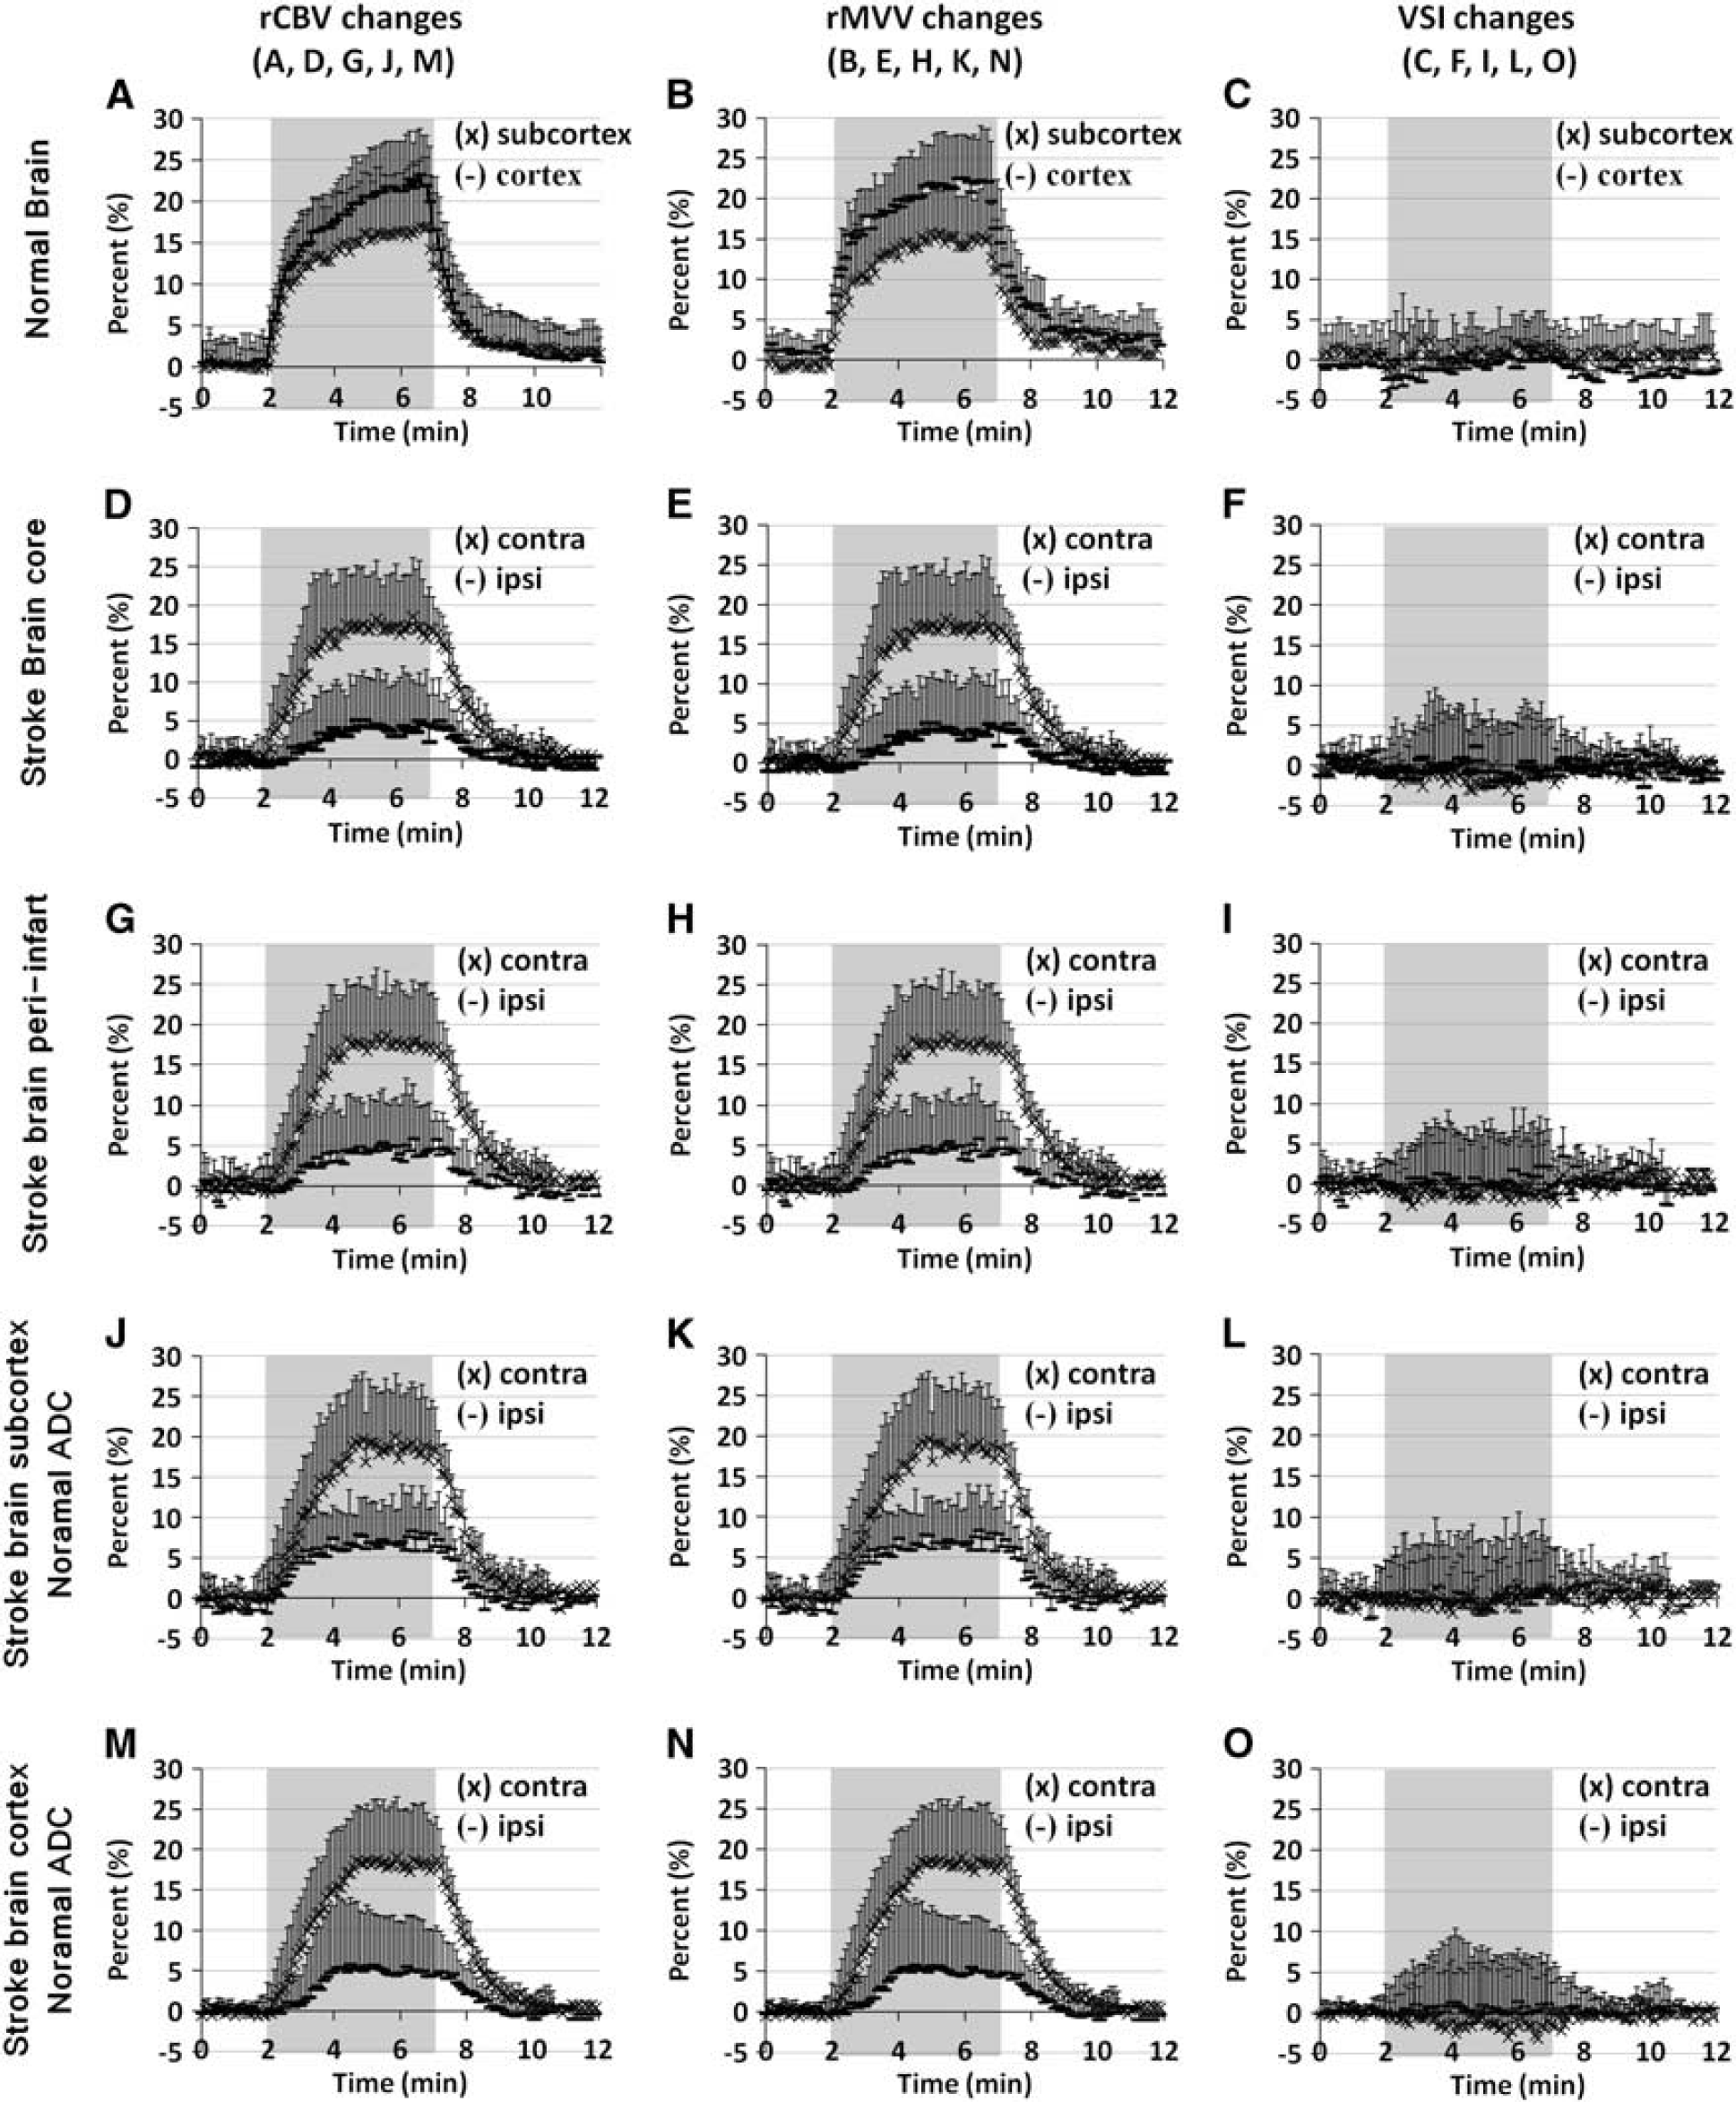
The time dependence of percent changes in rCBV, rMVV, and VSI during hypercapnia is displayed in Figure 5. In normal control rats, both rCBV and rMVV almost linearly increased for the first ~ 36 seconds. After such sharp initial increases, both rCBV and rMVV slowly increased reaching plateaus, in which the cortical blood volume increases were always greater than the subcortical increases (Figures 5A and 5B). In the stroke group, even in the contralesional hemisphere, the slope of initial increase was much less than the normal control whereas the time to reach the peak in each time course was much shorter. Despite these altered temporal traits, the rCBV and rMVV response amplitudes in the contralesional hemisphere were similar to those measured in the normal control rats. No notable changes in VSI were observed in either rat groups (Figures 5C, 5F, 5I, 5L, and 5O). However, in the infarct tissue (reduced ADC areas), compared with contralesional counterparts, the increases in both rCBV and rMVV were significantly attenuated without any appreciable difference, independent of lesion severity (Figures 5D, Figures 5E, 5G and 5H). Similarly for normal ADC regions in the ipsilesional hemisphere, both rCBV and rMVV response amplitudes were significantly lower than those acquired from the contralesional hemisphere for both cortical and subcortical areas (Figures 5J, Figures 5K, 5M and 5N).
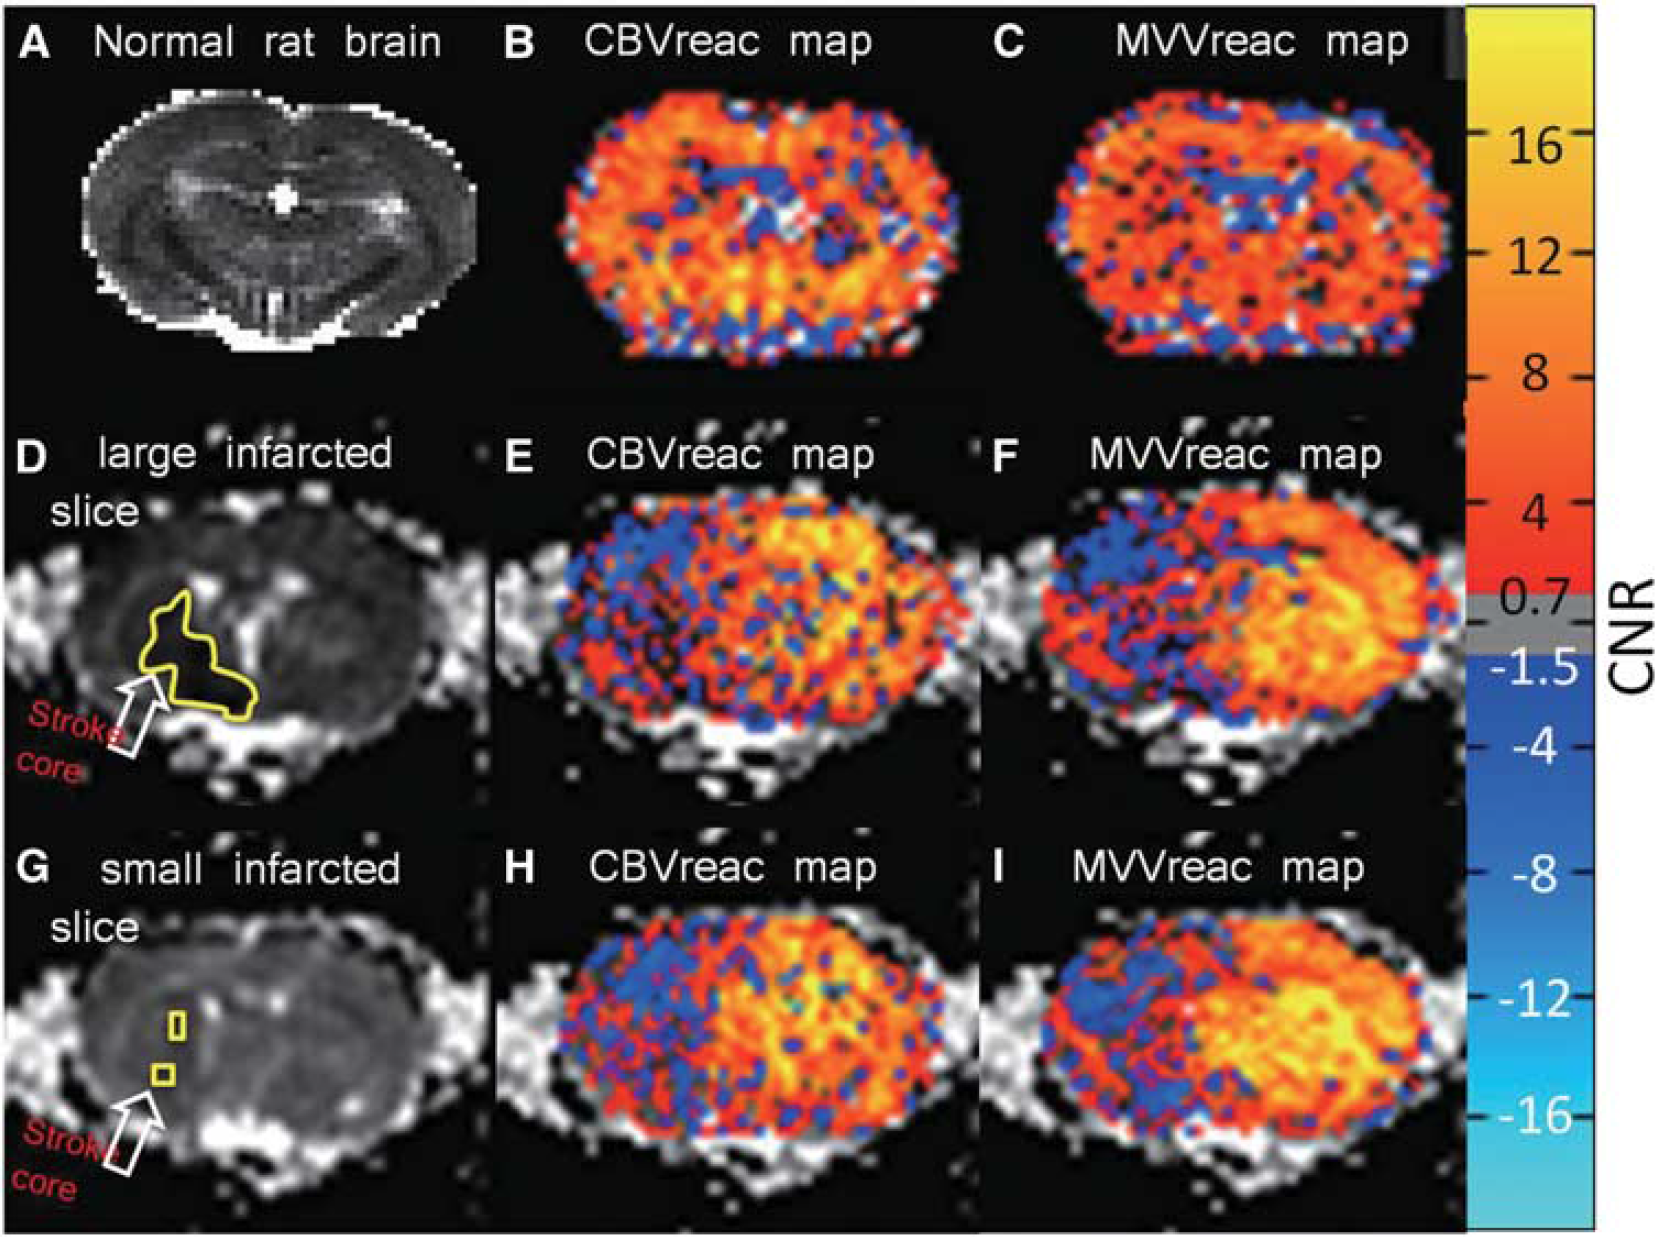
Functional analyses in normal rat brain revealed little difference in activation between bilateral hemispheres (Figures 6B and 6C). In the contralesional hemisphere of ischemic rats, strong cortical rCBV activation due to hypercapnic stimulation was accompanied by relatively smaller subcortical responses (caudate and thalamus: Figures 6E and 6H). The rMVV functional maps also revealed significant responses to hypercapnia; however, in contrast to the rCBV activation profile, cortical rMVV activation was relatively lower than the subcortical activation in the contralesional hemisphere (Figures 6F and 6I). Both rCBV and rMVV functional maps confirmed hemispherically deficient, extremely zero activation even for normal ADC areas in ipsilesional hemisphere (Figures 6D–6I). Such hemispheric lack of activation was not dependent on the infarct volume as the extensive lack of vasoreactivity was shown even in slices that contain very small infarct core volume. The representative maps with slice that contain large core volume (Figures 6D–6F) and smaller volume (Figures 6G-6I) were acquired from the same stroke rat images.
Apparent diffusion coefficient (ADC) map (
During the scan, sudden increases of rCBV and rMVV, presumably as results of the spreading depression (SD), were occasionally observed in the only ipsilesional hemispheres of the stroke rats (Figure 7). Single and local (n = 2), single and hemispheric (n = 1), and repeated and hemispheric (n = 1,3 times) increases lasted for 90 ~ 222 seconds. These unsolicited, sporadic increases in both rCBV and rMVV occurred with the similar proportions, resulting in the lack of VSI increases.
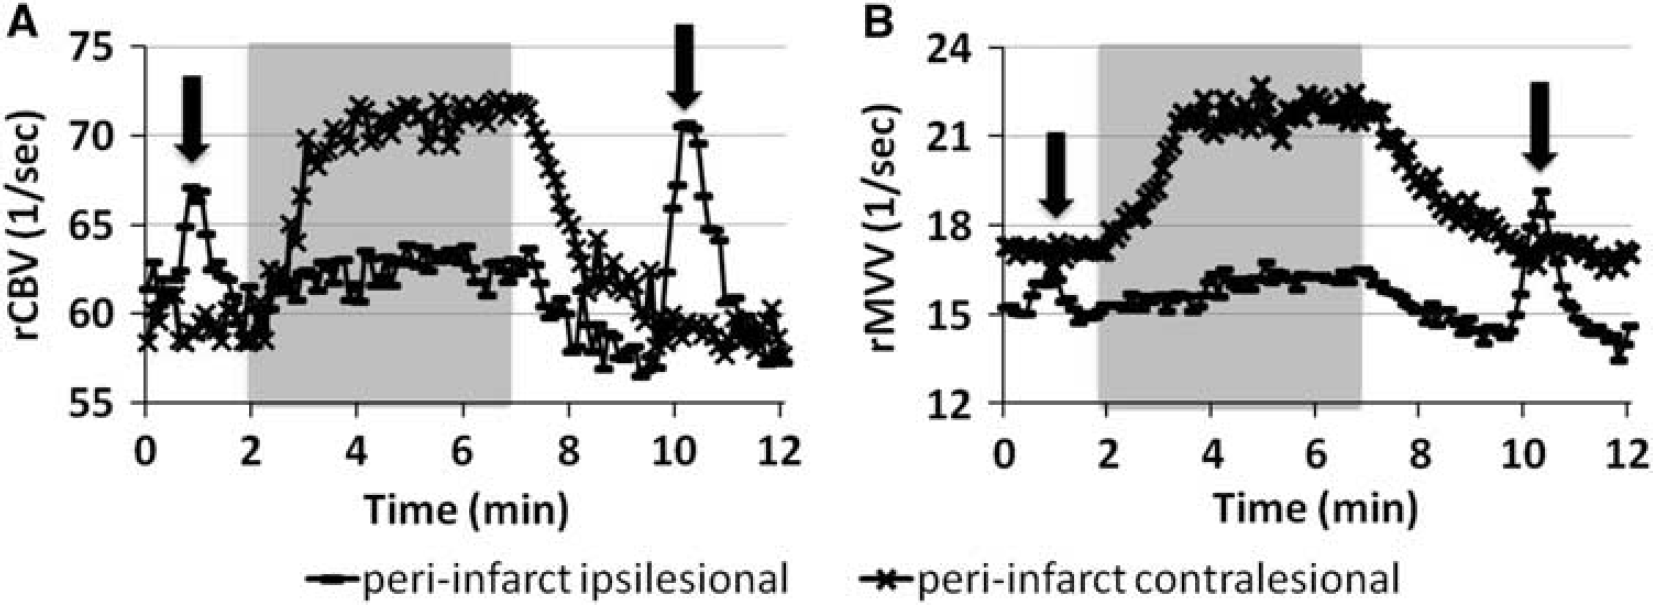
Representative spreading depression (SD)-like events (arrow) in rCBV (
DISCUSSION
Newly Developed Gradient- and Spin-Echo Technique Increasing R2 and R2* of blood using superparamagnetic colloidal nanoparticles, such as SPION can effectively decrease the MRI signals, creating negative contrasts that are weighted by the relative blood volume associated with either microvasculature only or entire blood vessels, respectively. Thus, by combining SE and GE measurements, the caliber-dependent characteristics of vasculature can be obtained with a relatively simple manipulation of MRI pulse sequence. 24 The advantage of such technical features has been exploited to construct parametric vascular maps for assessing accurate perfusion state in different regions of the organ, especially the microvascular circulation in relation to the total blood volume. Additionally, the present study expanded the application to evaluate dynamic traits of cerebrovascular changes simultaneously at different vascular levels using the alternating GESE EPI, specifically capturing the response to systemic hypercapnia after focal cerebral ischemia. Our previous study using normal healthy rats 23 quantified the dynamic rCBV and rMVV but used independent acquisitions of GE and SE signals with separate hypercapnic challenges. Compared with the current GESE method, previous measurements with the separate acquisitions of rCBV and rMVV required more time as much as the recovery time from the peak to the baseline (~ 5 minutes) and also the additional stabilizing time until the cerebrovascular fluctuation disappeared completely (approximately 25 to 30 minutes) after CO2 was turned off. Moreover, despite the consistent results, both physiologic and MRI system drifts between acquisitions could not have been ruled out entirely under such settings and might have limited the measurement precision. In this sense, the GESE EPI technique provides an important improvement for assessing dynamic characterization of the full vascular status (i.e, rCBV and rMVV and VSI) in conditions that are highly time-limited or physiologically unpredictable.
Baseline Blood Volume Changes in Stroke Tissue In conjunction with the apparent CBF decrease by arterial occlusion, several studies reported significant CBV decrease in the ischemic core and peri-infarct areas at acute stroke phase (3 to 6 hours after stroke onset).32,33 Unlike these results, the rCBVbase between the bilateral hemispheres and among variable lesion areas (Figure 3B) was undifferentiated in the current study, which suggests uncoupling of lesion severity and perfusion change in the ischemic rat brain. Such conflicting results may have arisen from differences in experimental methods. The current study utilized a strictly steady-state technique, whereas the rCBVbase measured in other previous studies was mostly derived from the CBF measurements using tracer kinetic method, in which the rCBVbase in low perfusion areas can be easily underestimated unless the local arterial input function is properly defined.32–34 Upon classifying small sized vessel traits, despite the unaffected cortical rMVVbase, a significant increase of the mean subcortical ipsilesional rMVVbase was observed only in the normal ADC area, compared with normal healthy rats (Figure 2D). This finding particularly implies the autoregulatory cooption of capillaries (i.e., increased density of perfused vessels). Such increases in rMVVbase were also observed in the contralesional subcortex, which suggests an important autoregulatory response to maximize the global perfusion at the subcortical capillary level and perhaps reciprocally shows the deficient control of capillary bed in ipsilesional core and peri-infarct areas. When ipsilesional ROI's were compared with the homologous contralesional areas, all the ipsilesional subcortical rMVVbase values were significantly smaller than contralesional rMVVbase values (Figure 3C), most likely due to the inadequate perfusion pressure and subsequent deprival of capillary blood in the infarct area.
The reduced rMVVbase in core and peri-infarct areas compared with the homologous and normal ADC subcortical regions, combined with the surprisingly unaffected CBV, resulted in the significantly increased mean VSIbase (Figures 3B–3D). And the reduced rMVVbase was in significant correlation with the formation of cytotoxic edema (i.e., ADC decrease) irrespective of the rCBVbase status. Accordingly, we wish to point out that the microvasculature perfusion may have a critical role to control the cellular damage and provide a predictive marker for assessing the stroke severity. In particular, the direct inverse relationship between the severity of ischemia (measured by stroke core volume) and rMVVbase (Figure 1C) further supports the relationship between ischemia-induced damage and functional changes of capillary perfusion. Therefore, these ischemia-associated baseline vascular traits circumstantially point toward a few possible scenarios: (1) the augmentation of subcortical rMVVbase in normal ADC tissue via cooption of microvessels, which give rise to the decrease in VSIbase (Figures 2D and 2F), (2) the relative decrease of the infarct core rMVVbase (i.e., occlusion of microvessels), in which lack of capillary perfusion in the infarct tissue is compensated by the dilation of larger vessels, thus maintaining the rCBVbase (see Figures 3B–3D), and (3) the microvessel dilation leading to the concomitant decrease of the measured infarct core rMVVbase (Figures 3C and 3D). Although hypothetically diverse, the phenotypic imbalance between rCBVbase and rMVVbase in the reduced ADC areas likely occurred as a result of autoregulation disturbance. The strong dependence of the ADC-defined stroke severity as well as the overall stroke core volume makes the attenuated rMVVbase in the ipsilesional hemisphere a key vascular factor contributing to the acute stroke outcome (Figure 1 and Table 1).
Hemispherically Decreased Vasoreactivities in Ipsilesional Hemisphere
In the current study, increased rCBV and rMVV in all regions of healthy control rat brain during CO2 exposure without any significant changes in VSI is in good agreement with our previous study results. 23 This observation suggests the proportional increases of both capillary and large vessel blood volumes with even volume increases of either vascular population (Figure 4A). Similarly, CO2 inhalation resulted in significantly elevated rCBV and rMVV in the contralesional hemisphere of stroke rat brain; however, these responses were much less in the ipsilesional hemispheres. The mean percent rCBV increase values in the entire ipsilesional and homologous contralesional hemisphere were 5.03±1.41% and 17.44±0.78% while the percent rMVV increase values were 5.04±1.2% and 19.14±1.03%, respectively (Figure 4B). Even for the ischemic brain, the magnitudes of rCBV and rMVV responses were proportional, thus no noticeable VSI increases were found. This lack of VSI increase obtained in the current MRI study seemingly conflicts with the previous results by Duelli et al, 35 in which the increased capillary diameter during hypercapnia was accompanied by the increases in both the CBF and the density of perfused capillaries. In fact, the cooption and dilation of microvessels attributed to the increases in both ΔR2 and ΔR2* due to the increase in number of perfused micvovessels and the actual increases in size of microvessels' caliber, respectively. Therefore, despite the possible difference in origin, these simultaneous increases might have led to the current observation, in which similar percent increases in ΔR2 and ΔR2* (MVVreac and CBVreac) resulted in the nearly unresponsive VSIreac to the hypercapnic challenge. Interestingly, the vessel population imbalance found in the baseline vascular measurements did not affect the proportionality of percent response magnitudes, which also led to the lack of VSIreac change (Figure 4B).
In regards to the comprehensive impairment of cerebrovascular reactivity in whole ipsilesional hemisphere, the phenomenon of diaschisis is a likely cause for these remote effects. The stroke-associated diaschisis is defined as the autoregulatory dysfunction 5 or alteration in regional blood flow and metabolism 36 in brain areas remote from the ischemic lesion. Similarly, remote impairments in cerebrovascular CO2 reactivity have also been found in human 37 and animal.3,8,9 For example, the hypercapnic vasoreactivity was found abolished in the ischemic center, depressed in the peri-infarct and affected even in the normal remote areas (e.g., territory supplied by anterior cerebral artery of the ipsilesional hemisphere or white matter of the contralesional hemisphere) in rat 8 and baboon 9 MCAO models. Histologic examination performed by Symon et al 3 strengthened the theory of diaschisis by demonstrating that the normal healthy tissue territories also exhibited the reduced CO2 reactivity. Several human studies also showed the hemispherically reduced CO2 reactivity in cortical infarct patients and the diffused attenuation in bilateral hemispheres of patients with subcortical (lacuar) infarction. 37 These results indicate that the decreased CO2 vasoreactivity occurs along with or originates from the extensive vasoparalysis after focal cerebral ischemia and also that this disturbance is unrelated to ischemic territory defined by ADC.
As shown in Figure 7, sudden increases of CBV and MVV confined in the ipsilesional hemisphere were frequently observed during MRI scan, which is probably linked to SD. Spreading depression is characterized by waves of depolarizing neurons accompanied by dramatic changes in neural metabolism and cerebral blood flow in the affected region, and ischemic stroke is known to trigger the propagation of SD along the pei-infarct and often into the nonischemic tissue. 38 In the current study, the hypercapnic vasoreactivity is impaired independent of cellular damage and/or baseline vascular values, as previous studies showed significantly reduced CO2 reactivity after SD.39,40 Although hypercapnic vasodilation is presumably induced without eliciting strong neuronal or metabolic changes,1,2 we posit that the hemispheric absence of vasoreactivity is connected to the stroke-associated SD and subsequent neural damage. Especially, the remotely impaired vasoreactivity produced after cerebral ischemia is likely to result from the neural damage in relation with SD rather than intrinsic changes in the neural circuitry or blood vessels in the remote region.
As such, dynamic monitoring of hypercapnic response provides an effective means to capture stroke-affected neurovascular disturbances. Although robust, a technical requirement such as the maintenance of intravascular contrast agent concentration in this approach is noteworthy. In the current study, the relatively short acquisition time (~20 minutes) minimized the influence from the systemic clearance of SPION concentration (measured by ΔR2). A long half-life of SPION, in which no detectable change in the baseline ΔR2 was observed for 3 hours also aided the measurement accuracy without further signal modification.
Our study extensively characterized the cerebrovascular alteration (e.g., baseline blood volumes) and hypercapnia-induced hemodynamic changes in different vascular populations at an acute stage of focal ischemia. While the rCBVbase was unaffected, the rMVVbase in the ipsilesional areas significantly correlated with the regional ADC decrease. In particular, the mismatch between the baseline vascular parameters and hemispheric impairment of cerebrovascular reactivity in nonischemic regions suggests neural diaschisis, which was partially and/or indirectly induced by apparent SD. Therefore, the region-dependent inhomogeneity in rMVVbase may indicate the true differentiation of effective perfusion reserve and may used for delineating the stroke damage and prognosis, whereas the impaired CO2-dependent cerebral supply perhaps reveals changes in overall neurovascular physiology caused by the neuroelectric insult. The current study shows that the impaired CO2 reactivity and altered baseline MVV in concert provide a MRI-based acute stroke assessment strategy and markers of generalized stroke-associated neural and vascular damage.
DISCLOSURE/CONFLICT OF INTEREST
The authors declare no conflict of interest.