
Abstract
Detecting treatment efficacy using cognitive change in trials of cerebral small vessel disease (SVD) has been challenging, making the use of surrogate markers such as magnetic resonance imaging (MRI) attractive. We determined the sensitivity of MRI to change in SVD and used this information to calculate sample size estimates for a clinical trial. Data from the prospective SCANS (St George’s Cognition and Neuroimaging in Stroke) study of patients with symptomatic lacunar stroke and confluent leukoaraiosis was used (n = 121). Ninety-nine subjects returned at one or more time points. Multimodal MRI and neuropsychologic testing was performed annually over 3 years. We evaluated the change in brain volume, T2 white matter hyperintensity (WMH) volume, lacunes, and white matter damage on diffusion tensor imaging (DTI). Over 3 years, change was detectable in all MRI markers but not in cognitive measures. WMH volume and DTI parameters were most sensitive to change and therefore had the smallest sample size estimates. MRI markers, particularly WMH volume and DTI parameters, are more sensitive to SVD progression over short time periods than cognition. These markers could significantly reduce the size of trials to screen treatments for efficacy in SVD, although further validation from longitudinal and intervention studies is required.
Keywords
Introduction
Cerebral small vessel disease (SVD) is a term used to describe a group of pathologic processes that affect the perforating cerebral arterioles and capillaries resulting in brain injury to the subcortical grey and white matter. 1 A number of brain parenchymal pathologies can occur, including small deep infarcts, microbleeds, areas of diffuse gliosis, ischemic demyelination and axonal loss corresponding to regions of radiologic leukoaraiosis, and diffuse brain atrophy. 2 Clinically SVD presents with lacunar strokes, which represent approximately 20% of all ischemic strokes, and it is also the major cause of vascular cognitive impairment. In addition, it appears to interact with Alzheimer’s disease, exacerbating the degree of clinical impairment. 3 Thus SVD is an enormous health burden that leads to significant neurologic and cognitive decline. Despite its importance, there are few validated treatments for SVD. Reasons for this include a lack of understating of the pathogenesis and the challenges of performing large clinical trials in the condition including the insensitivity of cognitive scores to change. 4 The use of surrogate markers in which novel treatments can be evaluated for potential efficacy before large clinical end point trails is attractive and magnetic resonance imaging (MRI) has been suggested as such a surrogate.
MRI is essential to diagnosis of SVD. Common features seen on conventional MRI include lacunes, T2 white matter hyperintensities (WMHs), cerebral microbleeds (CMBs), perivascular spaces, and brain atrophy. 2 More advanced techniques using diffusion tensor imaging (DTI) has been shown to be sensitive to tissue damage showing abnormalities in apparently normal appearing white matter.5,6 These abnormalities on MRI may be potentially useful surrogate disease markers that can used to assess therapeutic approaches. If these MRI parameters are to be used as reliable surrogate markers in clinical trials, they must fulfill the following criteria: (1) they must be able to predict clinical outcome, as changes induced by a therapy on a surrogate marker are expected to reflect changes in a clinically meaningful end point; (2) change in a surrogate marker must be detectable prospectively; and (3) the sample size required to show therapeutic efficacy should be feasible in the setting of a clinical trial. 7 The sample size is dependent on a number of factors, including the magnitude of the change in the marker detectable prospectively and the variability of measurements.
Longitudinal studies investigating MRI markers of SVD and their relationship to clinical measures.

Abbreviations: CADASIL, Cerebral Autosomal Dominant Arteriopathy with Subcortical Infarcts and Leucoencephalopathy; IQ, intelligent quotient; LADIS, Leukokraurosis and Disability; MD, mean diffusivity; MMSE, Mini Mental State Examination; MRI, magnetic resonance imaging; SIENA, Structural Image Evaluation using Normalisation of Atrophy; SVD, small vessel disease; VADAS, Vascular Dementia Assessment Scale; WMH, white matter hyperintensity.
Abnormalities on brain imaging often exist long before symptoms occur and may have a faster rate of progression than cognitive outcome measures. Using them as surrogate markers could significantly reduce the size, duration, and cost of clinical trials in SVD. In this study, we use multimodal serial brain (MRI) to prospectively evaluate the rate of change of some of these proposed MRI markers in established SVD; in particular brain atrophy, T2 WMH, lacunes and DTI parameters. We then used this data to determine the sample sizes required to demonstrate a reduction in the rate of progression of these MR abnormalities in a hypothetical clinical trial and compared these estimates with estimates if cognitive measures were used.
Materials and Methods
Patients
Patients with SVD were recruited as part of the prospective St George’s Cognition and Neuroimaging in Stroke (SCANS) study. 8 Recruitment was from acute stroke units or outpatient stroke clinics in three hospitals covering a contiguous catchment area in South London (St George’s, King’s College, and St Thomas’ Hospitals). Inclusion criteria comprised a clinical lacunar stroke syndrome 16 with an anatomically corresponding lacunar infarct on MRI in addition to confluent WMH on MRI (Fazekas grade ⩾2). 17 Exclusion criteria were: any cause of stroke mechanism other than SVD (e.g., cardioembolic source or extra- or intra-cerebral artery stenosis of >50%), other major central nervous system disorders, major psychiatric disorders, any other cause of white matter disease, contraindications to MRI, or non-fluent in English. The study was approved by Wandsworth research ethics committee, and all patients gave written informed consent. MRI acquisitions and cognitive assessments were performed at least 3 months after the last stroke to exclude acute effects on cognition. All patients were also screened for cardiovascular risk factors, including hypertension (defined as systolic blood pressure >140 mmHg or diastolic >90 mmHg or treatment with antihypertensive drugs), hypercholesterolemia (defined as a serum total cholesterol >5.2 mmol/l or treatment with a statin), diabetes mellitus, and smoking.
Subjects were invited back annually for cognitive testing and MRI scanning. In this analysis, follow-up data up to the third follow-up was used, providing a maximum of four data points per individual.
MRI Acquisition
Images were acquired on a 1.5 T Signa HDxt scanner (General Electric, Milwaukee, WI, USA) with maximum gradient amplitude of 33 mT/m and a proprietary head coil. All image sequences were acquired across the whole brain and total imaging time was approximately 45 minutes. Patients were placed in the head coil in a neutral position with an alignment marker at the nasal bridge to standardize head position. Minimal movement was ensured by use of foam pads and a velcro strap across the forehead.
The imaging protocol included: (1) Fluid Attenuated Inversion Recovery (FLAIR) sequence—TR/TE/TI = 9,000/130/2,200 ms, field-of-view (FOV) = 240 × 240 mm2, matrix = 256 × 192, 28 axial slices of 5-mm thickness. (2) Spoiled gradient echo recalled T1-weighted (SPGR) 3D coronal sequence—TR/TE = 11.5/5 ms, FOV = 240 × 240 mm2, matrix = 256 × 192, flip angle = 18o, 176 coronal slices of 1.1-mm thickness reconstructed to an in plane resolution of 1.1 mm. (3) DTI—Axial single shot spin echo planar images (EPI; TE = 93.4 ms, TR = 15,600 ms) were acquired to achieve whole brain coverage (2.5 mm3 isotropic voxels; FOV = 240 × 240 mm2, acquisition matrix = 96 × 96), following four acquisitions without diffusion weighting (b = 0 s/mm), diffusion-sensitized images were acquired with gradients applied (b = 1000 s/mm) in 25 non-collinear directions. This was repeated to acquire a further four b = 0 s/mm images and the negative of the 25 directions. Diffusion-weighted images were realigned to remove eddy current distortions using the FSL Linear Image Registration Tool (FLIRT, FMRI Software Library, FSL version 4.1; FMRIB Analysis Group, Oxford, UK, http://www.fmrib.ox.ac.uk/fsl). The geometric average of the positive and negative acquisitions was taken to eliminate gradient cross-terms. The eight b = 0 s/mm images were co-registered and averaged to give a T2-weighted echo planar image (henceforth termed b0).
Estimation of Longitudinal Brain Volume Change
Brain volume at baseline was calculated using a fully automated program, SIENAX (Cross-sectional Structural Image Evaluation using Normalisation of Atrophy; www.fmrib.ox.ac.uk/fsl) on T1-weighted images. This program computes brain volume relative to normalized skull size. Longitudinal changes in global brain volume were estimated from the T1-weighted images for each subject using an automated image analysis tool SIENA (Structural Image Evaluation using Normalisation of Atrophy; www.fmrib.ox.ac.uk/fsl). 18 This tool was used as SVD is a diffuse neurodegenerative disease and SIENA provides a sensitive measure of global volume loss. SIENA brain volume change has also been shown to be a feasible outcome measure in clinical trials in multiple sclerosis 19 and Alzheimer's disease. 20 SIENA estimates the percentage of brain volume change (PBVC) between two input images and was applied here to provide a global estimate of PBVC between each time point. Brain volume at each time point was then calculated using the baseline brain volume and the PBVC between each time point.
Diffusion MRI Analysis
Diffusion tensor elements were fitted at each voxel using DTIfit in FSL www.fmrib.ox.ac.uk/fsl, and mean diffusivity (MD) and fractional anisotropy (FA) maps were calculated.
Diffusion parameter histograms were then obtained in white matter using the following method. T1-weighted images were segmented using New Segment in SPM12 into isotropic (1 mm3 voxel resolution) grey matter (GM), white matter (WM), and cerebrospinal fluid (CSF) tissue classes. These segmentations were used to estimate deformations to a group-average template generated from the data cohort using the Shoot toolbox in SPM12. 21 The T1-weighted and FLAIR images were skull-stripped using the segmentations at a threshold of 0.1 and warped to the common group-average template. These were used to create population-specific Tissue Probability Maps (TPMs) using a modified multivariate mixture of Gaussians. 22 This technique increases segmentation accuracy across the cohort and provides TPMs for WMH from the FLAIR and T1-weighted images, allowing automatic segmentation at an individual level. These TPMs were used to replace the default SPM TPMs, and New Segment was re-run on the native space images to generate improved segmentations for GM, WM, and CSF, while also providing a WMH tissue class. The WMH segmentation maps were binarized at an individual set threshold by checking each of the results manually to ensure accurate correspondence. The binarization threshold was performed without referring to previous time points. Results were manually refined where necessary to optimize accuracy, with good intra- and inter-rater reliability (Pearson’s intraclass correlation coefficient 0.98 and 0.99, respectively, defined on a randomly selected group of 20 scans between two raters (CL and EZ)). An additional step was performed to repair the segmentations for regions of tissue damage. This was motivated by the observation that regions affected by pathology are frequently misclassified during routine segmentation. For example, regions of gliosis are misclassified as CSF and regions of WMH as GM leading to erroneous deformation estimations and subsequent inaccuracies in estimating warps to the group-average space. For this reason, WMH regions were automatically reclassified as WM and any erroneously classified tissue was removed from the GM and CSF segmentation maps. 14
Affine transformations, followed by non-linear transformations (using the FMRIBs Non-linear Image Registration Tool (FNIRT)) were computed by registration of the T1-weighted images to the b0 image of each subject and applied to the above segmentation maps to obtain masks of brain tissue in b0 space. Voxels were included in the masks if the probability of being GM or WM or WMH was >0.5. CSF voxels were removed using thresholds based on the diffusion properties of CSF (MD values of >0.0026 mm2/s were considered to contain CSF and excluded from the analysis). The diffusion characteristics of the WM tissue class were evaluated for the purposes of this study.
MD and FA histograms in voxels representing WM were calculated. For each subject, a histogram for MD and FA was computed (bin widths: MD 0.000004 mm2/s, FA 0.01; upper limit: MD 0.004 mm2/s, FA 1.0) for each DTI voxel identified by the WM mask image. To correct for differences in brain volume, each histogram was normalized by the total number of voxels present with the WM mask. For each MD histogram, the normalized frequency of pixels at the peak height (MD NPH) was obtained and used for further analysis as these were deemed to be the most stable measurements. These parameters have been cross-sectionally shown to have associations with cognition in a SVD population.8
Estimation of Longitudinal WMH Volume Change
WMH masks were created using the above technique from the FLAIR images. The volumes at each time point were calculated in individual subject space by summing the binarized corrected segmentations. Three measurements were calculated, total brain volume (Grey Matter (GM)+White Matter (WM)), WMH volume, and WMH volume as a percentage of total brain volume (WMH/total brain volume × 100). The latter value was used for further analysis as brain volume changes with time and a reduced WM volume, for example, may underestimate growth of the WMHs. In a further step, we performed a scan–rescan test on two patients to determine the effect of changing head position on WMH volumes and found these to be identical using the automated technique.
Identification of Lacunes
Lacunes were manually identified in native subject space at each time point by a consultant neuroradiologist, using T1-weighted, T2-weighted, and FLAIR images. A lacune was defined as a CSF filled cavity, 3 to 15 mm in diameter with a surrounding rim of FLAIR hyperintensity. 16 Cavity size thresholds were chosen as lesions that are <3 mm in diameter are more likely to be perivascular spaces than lacunes and cavities >15 mm are less likely to reflect an underlying SVD etiology. 16 For the longitudinal analysis, the images were first registered to a group average template. Our neuroradiologist used these registered images to identify new lacunes.
Neuropsychologic Assessment
Cognitive assessment was carried out annually using well-established standardized tests to include measures sensitive to the pattern of cognitive impairment associated with SVD. Premorbid Intelligent Quotient was estimated using the National Adult Reading Test-Restandardized.23 Tasks were grouped into broad cognitive functions: executive function and processing speed.
Executive function: Trail making test, (Matrix B) (Reitan 1996) Modified Wisconsin Card Sorting Test, 24 and Phonemic Fluency (FAS). 25
Processing speed: Wechsler Adult Intelligence Scale-III (Wechsler, 1997 a) Digit symbol substitution, 26 Speed of Information Processing Task, 27 and Grooved Pegboard Task. 28
Task performance was age scaled using manually published normative data, transformed into z-scores, and aggregated to construct the cognitive indices by averaging across the component test measures for each subject. For further details on the cognitive assessment, please refer to Lawrence et al. 8
Statistical Analysis
Because of the inherited hierarchical nature of the data imposed by multiple measurements per patient, we use Linear Mixed Effects (LME) modeling to estimate change over the follow-up period in our MRI markers and cognitive measures. 29 Following graphical inspection of the raw data, it was reasonable to assume a multivariate normal distribution as well as linearity of change with time. Specifically, we used a random intercept and random slopes model, which permits the estimation of an average slope across the whole cohort while allowing for inter-individual variability. 29 The average slope represents the average annual change in a measurement and can be used for estimation of sample sizes. A Bayesian approach for statistical inference has been used and the parameter estimates are summarized as the means of their distribution and the uncertainty as their 95% credible interval (95% CI). This inferential approach accommodates for patient drop-out during the follow-up with the assumption that unobserved measurements are missing at random (MAR). The WinBUGS package (version 1.4.3, MRC Biostatistics Unit, Cambridge Institute of Public Health, Cambridge Biomedical Campus, Cambridge, UK) was used for estimation.
Change in MRI and cognitive indices estimated using a random intercepts and random slopes model fit to the data.
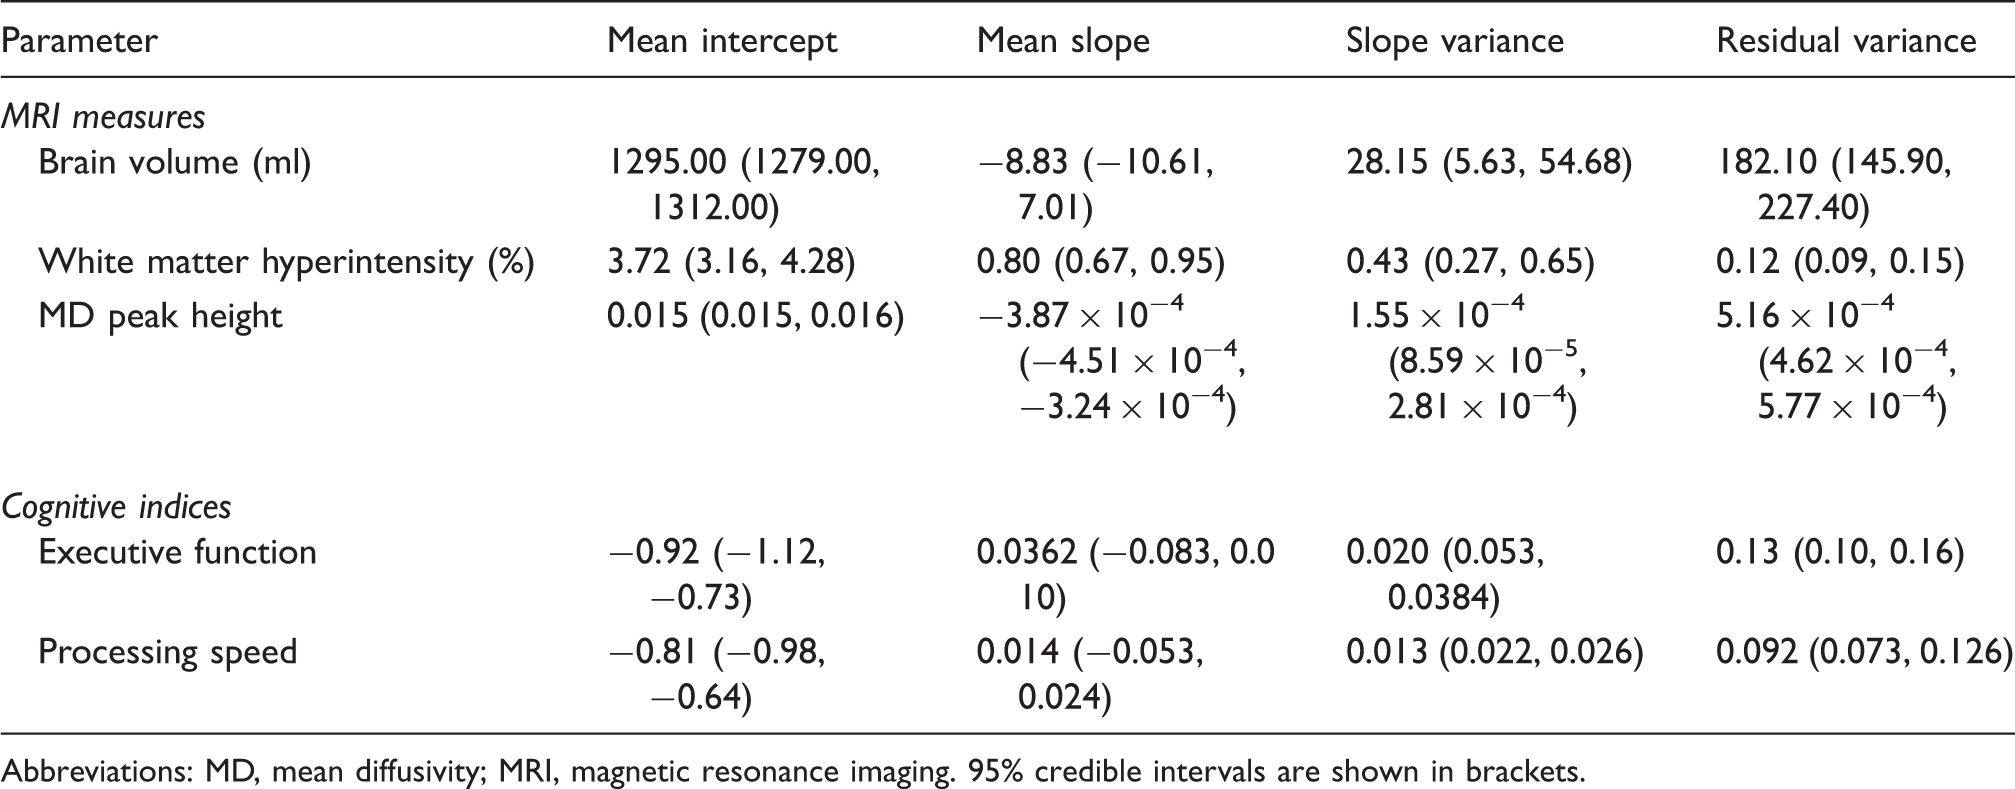
Abbreviations: MD, mean diffusivity; MRI, magnetic resonance imaging. 95% credible intervals are shown in brackets.
For lacunes, we defined the event as the occurrence of more lacunes than the number at baseline and the data have been modelled as for a binary outcome. We estimated the odds ratios of the event in association with the baseline number of lacunes and hence the predicted probability of developing more lacunes than the number found at the baseline. The proportion of developing new lacunes at some point during the follow-up period was then determined, and sample sizes were calculated for a percentage reduction in the average probability of having one or more new lacunes during the 3-year follow-up period.
In clinical trials, MRI data are often only available from two time points, baseline and final follow-up. We therefore used LME models to estimate average slopes using data only from two time points (baseline and 2 years, baseline and 3 years). All patients were included in the model as described above. Sample size estimations using data from two time points was compared with sample sizes using data from all four time points.
We also investigated the effect of missing data on the original estimates provided under the MAR assumption by using a simultaneous model having as components the random effect model as originally considered and a random effects logistic model with ‘missingness’ as a response (a binary longitudinal response where 1 designates the absence of a measurement for any reason and 0 its presence). This approach allowed us to investigate the relationship between data missing at follow-up and baseline measurements as well as the slope.
Results
Patient Demographics
Patient demographics at baseline.
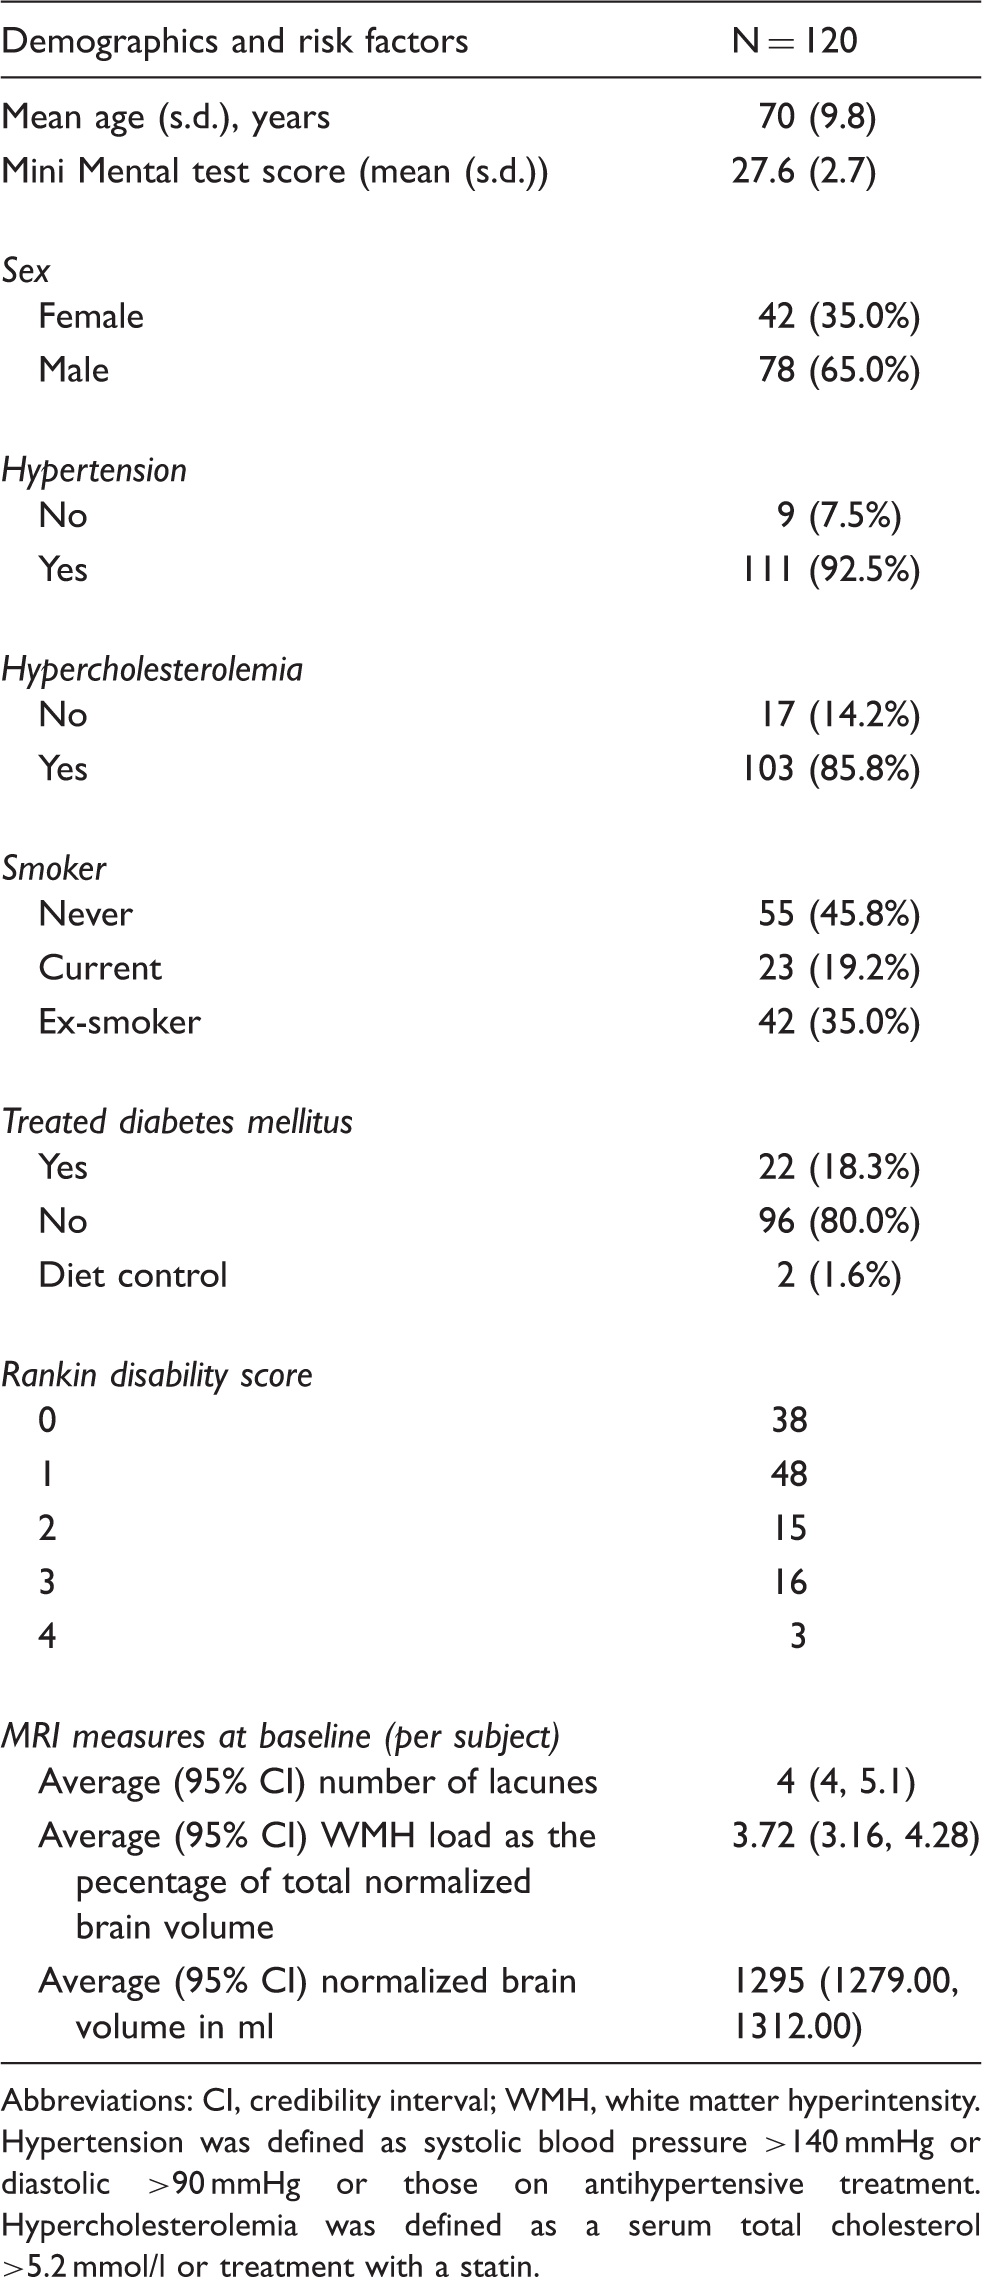
Abbreviations: CI, credibility interval; WMH, white matter hyperintensity. Hypertension was defined as systolic blood pressure >140 mmHg or diastolic >90 mmHg or those on antihypertensive treatment. Hypercholesterolemia was defined as a serum total cholesterol >5.2 mmol/l or treatment with a statin.
Brain Volume
Over the course of the observational period, there was strong evidence of a decrease in brain volume. The average (95% credibility interval) annual brain volume change was equal to −8.86 m/s (−10.67, −7.05 or −0.69% of baseline per year; Table 3; Figure 1).
Plots showing individual trajectories in magnetic resonance imaging (MRI) markers showing a decrease in mean diffusivity (MD) normalized peak height (MD NPH), a decrease in brain volume and an increase in white matter hyperintensity volume (WMH) over the 3-year follow-up period. Time points are shown on the x axis. The average slope is shown in red with credibility intervals. There is only a minimal change in slope when missing data are accounted for in simultaneous models (shown in blue). MAR, missing at random.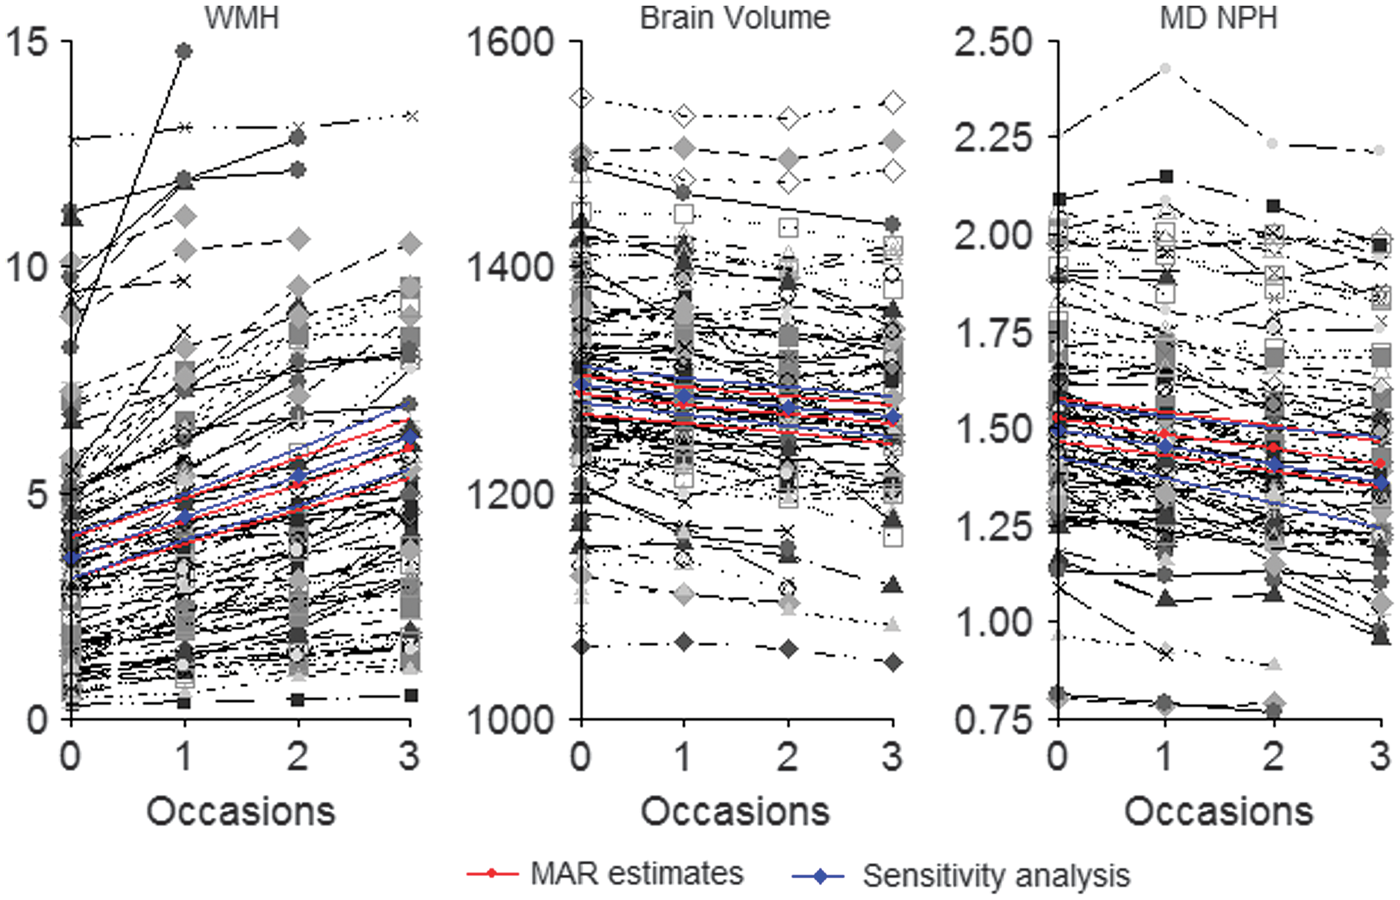
WMH Volume
Larger WMH volume at baseline was associated with a faster rate of growth. Over the course of the observational period, there was a strong evidence of growth in WMH volume. The average (95% credibility interval) annual change in WMH volume was equal to 0.80% (0.67, 0.95; Table 3; Figure 1).
Diffusion Imaging
MD NPH: There was strong evidence of a decrease in MD NPH over the course of the observational period. The average (95% credibility interval) annual change was equal to −3.87 × 10⁻⁴ (−4.51 × 10⁻⁴, −3.24 × 10⁻⁴) (or −2.54% with respect to baseline per year) (Table 3; Figure 1).
Lacunes
There were 98, 77, and 70 subjects with suitable T1-weighted images at time points 1, 2, and 3, respectively. Sixteen out of the 98 subjects had one or more new lacunes after 1 year of follow-up; 17 out of the 77 subjects had one or more new lacunes after 2 years of follow-up. Twenty out of the 70 subjects had one or more new lacunes after 3 years of follow-up. The number of lacunes at baseline was positively associated with a higher probability of new lacunes at follow-up. After modeling the baseline data using a Poisson distribution, the mean (95% credibility interval) number of baseline lacunes was estimated to be 4 (4.2, 5.1). However, 50% of subjects had ⩽2 lacunes at baseline. The predicted probability of developing >4 lacunes over the 3-year follow-up period was estimated to be 0.21 (0.13, 0.31).
Cognition
Executive function: There was no evidence of change in executive function (Z-score) over the course of the observational period. The average (95% credibility interval) annual change was equal to −3.62 × 10⁻² (−8.33 × 10⁻², 1.07 × 10⁻²; Table 3).
Processing speed: There was no evidence of change in processing speed (Z-score) over the course of the observational period. The average (95% credibility interval) annual change was equal to −1.44 × 10⁻² (−5.35 × 10⁻², 2.47 × 10⁻²; Table 3).
Sample Size Calculations
The predicted minimum sample size per arm (for MRI and cognitive measures) (power = 0.0.8 and type 1 error = 0.05) for a hypothetical clinical trial of 3-year duration assuming a balanced design with measurements taken every year evenly in time to test hypothetical treatment effects of 30, 25, 20, 15, and 10% in the intervention group.
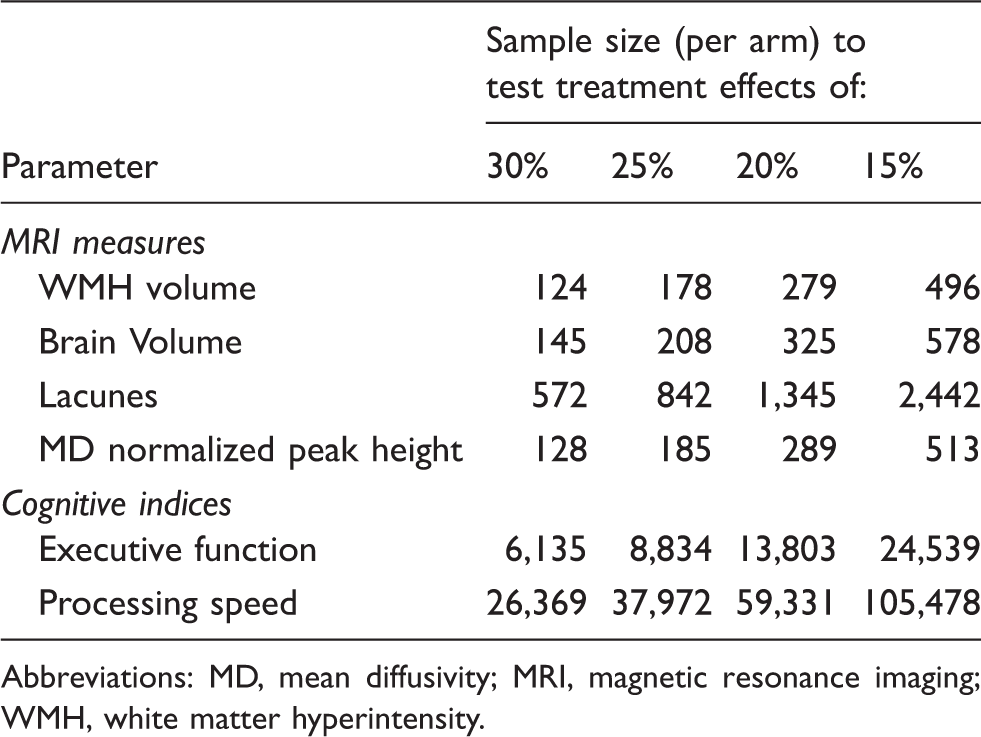
Abbreviations: MD, mean diffusivity; MRI, magnetic resonance imaging; WMH, white matter hyperintensity.
For lacunes, the sample size was calculated for a percentage reduction in the average probability of having >4 lacunes at follow-up. For a 3-year trial duration, the minimum sample size required to detect a 30, 25, 20, and 50% treatment effect at 80% power was 572; 842; 1,345; and 2,442; respectively (Table 4).
Sample size estimates for MRI markers using all available data (four time points) compared with sample size estimates using data only from two time points.
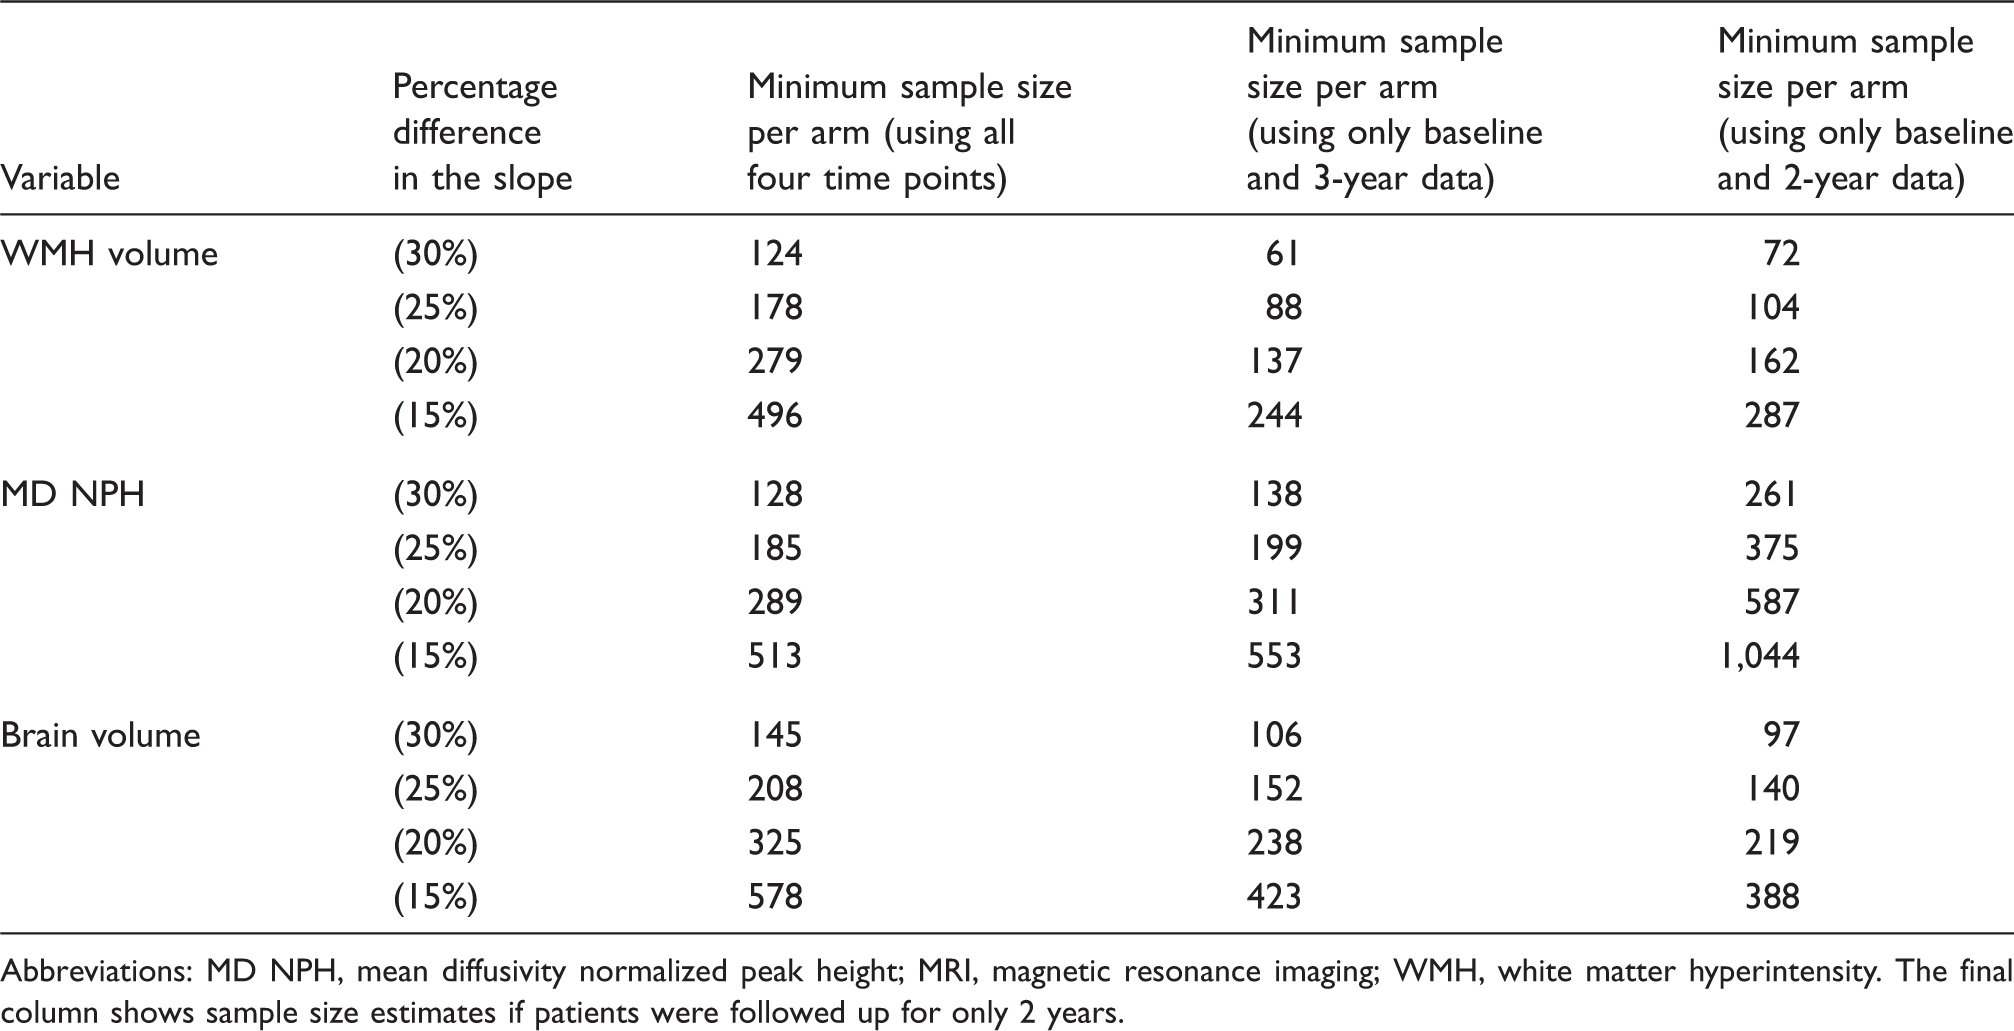
Abbreviations: MD NPH, mean diffusivity normalized peak height; MRI, magnetic resonance imaging; WMH, white matter hyperintensity. The final column shows sample size estimates if patients were followed up for only 2 years.
Sensitivity Analysis
The simultaneous models, which take ‘missingness’ into account, did not reveal dramatic changes in the average rate of change for the MRI measures. The 95% credibility intervals (for both intercepts and slopes) overlap to a large extent with the original MAR model (Supplementary Table S1; Figure 1). The simultaneous model for MD NPH showed the largest departure from its original MAR slope estimate of −0.039 (−0.045, −0.032) to −0.045 (−0.07, −0.018) (Supplementary Table S1, Figure 1).
The analysis showed that older patients were more likely to drop out of the study. There was no strong evidence that baseline WMH volume, brain volume or diffusion parameters were predictive of dropout however we found that patients with a faster increase in WMH volume were more likely to drop out at subsequent time points (Supplementary Table S1).
Baseline WMH volume was positively correlated with the rate of WMH growth. Larger brain volumes at baseline were also correlated with a faster rate of atrophy. There was, however, no relationship between baseline diffusion parameters and their rate of change (Supplementary Table S1).
Discussion
This prospective longitudinal study in symptomatic SVD has shown that change in MRI markers is detectable over a 3-year follow-up period. In contrast over the same time period there was no evidence of change detectable in cognitive measures. The effect of age on cognitive and MRI measures was deemed negligible. It follows that sample size estimates of the number of patients needed to demonstrate a treatment effect in an interventional trial are much smaller when using MRI markers as an end point.
The lack of cognitive change is consistent with the recent results of the SPS3 trial in approximately 3,000 patients with MRI confirmed lacunar stroke. 32 Over a median follow-up of 3 years, there was very little cognitive change. Why cognitive change is so difficult to detect in such a cohort, when it is easily detectable in a high proportion of individuals in cross sectional studies 8 is unclear. Possible factors may include measurement error, practice effects, and importantly rapidly declining patients dropping out of the study which there was evidence of in our SCANS cohort. In addition, rates may differ in different patient cohorts with individuals in the more advanced stages of cognitive impairment tending to decline faster. However, whatever the reason, the difficulty detecting cognitive change highlights the need for more sensitive ways to detect change and allow screening of novel therapies in smaller number and short follow-up periods.
A useful surrogate marker needs to be both sensitive to change and to correlate with meaningful clinical outcomes. In this study, WMH volume and the diffusion parameter, MD NPH, were most sensitive to change and therefore had the smallest sample size estimates. In contrast to a previous smaller study with shorter follow-up, 12 DTI markers would require slightly larger sample sizes than WMH, but further data are required on the relative sensitivity of the two measures to white matter damage.
The available evidence indicates that the MRI markers investigated in this study do correlate with clinical outcomes as outlined in the introduction. Although WMH volume has been shown to be associated with cognitive impairment, these associations have been inconsistent and weak,5,33 particularly in patients with more severe disease and confluent WMHs at study entry. 12 This was also the case in the baseline data from the SCANS cohort used in this study. 8 Brain volume and DTI parameters show stronger associations with cognitive impairment,8,34 suggesting they may represent clinically meaningful surrogate markers. Deciding which markers are most useful can only be definitively evaluated by including them in clinical trials and determining which correlate most closely with treatment effects measured using clinical end points. A combination of these MRI measures (i.e., a composite score) may offer a more sensitive approach; however, whether such a parameter is able to predict change in a clinical outcome measure longitudinally is yet to be determined. In addition, the relative sensitivity of clinical end points such as progression to disability and dementia will need to be assessed in larger cohorts with longer follow-up.
Because of the constraints of longitudinal follow-up and the cost of MRI scanning in a clinical trial, it is often not practical to collect MRI data for >2 time points. We therefore performed additional analyses to determine whether using MRI data from only two time points affected the sample size estimates. We found that sample size estimates for WMH appear slightly smaller when only data from baseline and 3 year follow-up are considered but remain largely similar for brain volume and MD NPH. This suggests that this approach is feasible and has similar power for clinical trials; however, it is important to be aware that these two time point models are more susceptible to noise and data MAR. In studies using MRI data from only two time points, the interval must always be long enough for sufficient change to accumulate and be detectable above the noise that is inevitable whenever measurements are made. This is evident from the higher estimated sample sizes with 2 vs. 3 year follow-up.
It is important to carefully define and identify suitable cases for clinical trials in SVD. The heterogeneous nature of SVD is a major hindrance to this. The cerebral small vessels can be affected by a wide range of pathologies, including cerebral amyloid angiopathy, immunologically mediated diseases, and genetic SVDs, such as CADASIL. 1 The most common type, however, is age-related and vascular risk factor-related SVD. There is increasing evidence to suggest that even this type of SVD may have multiple pathologies. It has been suggested there are at least two underlying arterial pathologies: microatheroma primarily causing larger, usually isolated lacunar infarcts and a diffuse arteriopathy characterized by arteriolosclerosis, lipohyalinosis, or fibrinoid necrosis (depending on severity of the abnormality), which is thought largely to result from hypertension and is associated with multiple smaller lacunar infarcts and leukoaraiosis.35,36 This distinction is supported by pathologic, radiologic, and risk factor data. 37 In view of these possible differences and to study a homogenous group of patients, we recruited only patients with symptomatic lacunar infarction confirmed on MRI as well as confluent leukoaraiosis.
CMBs are a feature of SVD that are thought to vary in their distribution depending on the underlying disease process, 16 although their prognostic significance remains uncertain. We have analyzed CMBs in the baseline data and shown a weak correlation with cognition, 38 but longitudinal data on CMBs were not available for this analysis. Therefore, we were unable to determine sample size measures based on this imaging parameter.
A major limitation of this study was that we had a relatively high dropout rate, although this is consistent with previous longitudinal studies in ageing. 39 Patients who did not complete follow-up tended to be older and more disabled. This may have led to an underestimation of the rate of change in MRI markers and cognition. Optimal trial design has to take careful consideration of issues such as the dropout rate and increase sample sizes accordingly. Errors in image processing and registration are inevitable when attempting to quantify MRI markers in a standardized manner. This will increase noise in the data and reduce sensitivity to change. For example, the reported error of SIENA is 0.15%. It is therefore unreliable when the mean difference between groups is <0.2%. In addition, measurement error may be higher when these markers are used in a multicenter trial with imaging on different scanners. Because of the heterogeneous nature of the disease, it is possible that in some patients MRI markers have plateaued to maximal impairment or have not yet changed appreciably (ceiling and floor effects, respectively). Studies with longer follow-up may be capable of identifying these patients and capture potential non-linear aspects of change. Finally, these data were acquired on a 1.5-Tesla MRI scanner. The quality and precision of data might be improved by acquiring data using sequences with isotropic voxel dimensions, at higher resolutions, and MRI field strengths. 40
In conclusion, MRI is promising as a potential surrogate marker in SVD. It is much more sensitive to change than cognitive measures over a relatively short time period. Optimizing and validating these markers could significantly reduce the size, duration, and cost of clinical trials. Further studies evaluating these markers and particularly relating them to clinical and cognitive outcomes in longitudinal studies are required, and this would ideally be done within the context of a randomized clinical trial.
Footnotes
Funding
The author(s) disclosed receipt of the following financial support for the research, authorship, and/or publication of this article: The SCANS research study was supported by a Wellcome Trust grant (081589). Recruitment to the SCANS study was supported by the English National Institute of Health Research (NIHR) Clinical Stroke Research Network. Hugh Markus is supported by an NIHR Senior Investigator award and his work is supported by the Cambridge University Hospital Comprehensive NIHR Biomedical Research Unit. Andrew Lawrence is supported by a project grant from Alzheimer's Research UK (ARUK-PG2013-2).
Acknowledgement
The authors thank Dr Lalit Kalra and Dr Tony Rudd for help with recruitment. The authors also thank Dr Thomas Willis for assistance with neuropsychologic assessment.
Declaration of conflicting interests
The author(s) declared no potential conflicts of interest with respect to the research, authorship, and/or publication of this article.
Authors’ contributions
Philip Benjamin—Conception, acquisition of data, analysis and interpretation of data, drafting the article. Eva Zeestraten—Analysis and interpretation of data, drafting the article. Christian Lambert—Analysis and interpretation of data. Irina Chis Ster—Statistical analysis. Owen A Williams—Analysis and interpretation of data. Andrew J Lawrence—Acquisition of data, analysis and interpretation of data. Bhavini Patel—Acquisition of data, analysis and interpretation of data. Andrew D MacKinnon—Analysis and interpretation of data. Thomas R Barrick—Supervisor, critical revision of article, final approval. Hugh S Markus—Supervisor, conception, critical revision of article, final approval.