Brain perfusion tracers like [99mTc] d,l-hexamethyl-propyeneamine oxime (99mTc-HMPAO) and [99mTc] ethyl-cysteinate dimer (99mTc-ECD) underestimate regional cerebral blood flow (rCBF) at high flow values. To improve linearity between tracer accumulation and rCBF, two different models have been proposed. One is Lassen's correction algorithm for back-diffusion of tracer, and the other is based on the permeability-surface (PS) model for correction of low first-pass extraction. Although both these models have the same goal, they have completely different forms of equation. It was demonstrated that mathematical approximation of the PS model equation leads to Lassen's equation. In this process, the relationship between PS, CBF values and Lassen's parameter was acquired, and how to correct both the back-diffusion and low first-pass extraction was also demonstrated. A computer simulation confirmed that the two models provided similar consequences when the parameter value is chosen according to the relationship found. Lassen's equation can be used to correct not only back-diffusion but also low first-pass extraction. To perform overall correction, the parameter value we have been using for decades may be too weak. I estimated that the parameter value for overall correction of HMPAO would be around 0.5, and that of ECD would be around 0.65.
The measurement of rCBF using single photon emission computed tomography (SPECT) utilizes radiopharmaceuticals such as [99mTc] d,l-hexamethyl-propyeneamine oxime (99mTc-HMPAO) and [99mTc] ethyl-cysteinate dimer (99mTc-ECD). 99mTc-HMPAO and 99mTc-ECD as brain perfusion tracers suffer significant underestimation of rCBF, compared with [123l] N-isopropyl-p-iodoam-phetamine (123I-IMP). The underestimation reduces tracer accumulation contrast between high-flow and low-flow regions, which may make it difficult to detect small rCBF changes.
Two methodological approaches have been reported to correct the underestimation. The first approach focused on correction for flow-dependent back-diffusion from brain tissue to arterial plasma, which is now commonly called as Lassen's linearization correction algorithm.1 The second approach focused on correction for limited first-pass extraction from arterial plasma to brain tissue.2 Although both these models improve the linearity between rCBF and tracer accumulation, the form of Lassen's equation is quite different from that of the equation based on the PS model, and their target for correction is also different.
Owing to the assumption that the extraction in the region of interest (E) is same as that in the reference region (Er), Lassen's method cannot be applicable under limited first-pass extraction circumstances. However, E varies with variations in flow (F) in a region. Furthermore, correction of both back-diffusion and limited first-pass extraction has never been reported to date. Despite these limitations, Lassen's correction is widely applied not only for 99mTc-HMPAO but also for 99mTc-ECD.3
This research proposes to integrate the back-diffusion correction and the limited first-pass extraction correction. The mathematical relationship between Lassen's model and the model based on the PS model was examined and confirmed by simulation.
MATERIALS AND METHODS
Theory: Approximation of Permeability-Surface Model
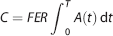
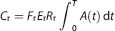
where C is regional activity of tracer, F is CBF, E is first-pass extraction, R is retention fraction of extracted tracer, and A(t) is input function of artery. This equation in the reference region is also expressed as follows:
So, the SPECT count ratio to the reference region is as follows:
Here, the effect of back-diffusion is ignored, and R/Rr becomes 1.
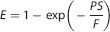
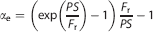
Renkin4 and Crone5 demonstrated that E can be expressed as a function of F and PS:
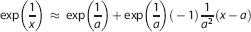
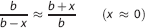
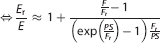
exp (1/x) can be approximated linearly using Taylor expansion:
Here, x = −F/PS and a = −Fr/PS are substituted into equation (6). As F≈Fr the linear approximation (equation (6)) makes sense.
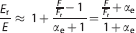
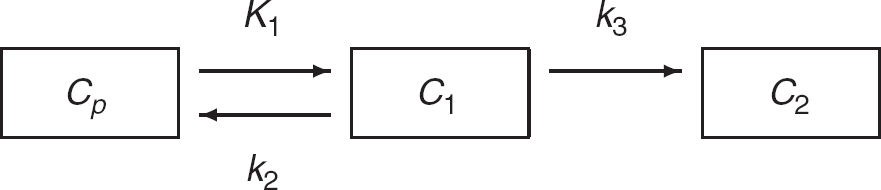
Now I have derived Lassen's equation from the PS model equation, which indicates that Lassen's equation can be a good approximation of the PS model. Note that αe has no relation to Lassen's α to correct back-diffusion (= k3/k2r, Figure 1). To distinguish from αe, conventional Lassen's α to correct back-diffusion is named αbd in this article.
Two tissue compartment model of 99mTc-HIVlPAO or 99mTc-ECD. Cp: lipophilic tracer in blood, C,: lipophilic tracer in brain, C2: hydrophilic tracer in brain. K1, k2, k3 are the rate constants for transport of the tracer between compartments. ECD, ethyl-cysteinate dimer; HMPAO, d,l-hexamethyl-propyeneamine oxime.
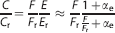
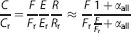
C/Cr can be described in the form of Lassen's equation.
No approximation was applied except E/Er.
Simulation
The equation based on PS model and its approximation to Lassen's equation were simulated using spreadsheet software, Excel 2010 (Microsoft Corporation, Redmond, WA, USA), on a personal computer.
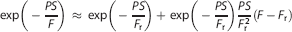
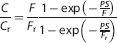
First, the effect of first-pass extraction only is considered. The equation based on PS model
and Lassen's equation
were compared numerically. PS and Fr values were adopted from the contribution of 99mTc-ECD by Tsuchida et al,7 and αe value was obtained from equation (12). Namely, from the values of PS = 66.2 and Fr = 55.0, αe was calculated as 0.94.
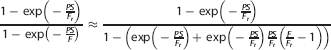
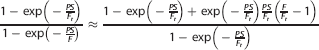
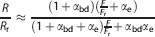
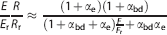
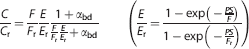
Then, the effect of both back-diffusion and first-pass extraction is considered. The equation based on PS model
and its approximation to Lassen's equation
were compared numerically. PS = 81.7, Fr = 50, and αbd = 1.30 were adopted. These values are based on modified Lassen's contribution1 of 99mTc-HMPAO.
RESULTS
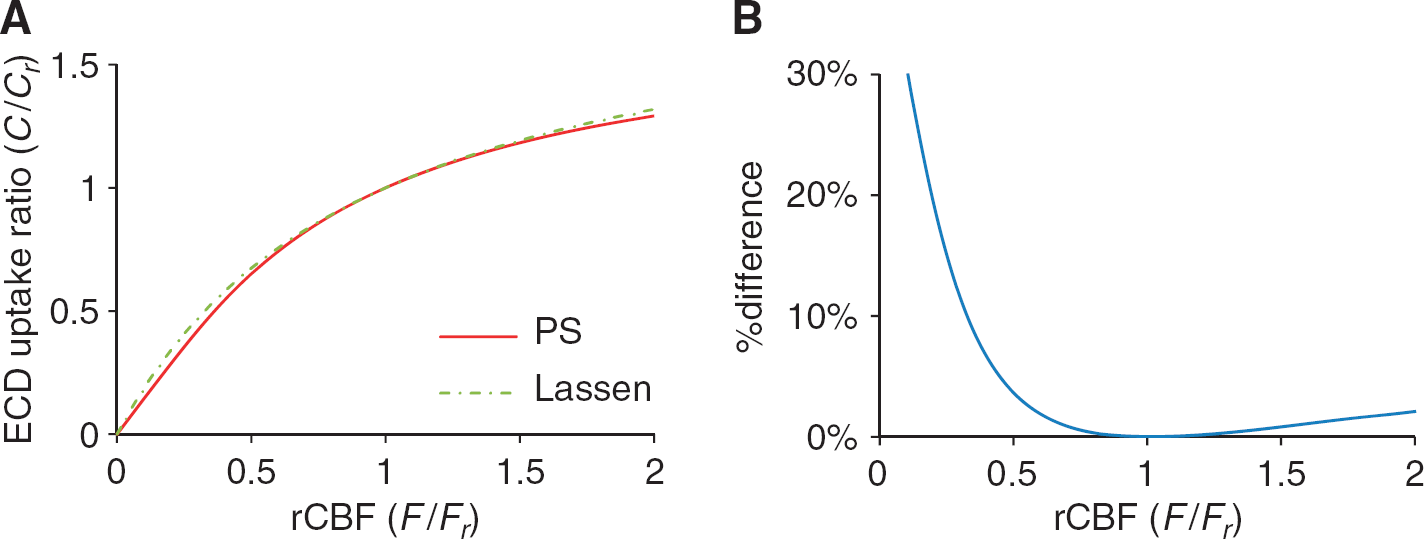
This study successfully demonstrated that the equation based on PS model and Lassen's equation are very close, if the parameter αe is selected according to equation (12) (Figure 2).
Simulated relationship between rCBF ratio (F/Fr) and tracer uptake ratio (C/Cr) when the effect of first-pass extraction only is considered. The equation based on PS model (equation (22)) and its approximation to Lassen's equation (equation (23)) were compared numerically. PS and Fr are based on Tsuchida's7 contribution of ECD. αe is obtained by equation (12). (A) The original equation based on PS model (PS) and Lassen's equation (Lassen) were plotted against rCBF. (B) %difference between the original equation based on PS model and the approximated equation by Lassen's equation was plotted against rCBF. CBF, cerebral blood flow; ECD, ethyl-cysteinate dimer; PS, permeability-surface.
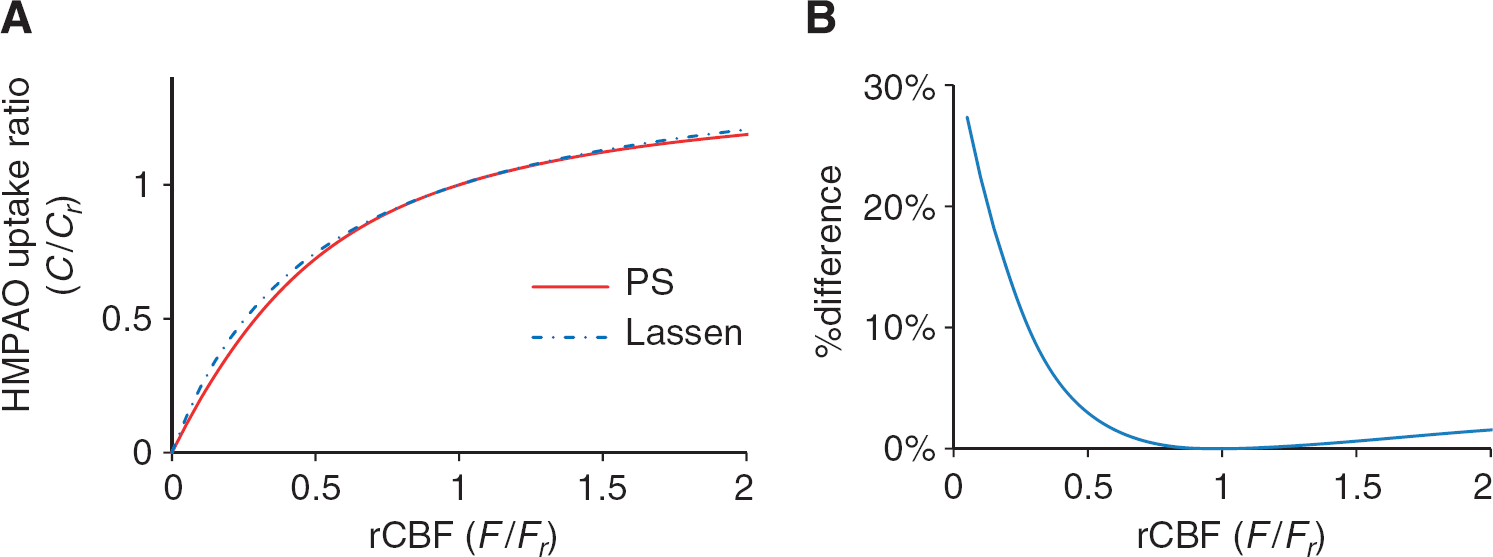
It was also demonstrated that when both back-diffusion and low first-pass extraction are corrected, Lassen's equation is still similar to the equation based on PS model (Figure 3).
Simulated relationship between rCBF ratio (F/Fr) and tracer uptake ratio (C/Cr) when the effect of both back-diffusion and first-pass extraction is considered. The equation based on PS model (equation (24)) and its approximation to Lassen's equation (equation (25)) were compared numerically. PS, Fr and αbd are based on modified Lassen's1 contribution of HMPAO. (A) The original equation based on PS model (PS) and Lassen's equation (Lassen) were plotted against rCBF. (B) %difference between the original equation based on PS model and the approximated equation by Lassen's equation was plotted against rCBF. CBF, cerebral blood flow; HMPAO, d,l-hexamethyl-propyeneamine oxime; PS, permeability-surface.
The two models showed relative dissociation at low flow values.
DISCUSSION
It was demonstrated that mathematical approximation of the equation based on PS model leads to Lassen's equation. This simulation confirmed that Lassen's equation is good approximation of the equation based on PS model. Although I assumed F/Fr ≈ 1, it seems that the values of the two different correction functions are very close over a wide range of F/Fr. Maximum %differences of the two different functions are 2.9% in HMPAO (Figure 3), and 3.7% in ECD (Figure 2), over the range of F/Fr (0.5–2). Certainly %difference is relatively large at low flow values, but the absolute difference of two models is small. Furthermore, CBF less than 20 ml/100 g per minute (F/Fr < 0.4, when Fr = 50 ml/100 g per minute) is physiologically unrealistic for viable brain tissue.
We cannot solve the equation based on PS model (equation (22)) analytically. That is why authors from Kyoto University2,7 obtain the F/Fr value from the C/Cr value by fourth-order polynomial curve fitting of the equation based on PS model. Their polynomial curve fitting of 99mTc-HMPAO is certainly good (data not shown), but their curve is also an approximation. The impossibility of solving analytically is an evident limitation of the equation based on PS model, whereas we can obtain the inverse function of Lassen's equation very easily. This is an advantage of Lassen's equation.
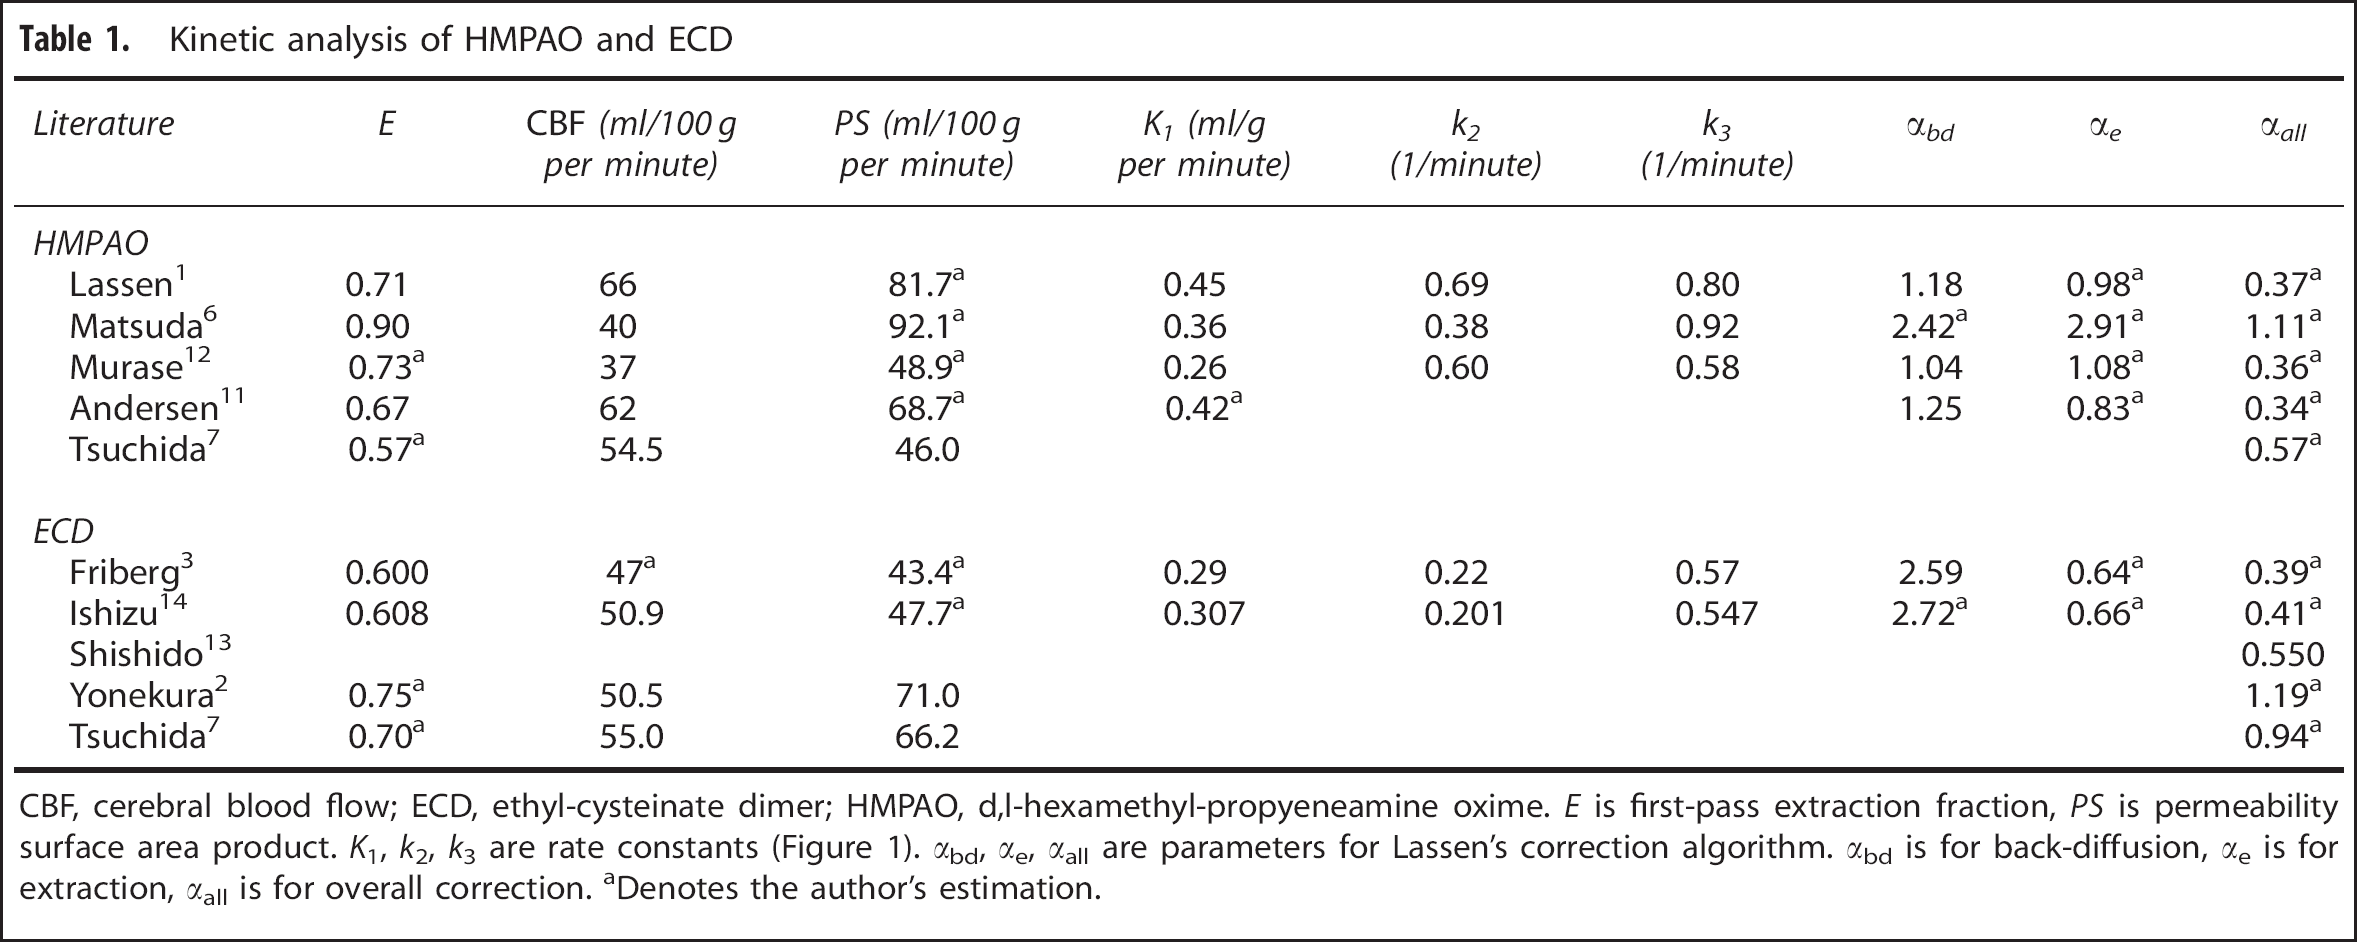
Now, I would like to determine suitable parameter values to make SPECT images of 99mTc-HMPAO or 99mTc-ECD into rCBF maps. I have revealed the relationship between Lassen's parameter (αe), and PS, and Fr (equation (12)). I also obtained the parameter for overall correction (equation (20)). These equations will be quite useful. These parameters can be estimated from the literatures (Table 1).
CBF, cerebral blood flow; ECD, ethyl-cysteinate dimer; HMPAO, d,l-hexamethyl-propyeneamine oxime. E is first-pass extraction fraction, PS is permeability surface area product. K1, k2, k3 are rate constants (Figure 1). αbd, αe, αall are parameters for Lassen's correction algorithm. αbd is for back-diffusion, αe is for extraction, αall is for overall correction.
Denotes the author's estimation.
Lassen's estimation for 99mTc-HMPAO, α = 1.5 could be too large, because they ignored the influence of change in first-pass extraction, although it has been used for around a quarter of a century. Many studies confirmed that correction with α = 1.5 is good enough,8–11 but they did not confirm that the value of 1.5 is the best. K1 (= EF) of 99mTc-HMPAO was reported to be considerably underestimated in comparison with 133Xe-CBF, which indicated that the single-pass extraction fraction (E) of 99mTc-HMPAO is considerably lower than unity.12 My estimation also shows that the effect of limited first-pass extraction (αe) is almost as large as the effect of back-diffusion (αbd) (Table 1).
The robustness of the correlation coefficient may be the reason why many studies confirmed the value of α as 1.5. Linearization correction was reported to give a stable correlation coefficient over a wide range of α (1.0–3.0) when using the cerebellum as the reference region.10 The correlation coefficient changes very little, but smaller α makes correction stronger, and the contrast of the images will be also enhanced.
When the αall value is needed to make SPECT data into a rCBF map, it would be good to compare 99mTc-HMPAO/99mTc-ECD SPECT data and CBF PET directly. They had to make complicated calculations to obtain the kinetic rate constants, and dynamic SPECT had to be performed over a short time. These factors may cause larger errors. However, the stable correlation coefficient over a wide range of α (as discussed above) may make it difficult to obtain a suitable value by the least-squares method. Scatter radiation will make the uptake ratio (C/Cr) increase at a lower range of flow, and will cause a weaker correction (larger value of the parameter). Tsuchida et al7 compared 99mTc-HMPAO SPECT images and CBF PET images directly. Because they did not correct for Compton scatter, the true value of the parameter might be slightly less than 0.57, which I have estimated from their PS and Fr values.
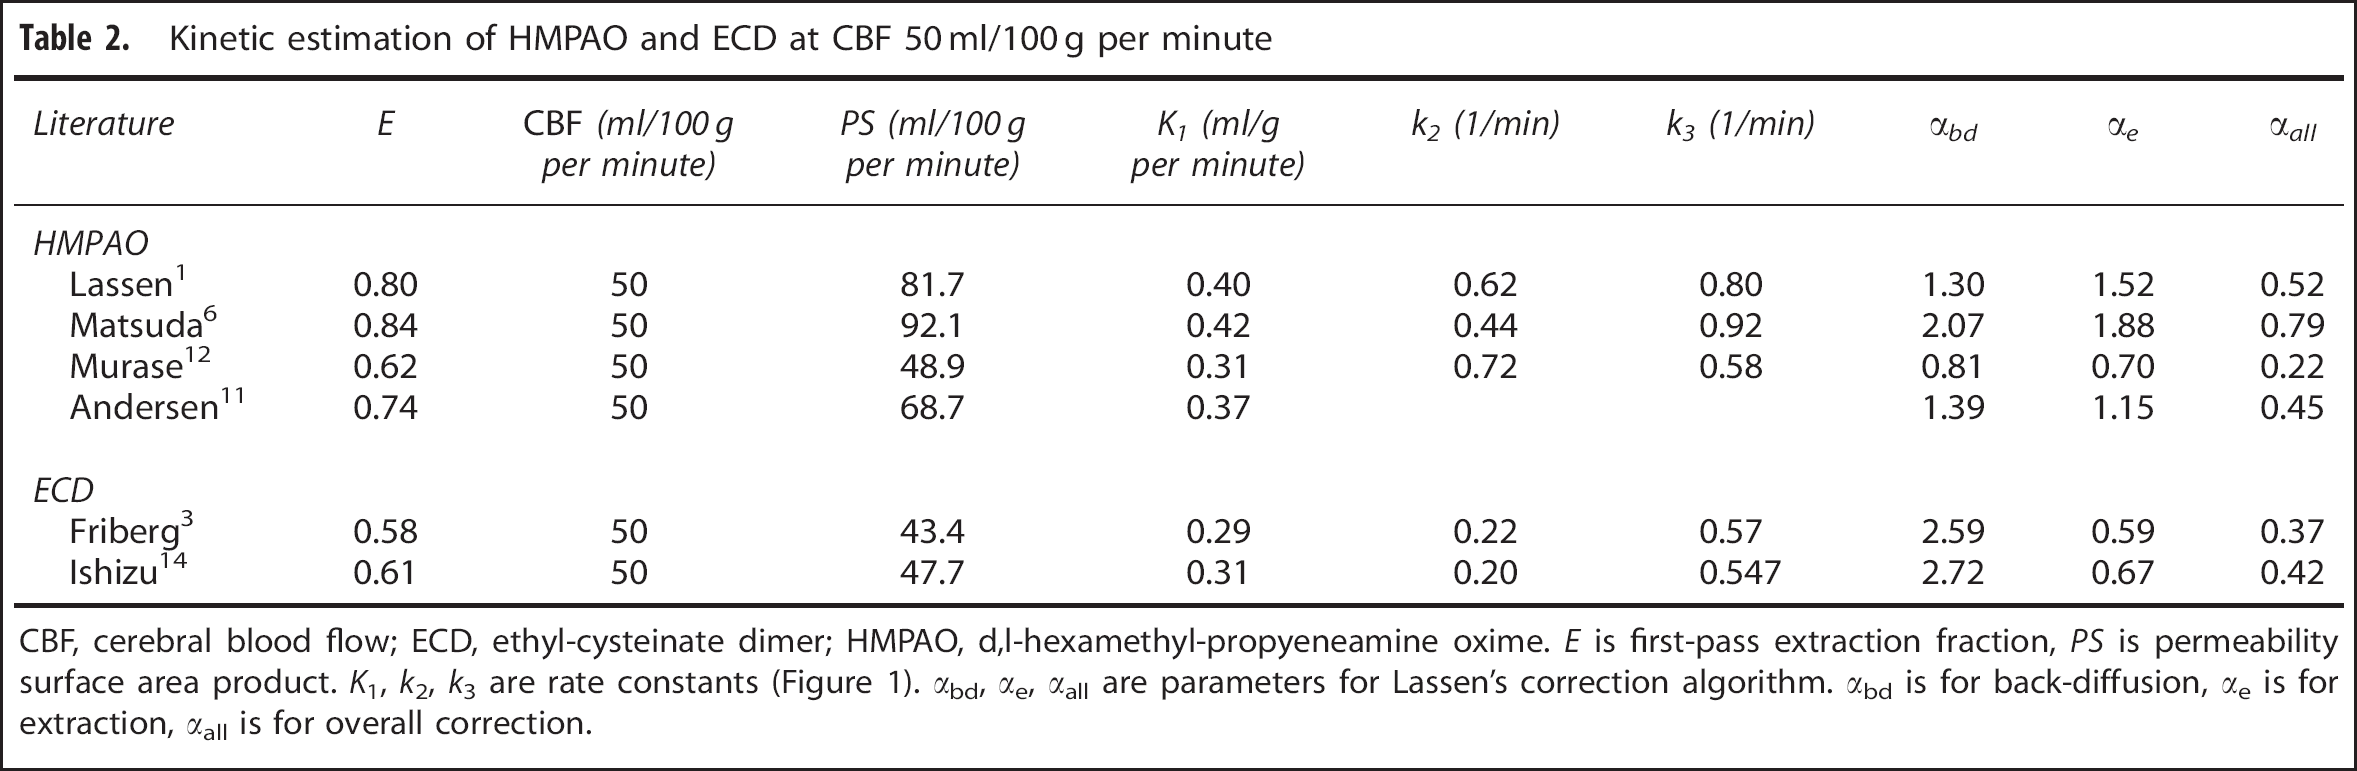
The αan value is estimated using kinetic analyses now. Unfortunately, the kinetic data from three kinetic analyses of 99mTc-HMPAO1,6,12 and one study with Fick's principle11 do not provide similar outcomes (Table 1). As Lassen estimated α = 1.5 at CBF = 50 ml/100 g per minute, I also estimated the kinetic parameters at CBF = 50 ml/100 g per minute (Table 2). I estimated the first-pass extraction from the PS value. A αall value of 0.5 will be suitable based on the median and the mode of Table 2. This value of 0.5 is also consistent with Tsuchida's7 0.57 and Inugami's cerebellum reference.10
Kinetic estimation of HMPAO and ECD at CBF 50 ml/100 g per minute
CBF, cerebral blood flow; ECD, ethyl-cysteinate dimer; HMPAO, d,l-hexamethyl-propyeneamine oxime. E is first-pass extraction fraction, PS is permeability surface area product. K1, k2, k3 are rate constants (Figure 1). αbd, αe, αall are parameters for Lassen's correction algorithm. αbd is for back-diffusion, αe is for extraction, αall is for overall correction.
The parameter values of αbd, αe, αall are dependent on Fr. If you choose the region in which Fr is smaller, then the parameter will increase. Both αbd (= k3λ/Fr(1 — exp(—PS/Fr))) and αe (equation (12)) decrease monotonically as Fr increases, and αau changes in the same direction as αbd and αe, because equation (20) can be rearranged as follows:
To correct 99mTc-ECD images, the a value obtained by Friberg et al,3 2.59 has been widely adopted for around two decades. It seems that few studies have evaluated this value.
The αall value would be near 0.550 according to direct comparison studies. Shishido et al from Akita13, and Yonekura et al and Tsuchida et al from Kyoto2,7 compared 99mTc-ECD SPECT and CBF PET images directly. There is a discrepancy between the value from Akita (0.550) and Kyoto (1.19, 0.94). The Kyoto group did not use Lassen's model, but the PS model. However, I demonstrated that the equation based on PS model and Lassen's equation are close, so the effect of the different model would be negligible. The Kyoto group did not apply scatter correction,7 whereas the Akita group corrected for scattered events.10 The study from Akita would be preferable to those from Kyoto about scatter correction.
The retention fraction of 99mTc-ECD is reported to remain constant irrespective of changes in rCBF.14 Lassen et al1 assumed that (i) k2 = EF/λ and λ is constant, (ii) k3 is constant, and (iii) E is constant. 99mTc-ECD might not satisfy the assumption, k2 = EF/λ. If the retention fraction is really constant, R/Rr will be 1.
The αall value of 99mTc-ECD is estimated using kinetic analyses now. Friberg et al3 and Ishizu et al14 performed kinetic analysis. Fortunately, outcomes from these two studies provided similar outcomes strikingly (Table 1). If the back-diffusion of 99mTc-ECD is constant irrespective of changes in rCBF, the parameter should be 0.65. The value did not change much if the parameter value at Fr = 50 ml/100 g per minute was estimated (Table 2).
In this article, PS value is assumed to be constant. 99mTc-ECD did not show any correlation between PS product and rCBF.14 However, PS value of 99mTc-HMPAO was reported to increase linearly according to rCBF in the rat study.15PS value may vary between regions, such as gray matter and white matter. The change of PS value can be a limitation of this study.
Footnotes
The author declares no conflict of interest.
ACKNOWLEDGMENTS
The author thanks Dr Wendy Gray for editing the English of this manuscript. The author thanks Dr Yoshitaka Kumakura for helpful comments.
References
1.
LassenNAAndersenARFribergLPaulsonOB. The retention of [99mTc]-d,l-HM-PAO in the human brain after intracarotid bolus injection: a kinetic analysis. J Cereb Blood Flow Metab1988; 8: S13–S22.
2.
YonekuraYTsuchidaTSadatoNNishizawaSIwasakiYMukaiT. Brain perfusion SPECT with 99mTc-bicisate: comparison with PET measurement and linearization based on permeability-surface area product model. J Cereb Blood Flow Metab1994; 14: S58–S65.
3.
FribergLAndersenARLassenNAHolmSDamM. Retention of 99mTc-bicisate in the human brain after intracarotid injection. J Cereb Blood Flow Metab1994; 14: S19–S27.
4.
RenkinEM. Transport of potassium-42 from blood to tissue in isolated mammalian skeletal muscles. Am J Physiol1959; 197: 1205–1210.
5.
CroneC. The permeability of capillaries in various organs as determined by use of the ‘indicator diffusion’ method. Acta Physiol Scand1963; 58: 292–305.
6.
MatsudaHObaHSekiHHigashiSSumiyaHTsujiS. Determination of flow and rate constants in a kinetic model of [99mTc]-hexamethyl-propylene amine oxime in the human brain. J Cereb Blood Flow Metab1988; 8: S61–S68.
7.
TsuchidaTYonekuraYNishizawaSSadatoNTamakiNFujitaT. Nonlinearity correction of brain perfusion SPECT based on permeability-surface area product model. J Nucl Med1996; 37: 1237–1241.
8.
YonekuraYNishizawaSMukaiTFujitaTFukuyamaHIshikawaM. SPECT with [99mTc]-d,l-hexamethyl-propylene amine oxime (HM-PAO) compared with regional cerebral blood flow measured by PET: effects of linearization. J Cereb Blood Flow Metab1988; 8: S82–S89.
9.
LangenKJHerzogHKuwertTRoosenNRotaEKiwitJCW. Tomographic studies of rCBF with [99mTc]-HM-PAO SPECT in patients with brain tumors: comparison with C15O2 continuous inhalation technique and PET. J Cereb Blood Flow Metab1988; 8: S90–S94.
10.
InugamiAKannoIUemuraKShishidoFMurakamiMTomuraN. Linearization correction of 99mTc-labeled hexamethyl-propylene amine oxime (HM-PAO] image in terms of regional CBF distribution: comparison to C15O2 inhalation steady-state method measured by positron emission tomography. J Cereb Blood Flow Metab1988; 8: S52–S60.
11.
AndersenARFribergHHSchmidtJFHasselbalchSG. Quantitative measurements of cerebral blood flow using SPEC and [99mTc]-d,l-HM-PAO compared to xenon-133. J Cereb Blood Flow Metab1988; 8: S69–S81.
12.
MuraseKTanadaSFujitaHSakakiSHamamotoK. Kinetic behavior of technetium-99m-HMPAO in the human brain and quantification of cerebral blood flow using dynamic SPECT. J Nucl Med1992; 33: 135–143.
13.
ShishidoFUemuraKMurakamiMInugamiAOgawaTFujitaH. Cerebral uptake of 99mTc-bicisate in patients with cerebrovascular disease in comparison with CBF and CMRO2 measured by positron emission tomography. J Cereb Blood Flow Metab1994; 14: S66–S75.
14.
IshizuKYonekuraYMagataYOkazawaHFukuyamaHTanakaF. Extraction and retention technetium-99m-ECD in human brain: dynamic SPECT and oxygens-water PET studies. J Nucl Med1996; 37: 1600–1604.
15.
AndersenARFribergHKnudsenKBMBarryDIPaulsonOBSchmidtJF. Extraction of [99mTc]-d,l-HM-PAO across the blood-brain barrier. J Cereb Blood Flow Metab1988; 8: S44–S51.