
Abstract
Positron emission tomography (PET) targeting the 18 kDa translocator protein (TSPO) is used to quantify neuroinflammation. Translocator protein is expressed throughout the brain, and therefore a classical reference region approach cannot be used to estimate binding potential (BP ND ). Here, we used blockade of the TSPO radioligand [11C]PBR28 with the TSPO ligand XBD173, to determine the non-displaceable volume of distribution (V ND ), and hence estimate the BP ND . A total of 26 healthy volunteers, 16 high-affinity binders (HABs) and 10 mixed affinity binders (MABs) underwent a [11C]PBR28 PET scan with arterial sampling. Six of the HABs received oral XBD173 (10 to 90 mg), 2 hours before a repeat scan. In XBD173-dosed subjects, V ND was estimated via the occupancy plot. Values of BP ND for all subjects were calculated using this V ND estimate. Total volume of distribution (V T ) of MABs (2.94 ± 0.31) was lower than V T of HABs (4.33 ± 0.29) (P<0.005). There was dose-dependent occupancy of TSPO by XBD173 (ED50 = 0.34 ± 0.13 mg/kg). The occupancy plot provided a V ND estimate of 1.98 (1.69, 2.26). Based on these V ND estimates, BP ND for HABs is approximately twice that of MABs, consistent with predictions from in vitro data. Our estimates of [11C]PBR28 V ND and hence BP ND in the healthy human brain are consistent with in vitro predictions. XBD173 blockade provides a practical means of estimating V ND for TSPO targeting radioligands.
INTRODUCTION
The 18 kDa translocator protein (TSPO) is highly expressed in both brain resident (microglia) and peripherally recruited (monocyte-derived macrophages) myeloid cells, although expression in the brain is not restricted to these cells. 1 Therefore, TSPO has become a target for positron emission tomography (PET) radioligands used to quantify the activation and density of these cells in vivo.
[ 11 C]-PK11195 has been used for the past two decades as a radioligand for the quantification of TSPO expression in the human brain. Focal, disease-related increases in TSPO expression have been demonstrated with this radioligand in many diseases, such as multiple sclerosis, 2 Parkinson's disease, 3 Huntington's disease, 4 and Stroke. 5 However, the quantification of the [ 11 C]-PK11195 PET signal is hampered by the poor signal-to-noise ratio. In recent years, several second-generation TSPO targeting radioligands have been developed. These have an improved signal-to-noise ratio compared with [ 11 C]PK11195, 6 but show large between-subject variability. We have shown that this between-subject variability is driven in a large part by the differences in the affinity with which the second-generation radioligands bind TSPO in vitro.7,8 These differences in affinity are explained by a polymorphism (rs6971) in the gene encoding TSPO, which leads to three distinct binding affinity classes: homozygote high-affinity binders (HABs) and low-affinity binders (LABs), and heterozygotes who express both binding sites (mixed affinity binders (MABs)). 9 We have demonstrated that this polymorphism translates accurately to differences in the in vivo PET signal across the genotypes, for the second-generation ligand [ 18 F]PBR-111. 10 The relevance of our in vitro findings for in vivo imaging has also been confirmed for other second-generation ligands.11–13
Second-generation radioligands enable quantification of the total volume of distribution (VT). However, the direct estimation of specific binding has not been possible. The direct estimation of specific binding requires an estimation of the non-displaceable volume of distribution (VWD), 14 which determines how much of the total signal (VT) is specific, VS = (VT = VND). The binding potential (BPND) can then easily be calculated as well (BPND = VT/VND — 1). 14 As TSPO is expressed throughout the brain, 15 the definition of a suitable reference region is problematic and this means that the estimation of VND has to rely on pharmacological blockade. To date, this approach has not been followed in humans for lack of a suitable pharmacological agent suitable for human use.
Here, we use the TSPO agonist XBD173 (emapunil) 16 to block the binding of the second-generation TSPO radioligand, [ 11 C]PBR28, in order to estimate the VND and hence the BPND. In addition to the pharmacological blockade, we also estimated the VND by applying the polymorphism plot (10) to the [ 11 C]PBR28 data across a population of HAB and MAB subjects.
MATERIALS AND METHODS
Human Subjects
These studies were conducted at the Imanova Centre for Imaging Sciences, London, approved by the West London Research Ethics Committee and ARSAC (Administration of Radioactive Substances Advisory Committee), and followed International Conference on Harmonization guidelines. All subjects (26 healthy volunteers, 7 females) gave written informed consent, and their eligibility was confirmed via full medical history, physical and neurological examinations, routine blood tests, and electrocardiogram (Supplementary Table 1).
BPND values based on population VND estimates from occupancy plot and polymorphism Plot
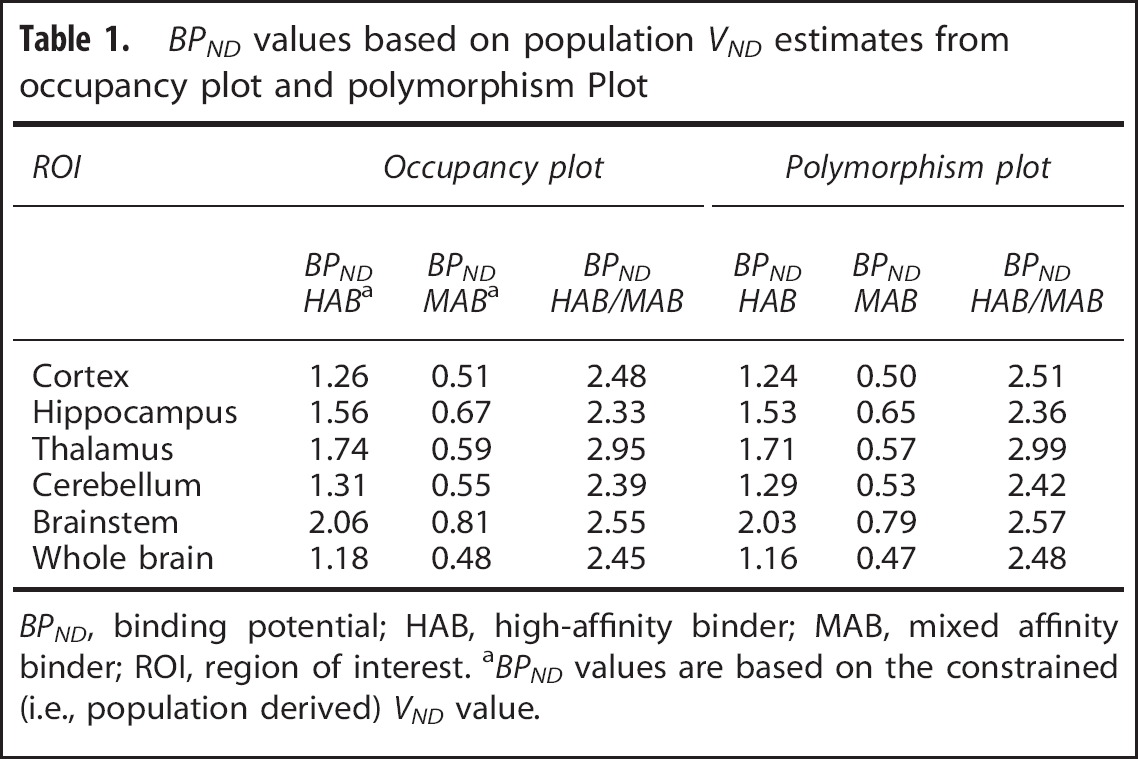
BPND, binding potential; HAB, high-affinity binder; MAB, mixed affinity binder; ROI, region of interest. aBPND values are based on the constrained (i.e., population derived) VND value.
All subjects were genotyped for the rs6971 polymorphism using a Taqman SNP Genotyping Assay, and received a high-resolution T1 magnetic resonance imaging scan in a Siemens Tim Trio 3T scanner (Siemens Healthcare, Erlangen, Germany) followed by a [ 11 C]PBR28 PET scan in a Siemens Biograph 6 PET-CT with Truepoint gantry. Six HAB subjects received an oral dose of XBD173 (10 to 90 mg), followed 2hours later by a repeat [ 11 C]PBR28 scan.
All structural magnetic resonance images were inspected by a neuroradiologist for unexpected findings of clinical significance, or features that might confound PET co-registration or quantitative analysis.
XBD173
XBD173 is a selective TSPO agonist developed for the treatment of generalized anxiety (9). It binds TSPO with nanomolar affinity, and saturates the [ 3 H]-PBR28 binding site (unpublished data). In a recent study using a human model of panic (induced by a cholecystokinin-tetrapeptide challenge (CCK4)), a dose of 90 mg produced clinically meaningful pharmacodynamic effects. Peak concentrations were achieved within 2.5 hours of oral administration, and the number of side effects reported was comparable with the incidence in the placebo group, with no serious adverse events. 9 For the current study, XBD173 was purchased from Pharmasynth, Estonia. In our study, XBD173 was well tolerated, and no drug-related adverse events were observed.
Preparation of [ 11 C]PBR28
Radiopharmaceutical preparation. Cyclotron produced [ 11 C]CO2 was converted to [ 11 C]methyl iodide using a GE Microlab system (GE, Uppsala, Sweden). The [ 11 C]methyl iodide was subsequently passed through a solution containing 1 mg of desmethyl-PBR28 in 350 μL DMF, and 0.5 M tetrabutyl ammonium hydroxide in methanol (4 μL) as base. The reaction mixture was heated to 120°C for 5 minutes, allowed to cool and diluted with high-performance liquid chromatography (HPLC) solvent (ammonium formate 10 mmol/L: acetonitrile 57/43 (v/v), 8 mL/minute) prior to injection onto an Agilent Eclipse XDB-C18 HPLC column (5 μm, 250 × 9.4 mm, Agilent, Santa Clara, CA, USA). The fraction containing [ 11 C]PBR28 was collected into a vessel containing 20 mL water for injection before trapping onto a solid-phase cartridge (C18 Classic SepPak, Waters, Milford, MA, USA). The cartridge was washed with water for injection and [ 11 C]PBR28 was eluted using ethanol (1 mL) followed by saline for injection (9 mL) through a 0.2 μm sterile filter (Pall Acrodisc, Sterile, 33 mm, 0.22 μm, Pall, Port Washington, NY, USA) into a sterile vial (Adelphi, Manchester, UK).
Quality control. Final product was tested using validated procedures in accordance with good manufacturing practices for the following: visual appearance clear, colorless and practically free from particles (A), pH between 4.5 and 8.5 (A), total endotoxins <175EU/dose (A), PBR28 mass ≤10 μg per dose (3.43 ± 1.69 μg), desmethyl-PBR28 <1 μg per dose, total unknown chemical impurities ≤12 μg per dose (A), radiochemical purity >95% (A), radiochemical identity co-elution with cold PBR28 (A), isotopic half-life within 10% of expected value (A), filter integrity pass (A), isotopic purity (no additional gamma peaks in a fully decayed sample), (P), residual solvents within limits set by International Conference on Harmonization Q3C R4 (P) and sterility confirmed (P). (A) indicates tests performed as part of the release process, (P) indicates tests performed as part of the post release processes. All batches used for this study successfully passed the specifications listed above.
Analysis of [ 11 C]PBR28 plasma metabolism. [ 11 C]PBR28 parent fraction over the course of the PET scan was determined using the ‘Hilton method’. 17 Briefly, urea was added to the plasma samples to give an 8 mol/L concentration to break up plasma-protein binding. The sample was diluted 1: 1 with 0.1 mol/L unbuffered Tris and filtered through a 0.45 μm polyvinyl-idene fluoride syringe filter (Waters Acrodisc LC 13 mm Minispike and 25 mm, Waters, USA) before injection onto the dual HPLC system. System 1 operated as trapping system where parent and non-polar metabolites were collected on a Biotrap 500 MS (ChromTech, Cedex, France) sample enriching column using 5% acetonitrile in 0.1 mol/L unbuffered Tris as solvent at a flow rate of 2 mL/minute. Following trapping, the Biotrap column was switched in line with HPLC system two. Parent and non-polar metabolites were eluted using a gradient method (0 to 4 minutes 5% acetonitrile: 95% unbuffered Tris, 4 to 10 minutes 5% acetonitrile → 95% acetonitrile) and separated using an Agilent Zorbax Eclipse XDB-C18 column (5 μm, 150 × 4.6 mm, Agilent). A total of 30 fractions were collected and activity measured in a Perkin Elmer 1470 10-well automated gamma counter (Perkin Elmer, Turku, Finland).
Positron Emission Tomography Data Acquisition
[ 11 C]PBR28 was injected as an intravenous bolus over ~20 seconds at the start of a 90-minute 3D-mode dynamic PET acquisition. Injected activities ranged from 292.21 to 356.69 MBq (333.04 ± 15.50 MBq, n = 26). Positron emission tomography data were reconstructed using filtered back projection with corrections for attenuation and scatter (based on a low-dose CT acquisition). Dynamic data were binned into 26 frames (durations: 8 × 15 seconds, 3 × 1 minutes, 5 × 2 minutes, 5 × 5 minutes, 5 × 10 minutes). Arterial blood samples were collected from the radial artery to enable generation of an arterial plasma input function. A continuous sampling system (ABSS Allogg, Mariefred, Sweden) was used to measure whole blood activity each second for the first 15 minutes of each scan. Discrete blood samples were manually withdrawn at 5,10, 15, 20, 25, 30, 40, 50, 60, 70, 80, and 90 minutes after scan start to facilitate measurement of whole blood and plasma activity. Samples taken at 5, 10, 20, 30, 50, 70, and 90-minute time points were also analyzed using HPLC to determine the fraction of parent radioactivity in arterial plasma. The procedure used to generate the metabolite corrected plasma input function has been described previously. 10 In brief, the total plasma curve was generated by multiplying the whole blood curve by plasma-over-blood ratio, and the parent fraction data were fitted to a sigmoid model:
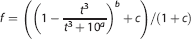
where t is time and a, b, and c are fitted parameters. The resulting fitted parent fraction profile was multiplied by the total plasma curve and then smoothed post peak using a tri-exponential fit to derive the required parent plasma input function. A time delay correction was performed for each scan to account for any temporal delay between blood sample measurement and the tomographic measurements of the tissue data.
Image Analysis
Motion in the dynamic PET data was corrected via frame-to-frame image registration of the non-attenuation corrected PET image to individual's structural T1 magnetic resonance image using SPM5 (Wellcome Trust Center for Neuroimaging, http://www.fil.ion.ucl.ac.uk/spm) with a mutual information cost function. The CIC neuroanatomical atlas 18 was nonlinearly deformed into the individual's space, via T1 magnetic resonance imaging data mapping, to obtain a personalized anatomical panellation of ROIs. Attention focused on regions of different levels of binding 10 are as follows: frontal, occipital, parietal, temporal, and cingulate cortex, hippocampus, thalamus, striatum, putamen, cerebellum, brainstem, midbrain, and pons. Cortical gray matter, whole gray and white matter as well as the whole brain were also included in the region of interest (ROI) analysis. Each ROI was then applied to the dynamic PET data to derive regional time-activity curves. The same ROI set was used for both occupancy and polymorphism plots.
Kinetic Analysis
A two-tissue compartment model, utilizing the metabolite corrected plasma input function, has been shown previously to be a suitable model and was applied to the dynamic PET data using a fixed blood volume correction of 5%. 19 For each ROI examined, the V T was estimated from the rate constants as described previously. 20 Model fitting and parameter estimation was performed using software implemented in Matlab R2008b (The MathWorks, Natick, MA, USA).
Quantification of the Non-Displaceable Component
Occupancy plot. Regional V T data for subjects who underwent both baseline and post-XBD173 scans were fitted to the occupancy plot. 21 The occupancy plot assumes that VND of the radioligand is unchanged by the administration of the blocking drug, and that the fractional occupancy of the target by the blocking drug is the same across all ROI. With these assumptions, it follows that:

Hence, the plot of VTBaseline − VTBlock versus VTBaseline, provides a measure of both target occupancy (the slope) and the VND (the x-intercept). We calculated VND values individually for each subject, and also at a group level, by constraining the VND to be equal in all subjects. We used the constrained VND estimate to calculate the BPND in all 26 subjects, assuming the VND is the same in HABs and MABs. The ED50 of XBD173 was estimated using the occupancies derived without the constraint on VND.
Polymorphism plot. The polymorphism plot 10 enables the estimation of VND by modeling the difference in the HAB and MAB signals across regions of differing target density and is derived from similar principles concerning occupancy studies. 16 This method assumes that the target density is the same for subjects within each genetic group, that the relative regional density is preserved across genetic groups, and VND is the same for all subjects. These assumptions lead to the following equation,
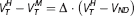
where
RESULTS
Effect of Genotype on the In Vivo Binding Signal
VT in HABs was significantly higher than VT in MABs in all ROI examined (Figure 1). Overall, whole-brain VT in HAB (4.33 ± 0.29, n = 16) was ~1.5-fold higher than VT in MABs (2.94 ± 0.31, n = 10), P≤ 0.005).
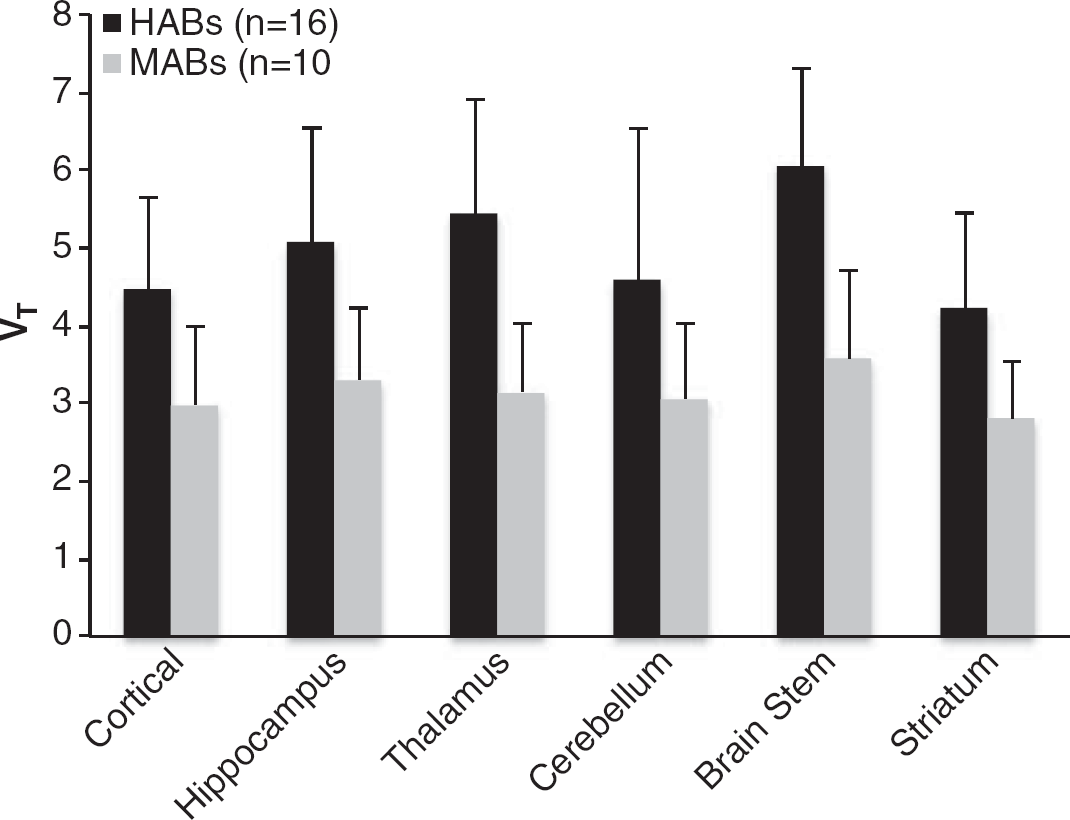
Effect of genotype on 11 C-PBR28 total volume of distribution in high-affinity binders (HABs) (n = 16) and mixed affinity binders (MABs) (n = 10).
Estimation of Non-Displaceable Volume of Distribution
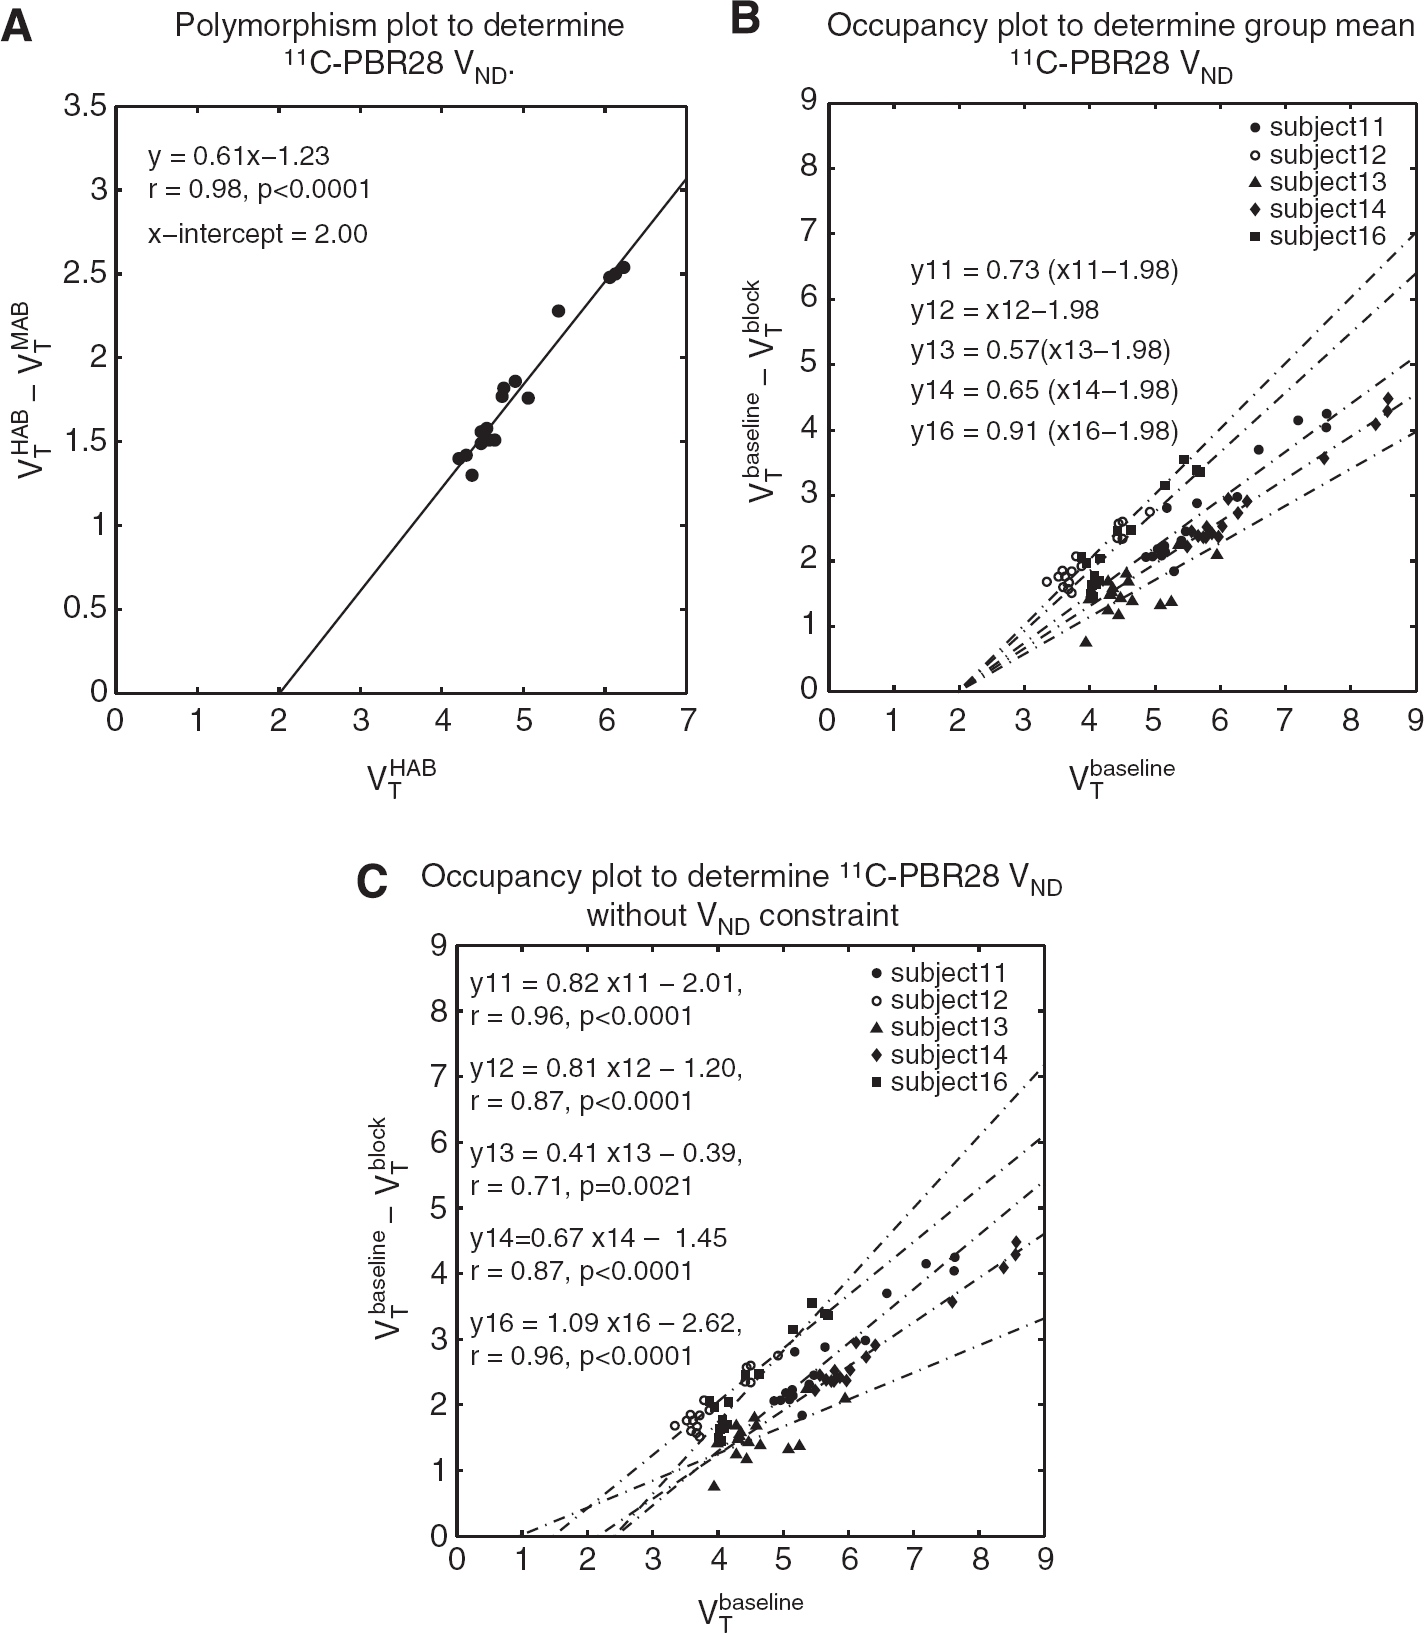
Five out of six subjects displayed a measurable occupancy of the TSPO following blockade with XBD173. For these five subjects, individual VND values were estimated to be the following: 2.45 (95% confidence interval (Cl) 1.70, 2.96), 1.48 (95% Cl 0.75, 1.94), 0.95 (95% Cl -8.16, 2.50), 2.16 (95% Cl 1.70, 2.54), and 2.40 (95% Cl 1.90, 2.76), with a group average of 1.89 (95% Cl 1.32, 2.46).
Constraining the VND to be equal for all healthy volunteers, the population VND was estimated to be 1.98 (95% Cl 1.69 2.26). The polymorphism plot provided a population VND estimate of 2.00 (95% Cl 1.57, 2.35), see Figures 2–4.
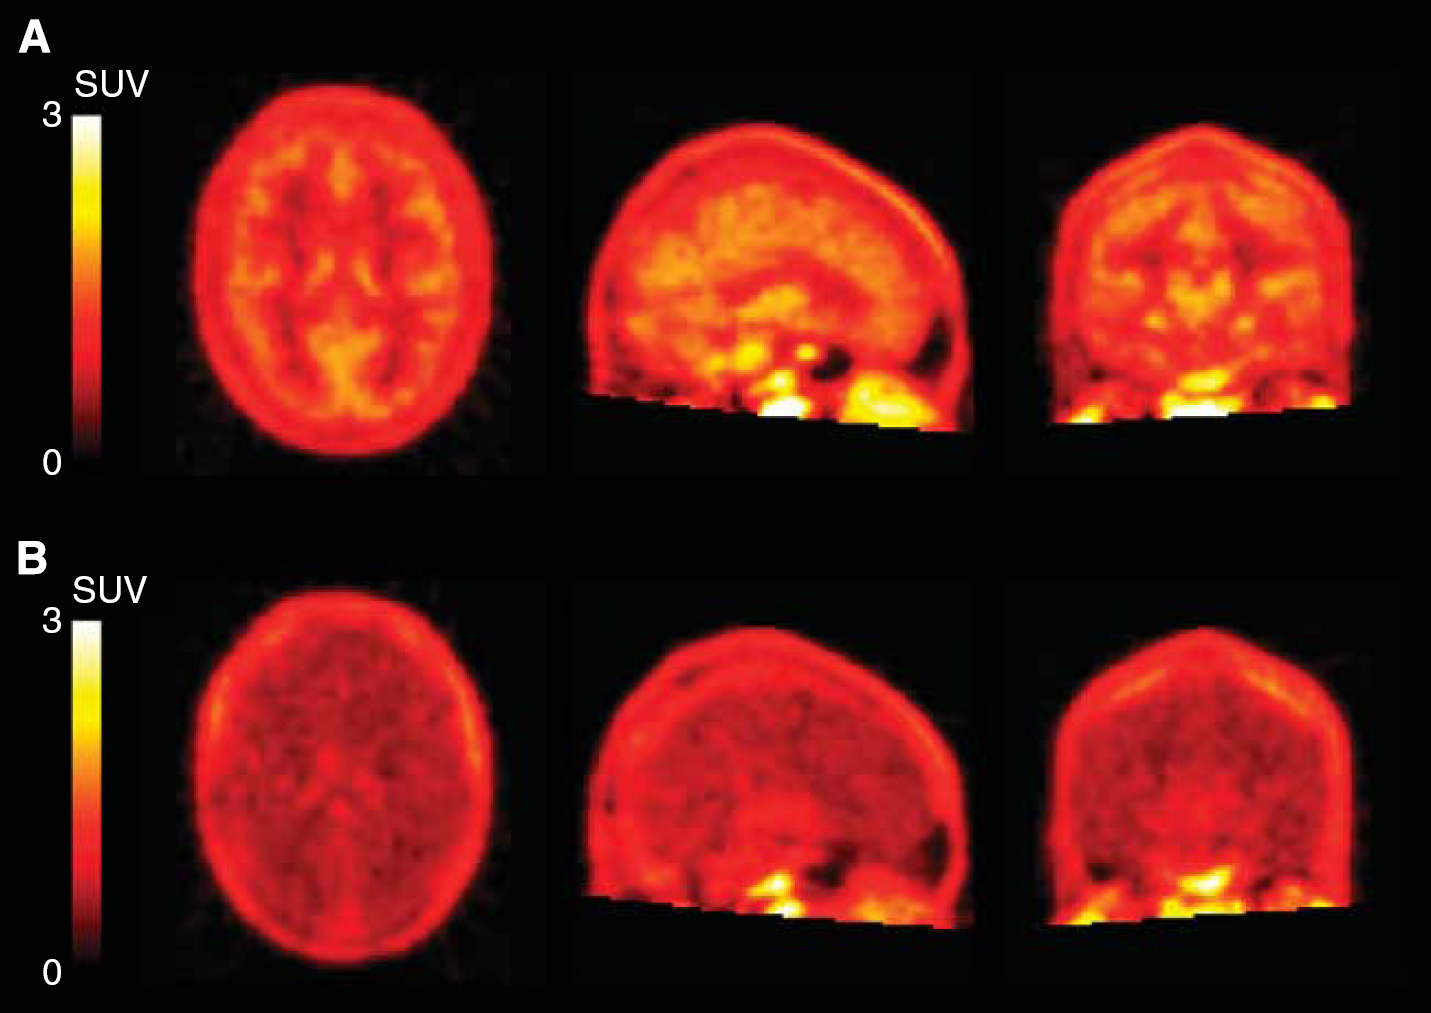
Integral images (0 to 90 minutes) of [
11
C]PBR28 in a high-affinity binders (subject 11) before and after blockade. (
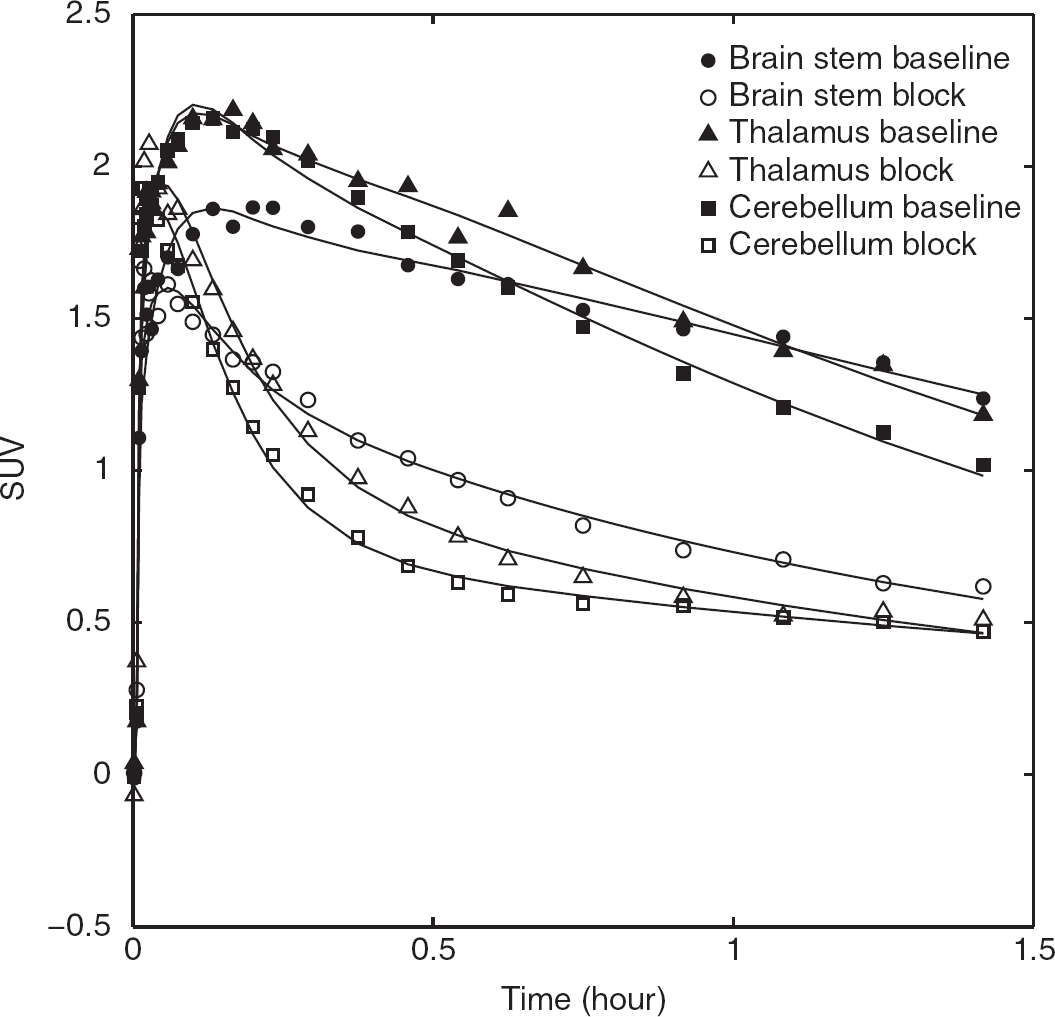
Time-activity curves of [ 11 C]PBR28 in a high-affinity binders (subject 11) before and after blockade 90 mg XBD713 in brainstem, thalamus, and cerebellum.
(
Determination of BPND
Based on the constrained population VND derived from the occupancy plot, BPND was higher in HABs compared with MABs in all ROIs. Whole-brain BPND in HABs (1.18 ± 0.15) was significantly higher than BPND in MABs (0.48 ± 0.15, P<0.005). The ratio of BPND in HABs/MABs was 2.45 (95% Cl 1.10, 3.80).
Based on the population VND derived from the polymorphism plot, BPND was higher in HABs compared with MABs in all ROIs. Whole-brain BPND in HABs (1.16 ± 0.14) was significantly higher than BPND in MABs (0.47 ± 0.15), P<0.005, Table 1). The ratio of BPND in HABs/MABs was 2.48 (95% Cl 1.10, 3.84).
Occupancy of XBD173
We estimated the ED50 of XBD173 in HABs, using the individual subject data obtained from the occupancy plot, to be 0.34 ± 0.13 mg/kg (Akaike Information Criterion = –19.05) (Figure 5). One of the six subjects did not demonstrate any measurable occupancy of the TSPO. This subject, who received the lowest dose (10 mg) of XBD173, would have been expected to have an occupancy value of ~25% based on the data from the other subjects. Excluding this subject from the analysis changes the estimated ED50 to 0.26 ± 0.09 mg/kg.
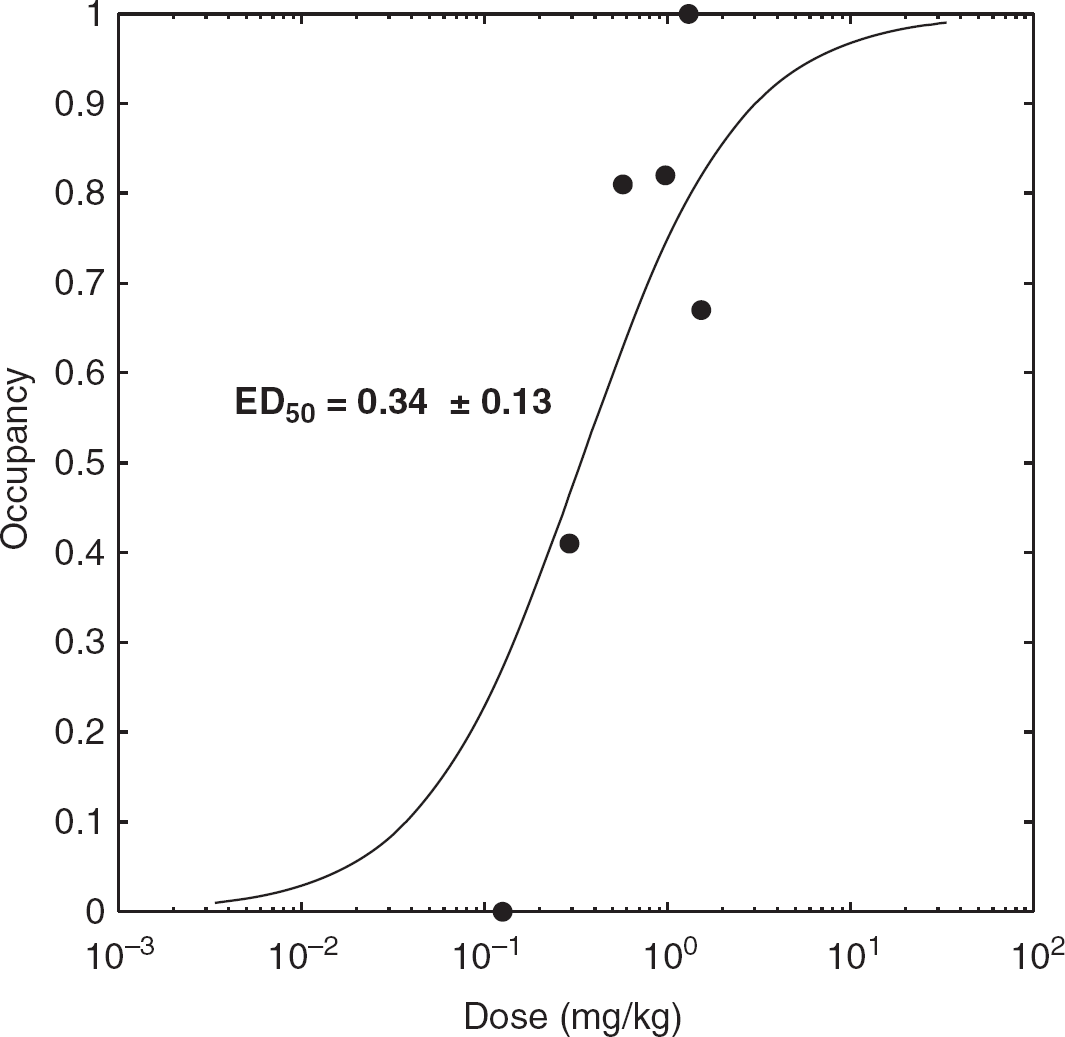
Dose translocator protein-occupancy curve for single oral administration of XBD173 (10 to 90 mg), based on each individual occupancy plot.
DISCUSSION
BPND is preferable to the VT as an outcome parameter, as it provides a direct estimate of specific binding. While the second-generation ligands represent an advance over [ 11 C]PK11195 in providing a higher signal-to-noise ratio, and the facility to estimate robust VT, to date the inability to estimate directly the specific TSPO component has hampered investigations of the role of TSPO in health and disease. The determination of specific binding (BPND in this case) requires the ability to estimate the non-displaceable binding component (VND). The standard methods for determining VND involve either the use of a reference region, or the use of pharmacological blockade to remove the specific binding component. These approaches have not been suitable for TSPO ligands to date, because TSPO is expressed throughout the brain (confounding a reference region approach) and until recently no TSPO ligands were available to enable their use in human studies in pharmacological doses.
We used XBD173, a TSPO ligand, to block the specific binding signal of [ 11 C]-PBR28 in six HAB subjects in order to estimate VND. We calculated the mean VND estimated from each of the individual six subjects, and also calculated a population estimate by constraining VND to a single value. Furthermore, we used the polymorphism plot (incorporating 16 HAB and 10 MAB subjects) to calculate an independent population estimate of VND. All three estimates produced very similar population VND estimates, ranging from 1.89 to 2.00, with similar confidence intervals.
Application of these population VND estimates to calculate BPND in the 26 subjects confirmed a sizable specific signal in healthy human brain (BPND ~1.2 in HABs and ~0.5 in MABs). Our data indicates a HAB/MAB BPND ratio of ~2.5, derived from both the blocking data and the polymorphism plot. This estimate is consistent with in vitro prediction of ~2.0, 7 given the confidence intervals on these data. This in vitro prediction is based on the two assumptions (1) MABs express equal amounts of the HAB and LAB sites, and (2) LAB sites contribute negligibly to the 11 C-PBR28 signal compared with the contribution from the HAB site.
Our data confirms that in healthy subjects a substantial component of the 11 C-PBR28 VT represents specific binding. This is consistent with autoradiography findings showing specific 3 H-PK11195 signal throughout the healthy brain. 15 The impact of these findings on the pseudo-reference tissue approaches in use for modeling the first-generation ligand 11 C-PK11195 22 would depend on the magnitude of the BPND for 11 C-PK11195 in the healthy brain. Such approaches assume that in the healthy brain, the BPND for 11 C-PK11195 is small and hence pseudo-reference tissue approaches lead to only minimal bias; however, this has not been tested in vivo to date. The availability of XBD173 allows the testing of such an assumption, and thus, the evaluation of the magnitude of the bias inherent in such approaches.
Based on the data acquired in our study, the use of individual VND estimates requires further consideration. The individual VND estimates obtained for our subjects ranged between ~1 and ~2.5. From this data alone it is not possible to ascertain whether the inter-subject variability represents true biological variability or is simply a consequence of the increased noise obtained from unconstrained fits. A test-retest study involving four scans per subject (tracer alone, tracer + XBD173 both repeated on separate occasions) would help address this question. Further data are therefore required to determine if it is plausible to use XBD173 blockade to provide individual VND estimates with a two-scan approach (tracer alone, tracer + XBD173). This would protect against differences in VND across subjects but would increase the number of scans required. If such an approach is not plausible, population estimates for VND as derived here could be used to enable estimation of BPND.
Although most of our subjects in the XBD173 sub-study showed occupancy of the drug, one subject appeared to show no detectable binding. This subject was treated with the lowest dose (10 mg), but even at this low dose, we would have expected ~25% occupancy and a detectable reduction in VT. As we did not measure the plasma concentration of XBD173, we cannot verify whether this subject has unusual pharmacokinetics, or whether the lack of expected reduction in VT is due to experimental noise.
Our study has two caveats. First, our estimate of VND from the blocking data set was obtained in a relatively small sample of healthy volunteers. Second, in order to calculate BPND in MABs with the VND estimate from the blockade data, we also assumed that VND is consistent across binding affinity groups. We believe this is a reasonable assumption, based on the notion that the single amino-acid substitution in TSPO responsible for binding affinity differences is unlikely to affect the 11 C-PBR28 non-specific binding, or the free radioligand concentration. Our assumption is consistent with in vitro data showing that non-specific binding with 3 H-PBR28 does not differ across binding affinity class. 23
Using blockade with XBD173 and the polymorphism plot, which rely on different assumptions, we estimated a consistent 11 C-PBR28 VND and found that there is a substantial TSPO-specific binding component in the healthy human brain. Blockade with XBD173 provides a practical means of estimating population-based VND and therefore BPND, in future patient populations. Further work is required to ascertain whether this approach can provide accurate individual VND estimates, and to investigate the impact of disease states on VND.
Footnotes
The authors declare no conflict of interest.
ACKNOWLEDGMENTS
The authors would like to acknowledge Awet Tewolde, Michelle Cunneen, James Anscombe, and Graham Searle for excellent support in data collection and analysis.