
Abstract
Substantial efforts are being spent on postmortem mRNA transcription mapping on the assumption that in vivo protein distribution can be predicted from such data. We tested this assumption by comparing mRNA transcription maps from the Allen Human Brain Atlas with reference protein concentration maps acquired with positron emission tomography (PET) in two representative systems of neurotransmission (opioid and serotoninergic). We found a tight correlation between mRNA expression and specific binding with 5-HT1A receptors measured with PET, but for opioid receptors, the correlation was weak. The discrepancy can be explained by differences in expression regulation between the two systems: transcriptional mechanisms dominate the regulation in the serotoninergic system, whereas in the opioid system proteins are further modulated after transcription. We conclude that mRNA information can be exploited for systems where translational mechanisms predominantly regulate expression. Where posttranscriptional mechanisms are important, mRNA data have to be interpreted with caution. The methodology developed here can be used for probing assumptions about the relationship of mRNA and protein in multiple neurotransmission systems.
INTRODUCTION
Technological progress in genetics, in particular genomic sequencing and high-throughput screening, has led from single-gene mRNA studies to genomewide transcriptional analyses within a few years. This development has culminated in DNA microarrays that enable high-density spatial mapping of mRNA transcript distributions within tissues. The promise is that such genomic mapping will yield insights into the relationship between structure and function in the human brain.1–6
This promise is contingent on the truth in the key assumption of genomic brain mapping: that mRNA expression predicts protein expression. The correlation of mRNA and protein expression has been explored in a limited number of studies in yeast or human tissues, with contradictory results.7–13 Guo et al 14 performed the most comprehensive study in normal human cells demonstrating a significant global correlation between mRNA expression and protein levels in circulating monocytes. The correlation strength varied among genes depending on their function and was stronger (R2>0.2) for genes related to cellular structure and lower (R2<0.2) or negligible for those related to cell development and the regulation of cellular function. 14
A second key question concerns the wider applicability of existing genomic maps. There is currently scant evidence regarding the accuracy with which high spatial frequency mRNA mappings extracted from postmortem brains can predict in vivo protein levels in unrelated cohorts. This determines the impact of future research and clinical applications—for example, whether genomic maps will support drug testing on a cohort level, or even support diagnosis and prognostication in individual patients.
Possible explanations for the inconsistency of correlations reported in the literature between mRNA and protein concentrations can be found in the biologic as well as the in technological domain. An example of the former, posttranscriptional mechanisms (e.g., transcriptional and posttranscriptional splicing, translational modifications, and protein complex formations) influence the degree to which mRNA expression results in protein expression. Another is metabolization—proteins may differ substantially in their in vivo half-lives. Microarray measurements can be affected by sample RNA integrity. 15 Limitations in postmortem tissue availability and quality may further hamper the predictive power of genomic brain maps for in vivo protein measurements in unrelated cohorts.
We aimed to address these questions by comparing mRNA expression maps with in vivo protein density brain maps measured in normal cohorts with positron emission tomography (PET).
MATERIALS AND METHODS
Positron emission tomography is an imaging modality that allows the in vivo study of tracer interactions with receptor proteins, using radiolabeled receptor-selective ligands. It provides a characterization of ligand binding sites, achieving accurate measurements of their number and affinity. 16
An anatomically comprehensive atlas of the adult human brain transcriptome was recently made freely available by the Allen Institute for Brain Science. 17 We used the Allen atlas as a source of mRNA transcription maps. We targeted proteins in two receptor systems, the opioid and the serotoninergic. The two systems represent distinct biologic paradigms: they are highly independent of one another, with no overlap in the participating functional proteins and distinct characteristics of the metabolic pathways to which the proteins are subjected.18–20 The opioid system is of particular interest given the extensive and well-studied set of posttranslational events that control the production of mRNA variants and differentially modified proteins from each opioid receptor gene. 21
In contrast, no known posttranslational modifications are documented for serotoninergic receptors, with the exception of the 5-HT2C subtype. 22
We targeted the opioid system with [11C]diprenorphine ([11C]DPN), a nonsubtype selective PET radiotracer that binds to all three opioid receptor subunits (Delta, Mu, and Kappa) with high affinity. It acts as a partial agonist at Delta and Kappa receptors and as an antagonist at the Mu sites. 18 To investigate the serotoninergic system, we targeted the 5-HT1A receptor with two selective ligands, [11C]WAY100635 and [11C]CUMI101, antagonist and agonist at the 5-HT1A site, respectively.
This experimental design allowed us to examine the relationship between mRNA mapping and in vivo measures of protein expression in systems where the theoretical predictive potential would be either very high (e.g., the 5-HT1A receptor) or very low (e.g., Delta, Mu, and Kappa opioid receptors).
Another feature of this design is that it provides further testing of the hypothesis by Guo et al 14 that structural proteins have higher predictability from mRNA levels than proteins that are functionally modulated: [11C]WAY100635 is an antagonist at the 5-HT1A site, and therefore measures the total structural protein density, while the agonist [11C]CUMI101 preferentially binds to receptors in the high affinity state.
mRNA Data Set
Gene expression information was obtained from the downloadable microarray-based Allen Human Brain Atlas (http://www.brain-map.org) (Hawrylycz et al 17 ). The details of the procedures for the tissue collection and processing, the microarray experimental design and execution, and the data quality control up to the integration of the data into the online resource are reported in the Supplementary data of Hawrylycz et al. 17
The data set is derived from six healthy donors (5 males, 1 female, age: 42.5 ± 13.4, range 24 to 57 years). The atlas contains gene expression profiles sampled throughout the brain, where each gene is measured by at least two probes. On average, ˜500 samples were collected for each hemisphere to represent all the brain structures proportionally to their volume. For two out of the six brains, samples were collected from both hemispheres. For the remaining four, tissue samples for microarray analysis were collected from the left cerebral and cerebellar hemispheres and from sites in the brainstem located left of the midline.
From the Allen database, we selected the genes related to the receptors of interest (i.e., Kappa, Mu, and Delta receptors of the opioid system; 5-HT1A receptor of the serotoninergic system). We downloaded the expression values for all the probes available for each gene for the six donors. Note that in the Allen database the number of available probes depends on the selected gene. The expression profiles were downloaded at the highest spatial resolution possible (i.e., each value represented a physical tissue sample). We additionally downloaded the expression profiles of the gene associated with the D2 receptor of the dopaminergic system and of the gene associated with the GABA(A) receptor-associated protein (GABARAP). We expected the associations to be specific, effecting positive correlations between mRNA levels and protein concentrations measured with PET for related systems, and the absence of significant correlations for unrelated systems. The genes had been measured with three probes, except for Delta opioid and GABARAP (two probes) and D2 (five probes). For all the genes and all the probes, mRNA expression was considered in log2 values.
mRNA Data Analysis
The individual mRNA expressions, originally mapped in the native brain MRI space, were spatially normalized to the standard stereotaxic space (MNI/ICBM152) using the transformation matrices available from the Allen Brain Atlas data portal. The maximum probability version of the Hammersmith Brain Atlas provides a segmentation of the Montreal Neurological Institute (MNI) space into 83 anatomical regions.23,24 Groups of small regions were merged to adapt the segmentation to the purpose of simultaneous regional analysis of the mRNA and PET data. For each donor, an average of 13.9 ± 7.0% genomic samples were excluded because they had been sampled from regions that are not labelled in the Hammersmith Brain Atlas.23,24 The distribution of the mRNA samples is reported in Figure 1B of Supplementary Material.
Consistency measures for the opioid system. For each region, the mRNA level of Delta, Kappa, and Mu receptors (Probe 1,
Positron Emission Tomography Data Set Acquisitions
We analyzed three different data sets, [11C]DPN, [11C]WAY100635, and [11C]CUMHOL [11C]diprenorphine has high affinity at Mu, Kappa, and Delta opioid receptors. 18 [11C]WAY100635 and [11C]CUMI101 are a selective serotonin 5-HT1A receptor antagonist and agonist, respectively. For all the studies, ethical approval had been granted by the Hammersmith Hospitals Trust Ethics Committee and permission to administer radioisotopes by the Administration of Radioactive Substances Advisory Committee (ARSAC) of the Department of Health, UK. Informed written consent had been obtained from all patients and healthy volunteers. The studies were conducted according to the Declaration of Helsinki.
All PET data were reconstructed using the filtered backprojection algorithm and then corrected for subject motion. Arterial plasma input functions were obtained and corrected for radiolabeled metabolites in all subjects.
[11C]diprenorphine. Data from previously reported studies 25 of five healthy control subjects (3 males, 2 females, age: 41.1 ± 10.9 years) were used in the current study. Each subject had been scanned twice. The criteria for subject inclusion and the procedure for [11C]DPN PET studies and arterial sampling are described in detail in Hammers et al. 25 All subjects underwent 90-minute dynamic [11C]DPN PET test-retest scans on an ECAT EXACT3D (Siemens/CTI, Knoxville, TN, USA) camera after injection of 185 ± 4 MBq of [11C]DPN.
[11C]WAY100635. Fifteen healthy male subjects (age: 35.7 ± 10.5 years) underwent a 95-minute dynamic PET study in an ECAT EXACT3D (Siemens/CTI) scanner after a bolus injection of 301 ± 12 MBq of [11C]WAY100635. The data were analyzed as previously reported. 19
[11C]CUMI101. Thirteen healthy participants (12 males, 1 female, mean age: 50.919.3 years) underwent a 90-minute dynamic PET scan on a GE Discovery RX PET/CT camera after a bolus injection of 376 ± 7 MBq of [11C]CUMI101. Details on PET procedures and arterial data extraction and processing have been reported earlier. 20
Positron Emission Tomography Data Analysis and Estimation of Specific Binding
For each tracer under study, validated voxelwise methods for the estimation of specific binding were used for generation of the parametric images. Two parameters of interest were considered: the volume of distribution (mL/cm3) and the binding potential (unitless). The volume of distribution is defined as the ratio of the tracer concentration in the tissue to the metabolite-corrected plasma tracer concentration at equilibrium. The binding potential is defined as the product of receptor density with affinity of the ligand for the receptor itself. The two parameters are related: both reflect the in vivo concentration of the receptor target of a given PET ligand. 26
Specifically, we obtained the total distribution volume (VT) parametric maps for [11C]DPN data with H-MAP 27 and for [11C]WAY100635 with spectral analysis. 28 An example of the latter is shown in Figure 1C of Supplementary Material. [11C]CUMI101 data were analyzed using the simplified reference tissue model, 29 and nondisplaceable binding potential (BPND) parametric maps were derived for each subject of the data set. Consistently with the genomic data analysis, regional PET values were derived from the same Hammersmith Maximum Probability atlas.
Data Comparison and Statistical Analysis
Before comparing mRNA levels with PET-specific binding, we performed an auto-correlation analysis, that is, we compared the subjects within each modality data set to estimate consistency. We used this analysis step to obtain an upper-bounds estimate of the correlation values that were to be expected, considering the influence of intrasubject and intersubject variability as well as of limitations of the accuracy of the respective measurements.
Due to the limited number of genomic samples per region, we could not assume normal distribution of the expression data. We therefore employed nonparametric statistics, that is, the median of the gene expression values across subjects in each region was used as the summary measure of regional mRNA expression. Similarly, the median of the specific binding estimates in all voxels composing each region of interest (ROI) in all subjects was taken to represent regional binding. Between-subject variability was evaluated through medians and median absolute deviations.
The procedure for the comparison of the gene expression and the molecular imaging data is summarized in Figure 2 of Supplementary Material.
Consistency measures for the serotonin system. The mRNA level of Probe 1 for the 5-HT1A receptor
Regions of interest with fewer than five mRNA samples were excluded from the analysis: this threshold was chosen as a trade-off between statistical power for the comparison analysis and the need to retain enough regions after selection. In this way, we guaranteed that each selected region was adequately described in term of genomic expression. We tested different values for this constraint (up to 10 samples per region) but this led to the inclusion of only six regions, excluding several cortical ROIs of particular interest for the system under study. With five samples we were instead able to analyze the main cerebral regions, including all the structures of interest.
The consistency of the genomic data was assessed by comparing the intersubject median and median absolute deviation of the regional mRNA expression levels across the subjects for each receptor and each probe. The same procedure was applied for PET-specific binding estimates.
Comparison between mRNA expressions vs. receptor binding measured by PET was performed by correlation analysis, in which each subject of the PET data set was compared with each subject from the genomic data set. We used Spearman's correlation coefficient to quantify the relationship between the variables, and we evaluated the standard error of the correlation coefficient via a bootstrapping approach with 1,000 bootstrap data samples.
RESULTS
Consistency Analysis
In the Allen atlas, gene expression profiles were extracted on average from 419 ± 70 tissue samples for each individual for six individuals in total. The inclusions of the only regions where all donors had at least 5 samples resulted in the definition of a subset of 14 regions with an average of 32 ± 25 samples per ROI. This implied the exclusion of the right hemisphere from the analysis, which had not been sampled in 4/6 subjects in the Allen database. Included regions were hippocampus, parahippocampal gyri, middle and inferior temporal gyrus, cerebellum, thalamus, brainstem, insula, precentral gyrus, superior frontal gyrus, postcentral gyrus, superior parietal gyrus, middle frontal gyrus, posterior temporal lobe, and inferolateral parietal lobe.
Auto-Correlation Analysis for the Opioid System
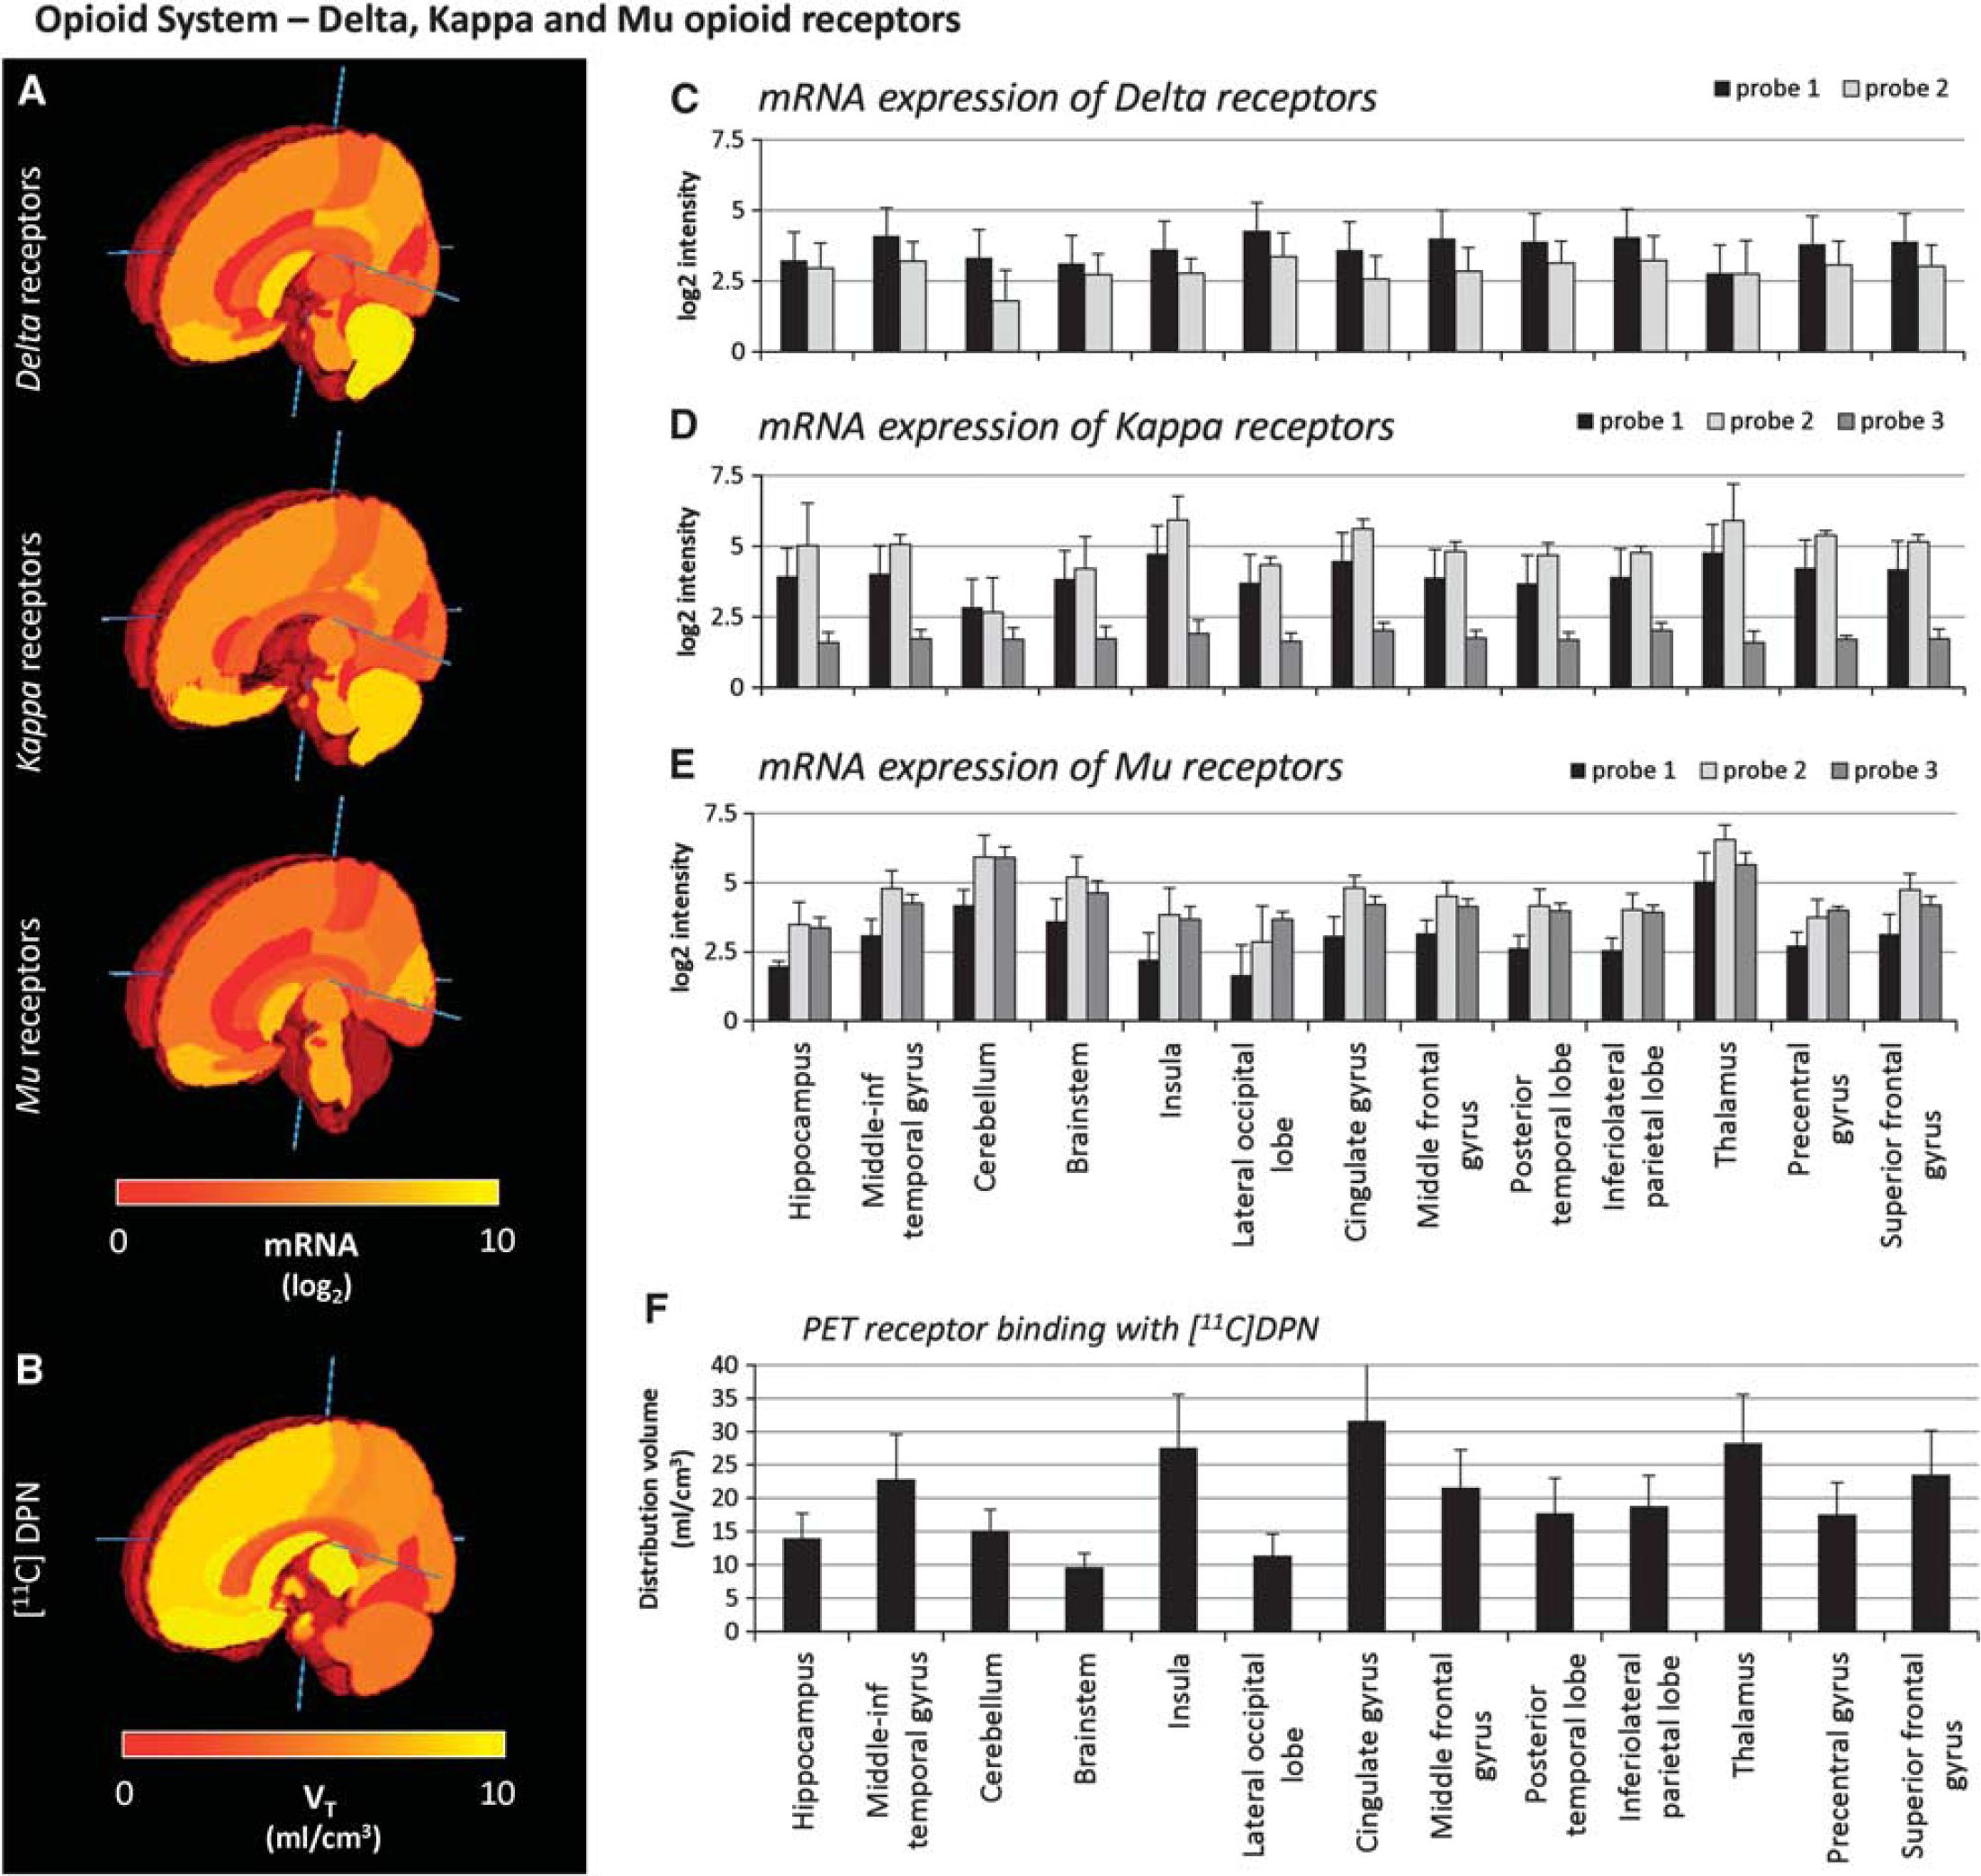
Figure 1 shows the comparison of the intersubject median and absolute deviation of the opioid receptor regional mRNA expression levels (Delta, Kappa, and Mu subunits) for each probe in some representative regions (Figures 1A and 1C to 1E). The medians and median absolute deviation values of the specific binding estimates across subjects for [11C]DPN in the same regions are shown in Figures 1B and 1F.
The intersubject median values of the expression levels were consistent across the probes, and all the probes presented similar intersubject variability (between 12% and 26% depending on the receptor subtype). One of the probes (Probe 3) systematically presented lower mRNA levels (33% to 63%) than the other probes; this finding was consistent for all regions and across Kappa and Mu receptors. We attribute this anomaly to a lack of sensitivity of this specific probe.
The auto-correlation analysis of mRNA expression levels showed high variability depending on the probes and on the receptor subunits considered (Table 1). Mu receptor probes showed the highest correlation across donors (up to ρ2 = 0.685 ± 0.206) for Probe 2). Both Delta receptor probes had low auto-correlation (ρ2 = 0.361 ± 0.182 and ρ2 = 0.331 ± 0.238 for Probes 1 and 2, respectively). The auto-correlation for the Kappa receptor was intermediate (up to ρ2 = 0.505 ± 0.208), with the exception of Probe 3, which we had identified as problematic in the consistency analysis.
Consistency: mRNA expression and PET-specific binding auto-correlation
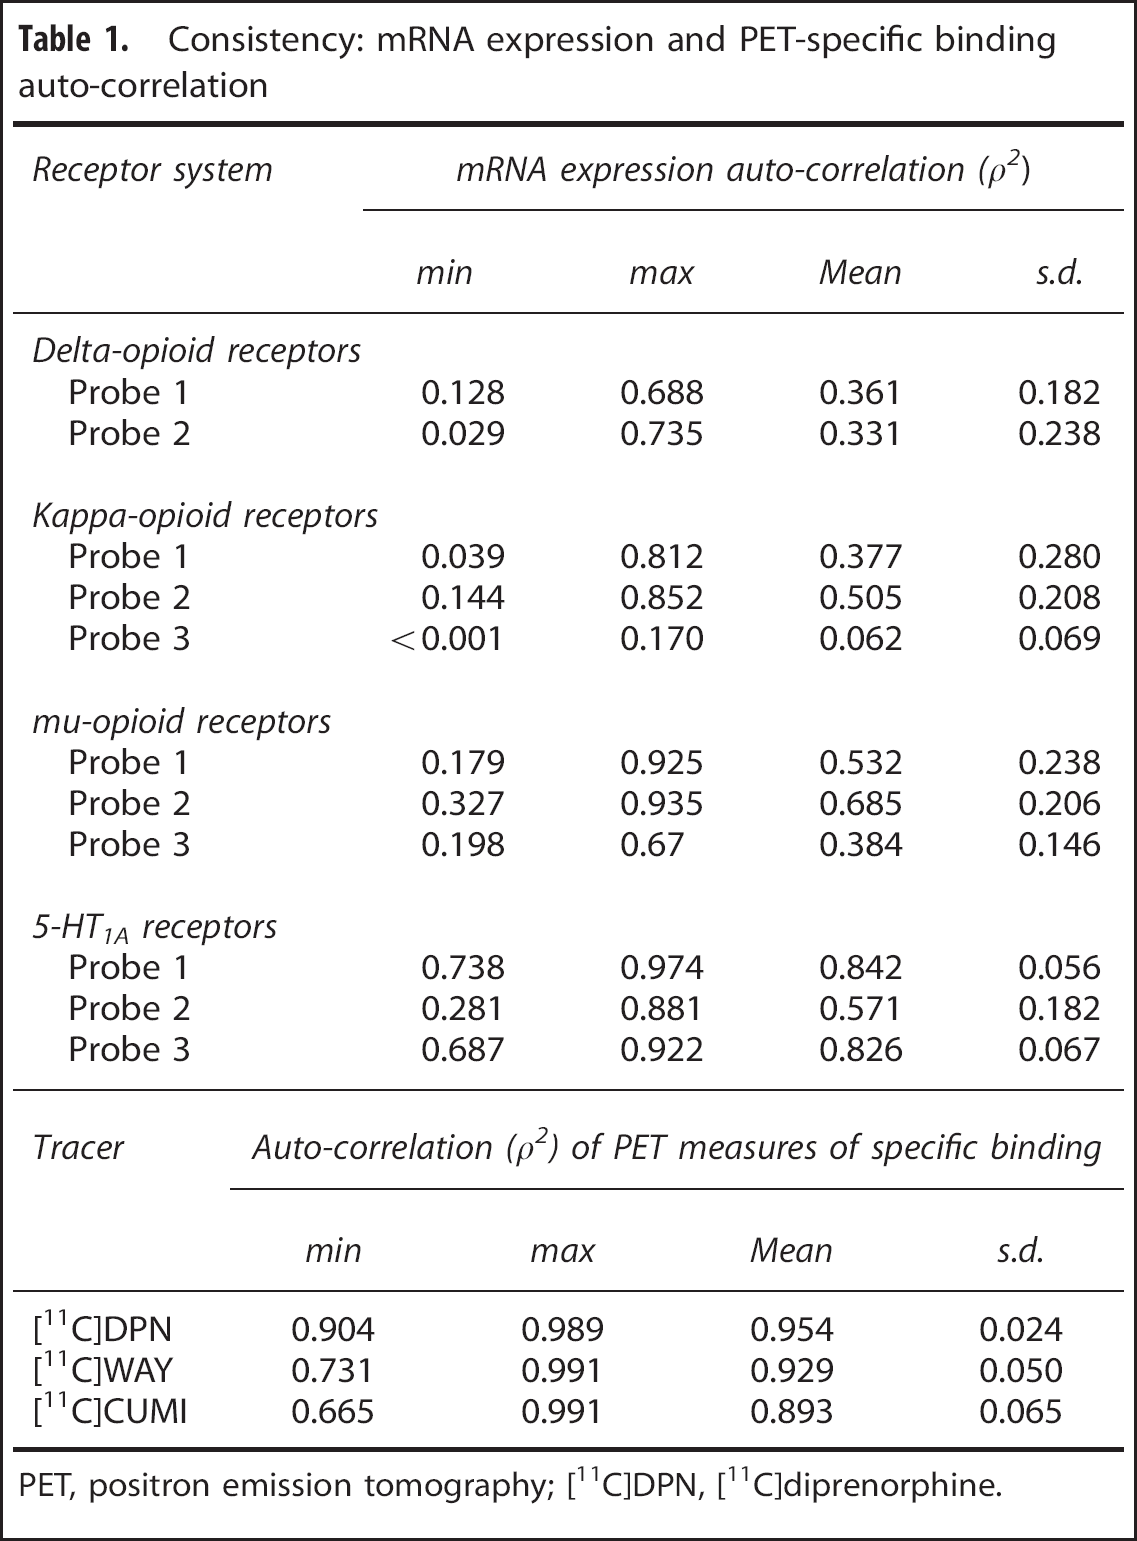
PET, positron emission tomography; [11C]DPN, [11C]diprenorphine.
For the PET data, the auto-correlation of [11C]DPN-specifk binding was very high and consistent across all the subjects (Table 1), on average ρ2 = 0.954 ± 0.024.
Auto-Correlation Analysis for the 5-HT1A System
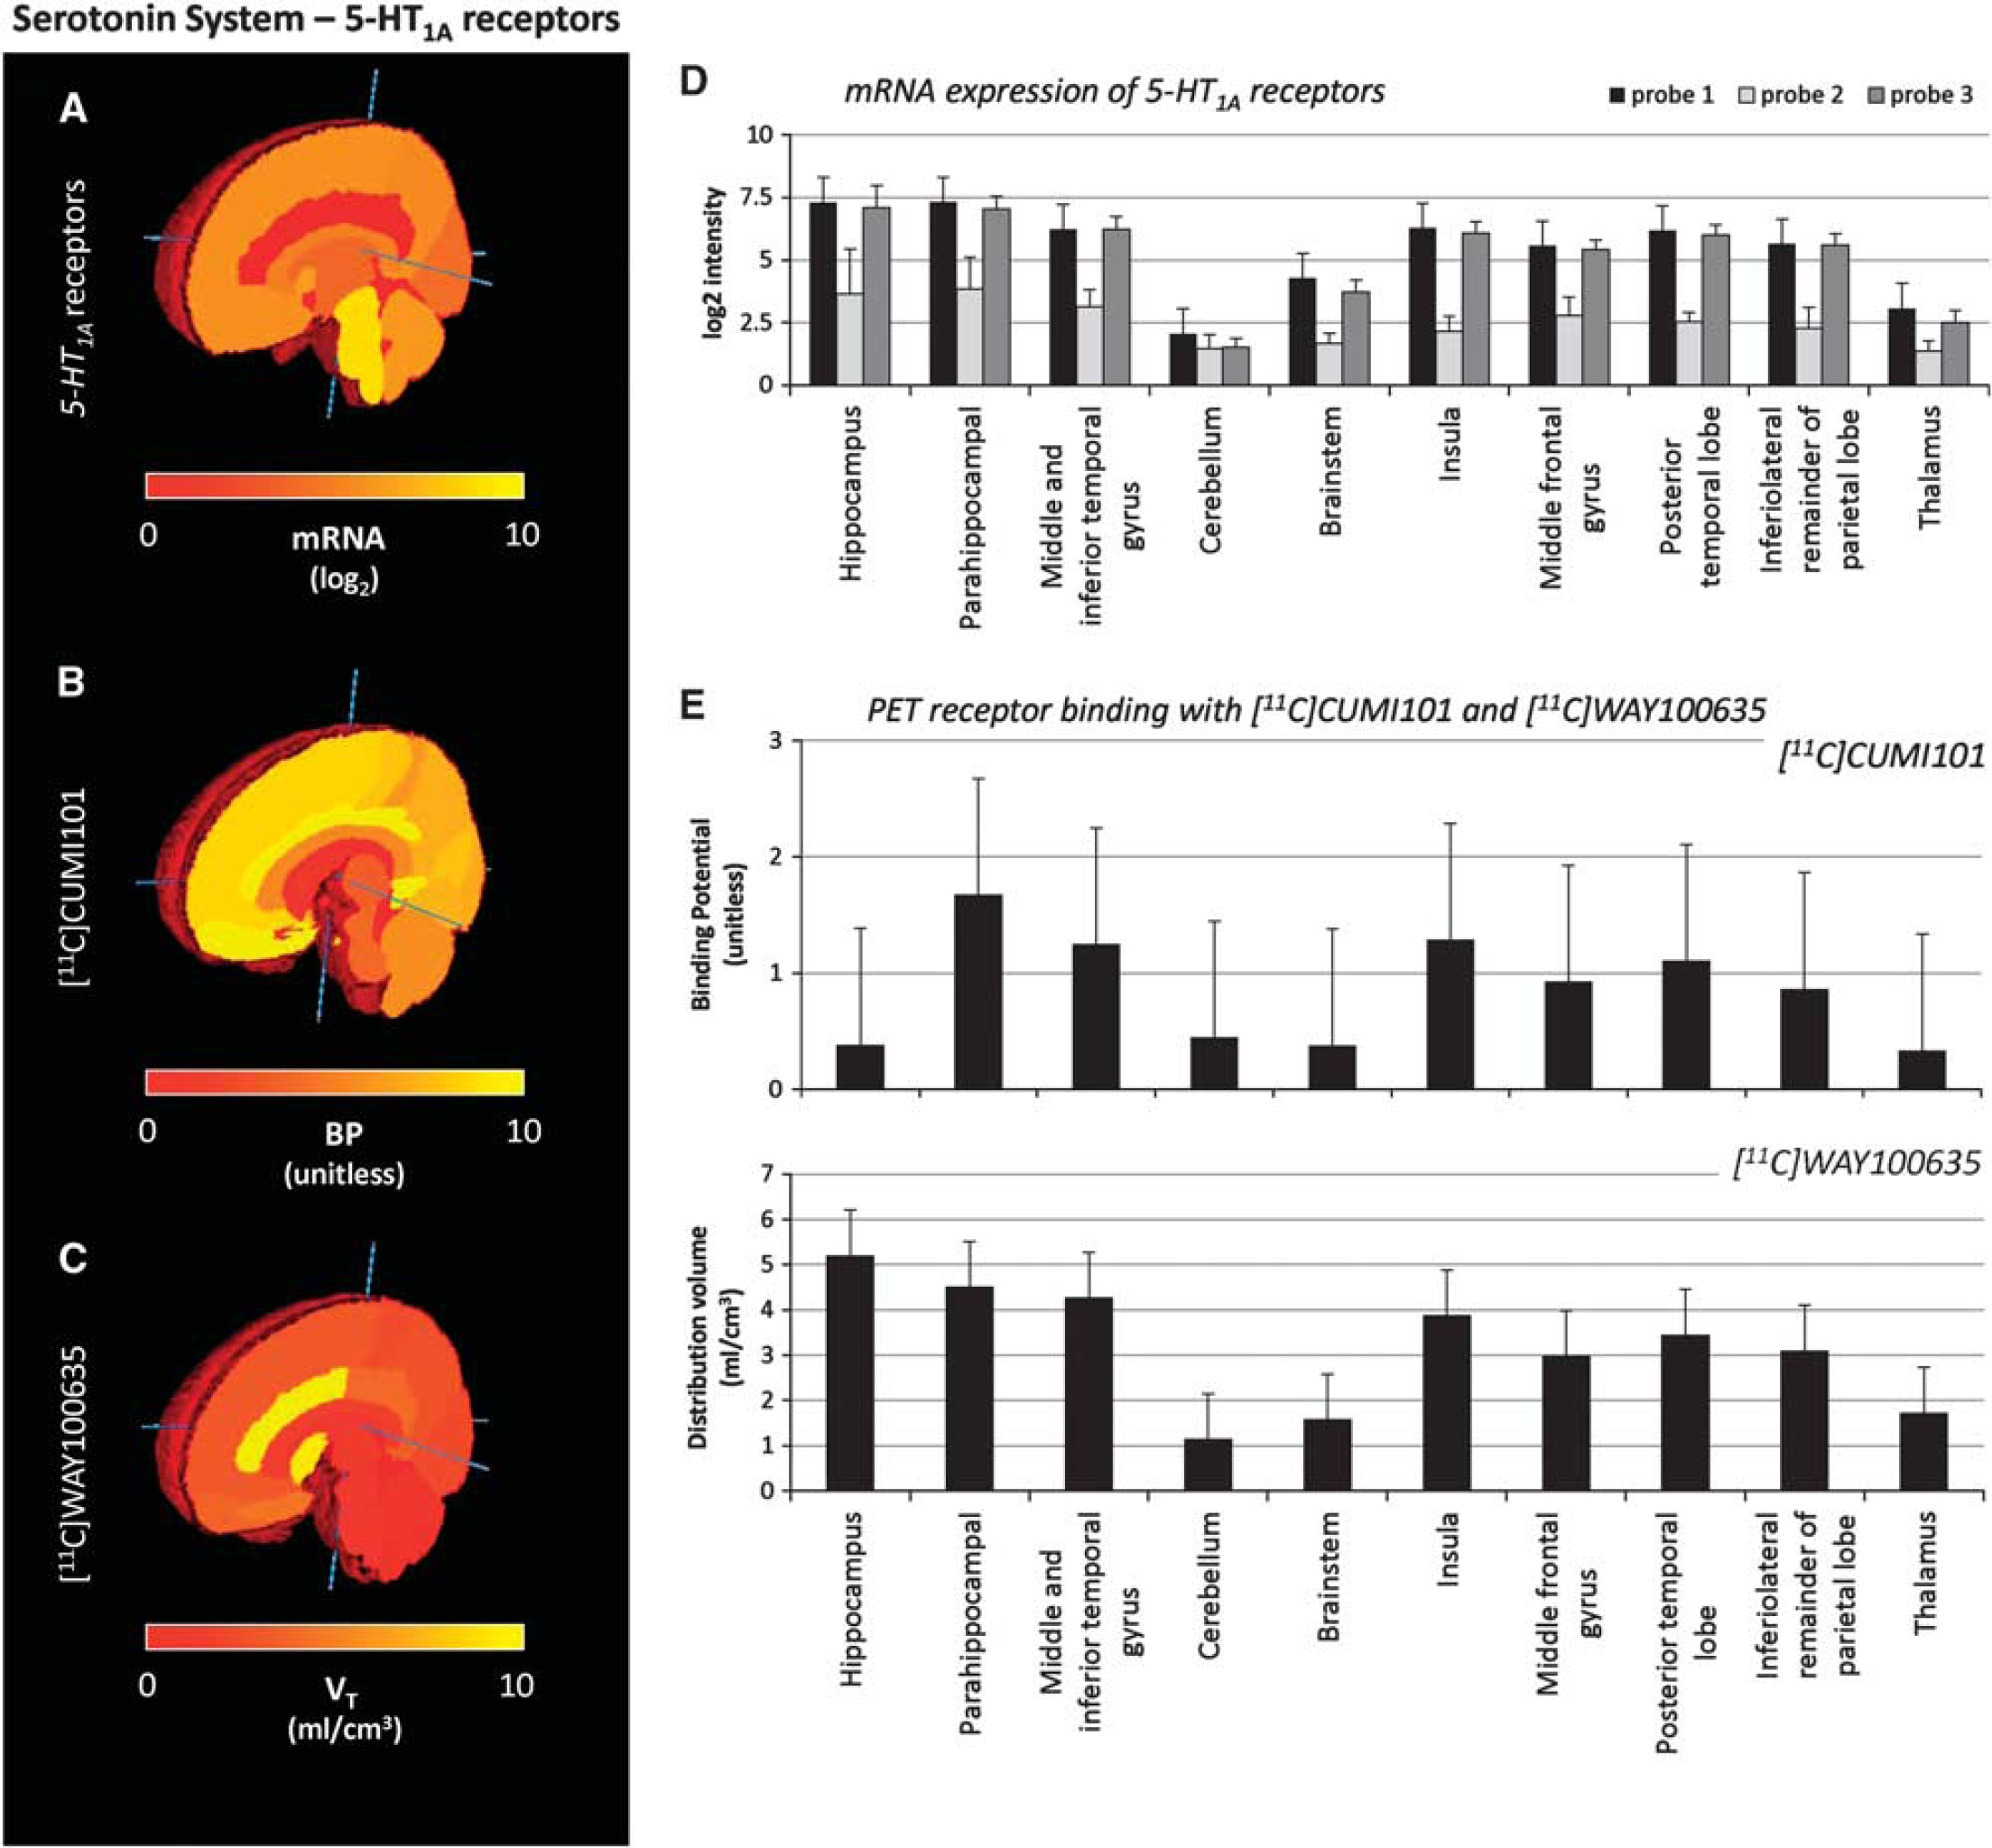
The consistency analysis showed similar results for the serotonin 5-HT1A receptor (Figures 2A and 2D): there were similar expression values for the three probes except for the second one, whose mRNA levels were >50% lower than those of the other probes, again an indication of low sensitivity.
Figures 2B to 2E show the median and absolute deviation values of the specific binding estimates across subjects for PET with [11C]CUMI101 and [11C]WAY100635. The analysis of the between-subject variability of PET measures showed comparable results for all regions in all data sets.
The auto-correlation of mRNA expression profiles for the 5-HT1A receptor was characterized by higher values than the one detected for the opioid system (Table 1). Probe 1 and Probe 3 had the highest correlations with ρ2 = 0.842 and ρ2 = 0.826, respectively.
The auto-correlation of the PET-derived specific binding measures for both serotoninergic tracers was high (Table 1). The auto-correlation for [11C]WAY100635 was somewhat higher across the subjects compared with [11C]CUMI101 (on average ρ2 = 0.929 ± 0.050 and ρ2 = 0.893 ± 0.065, respectively).
Cross-Correlation mRNA vs. In Vivo Protein Density
Opioid system. Both Delta and Mu subunits showed little correlation (Figure 3), with ρ2 = 0.053 ± 0.082 and ρ2 = 0.110 ± 0.058 for the highest-correlation probes. In contrast, cross-correlation values for the Kappa receptor were comparable to the auto-correlation values (Table 2), ranging from ρ2 = 0.108 ± 0.110 (Probe 3) to ρ2 = 0.513 ± 0.121 (Probe 2). The repeatability of the results performed with bootstrap analysis showed high reproducibility for Kappa auto- and cross-correlation with similar standard errors. However, variability for Delta and Mu receptor cross-correlation was high.
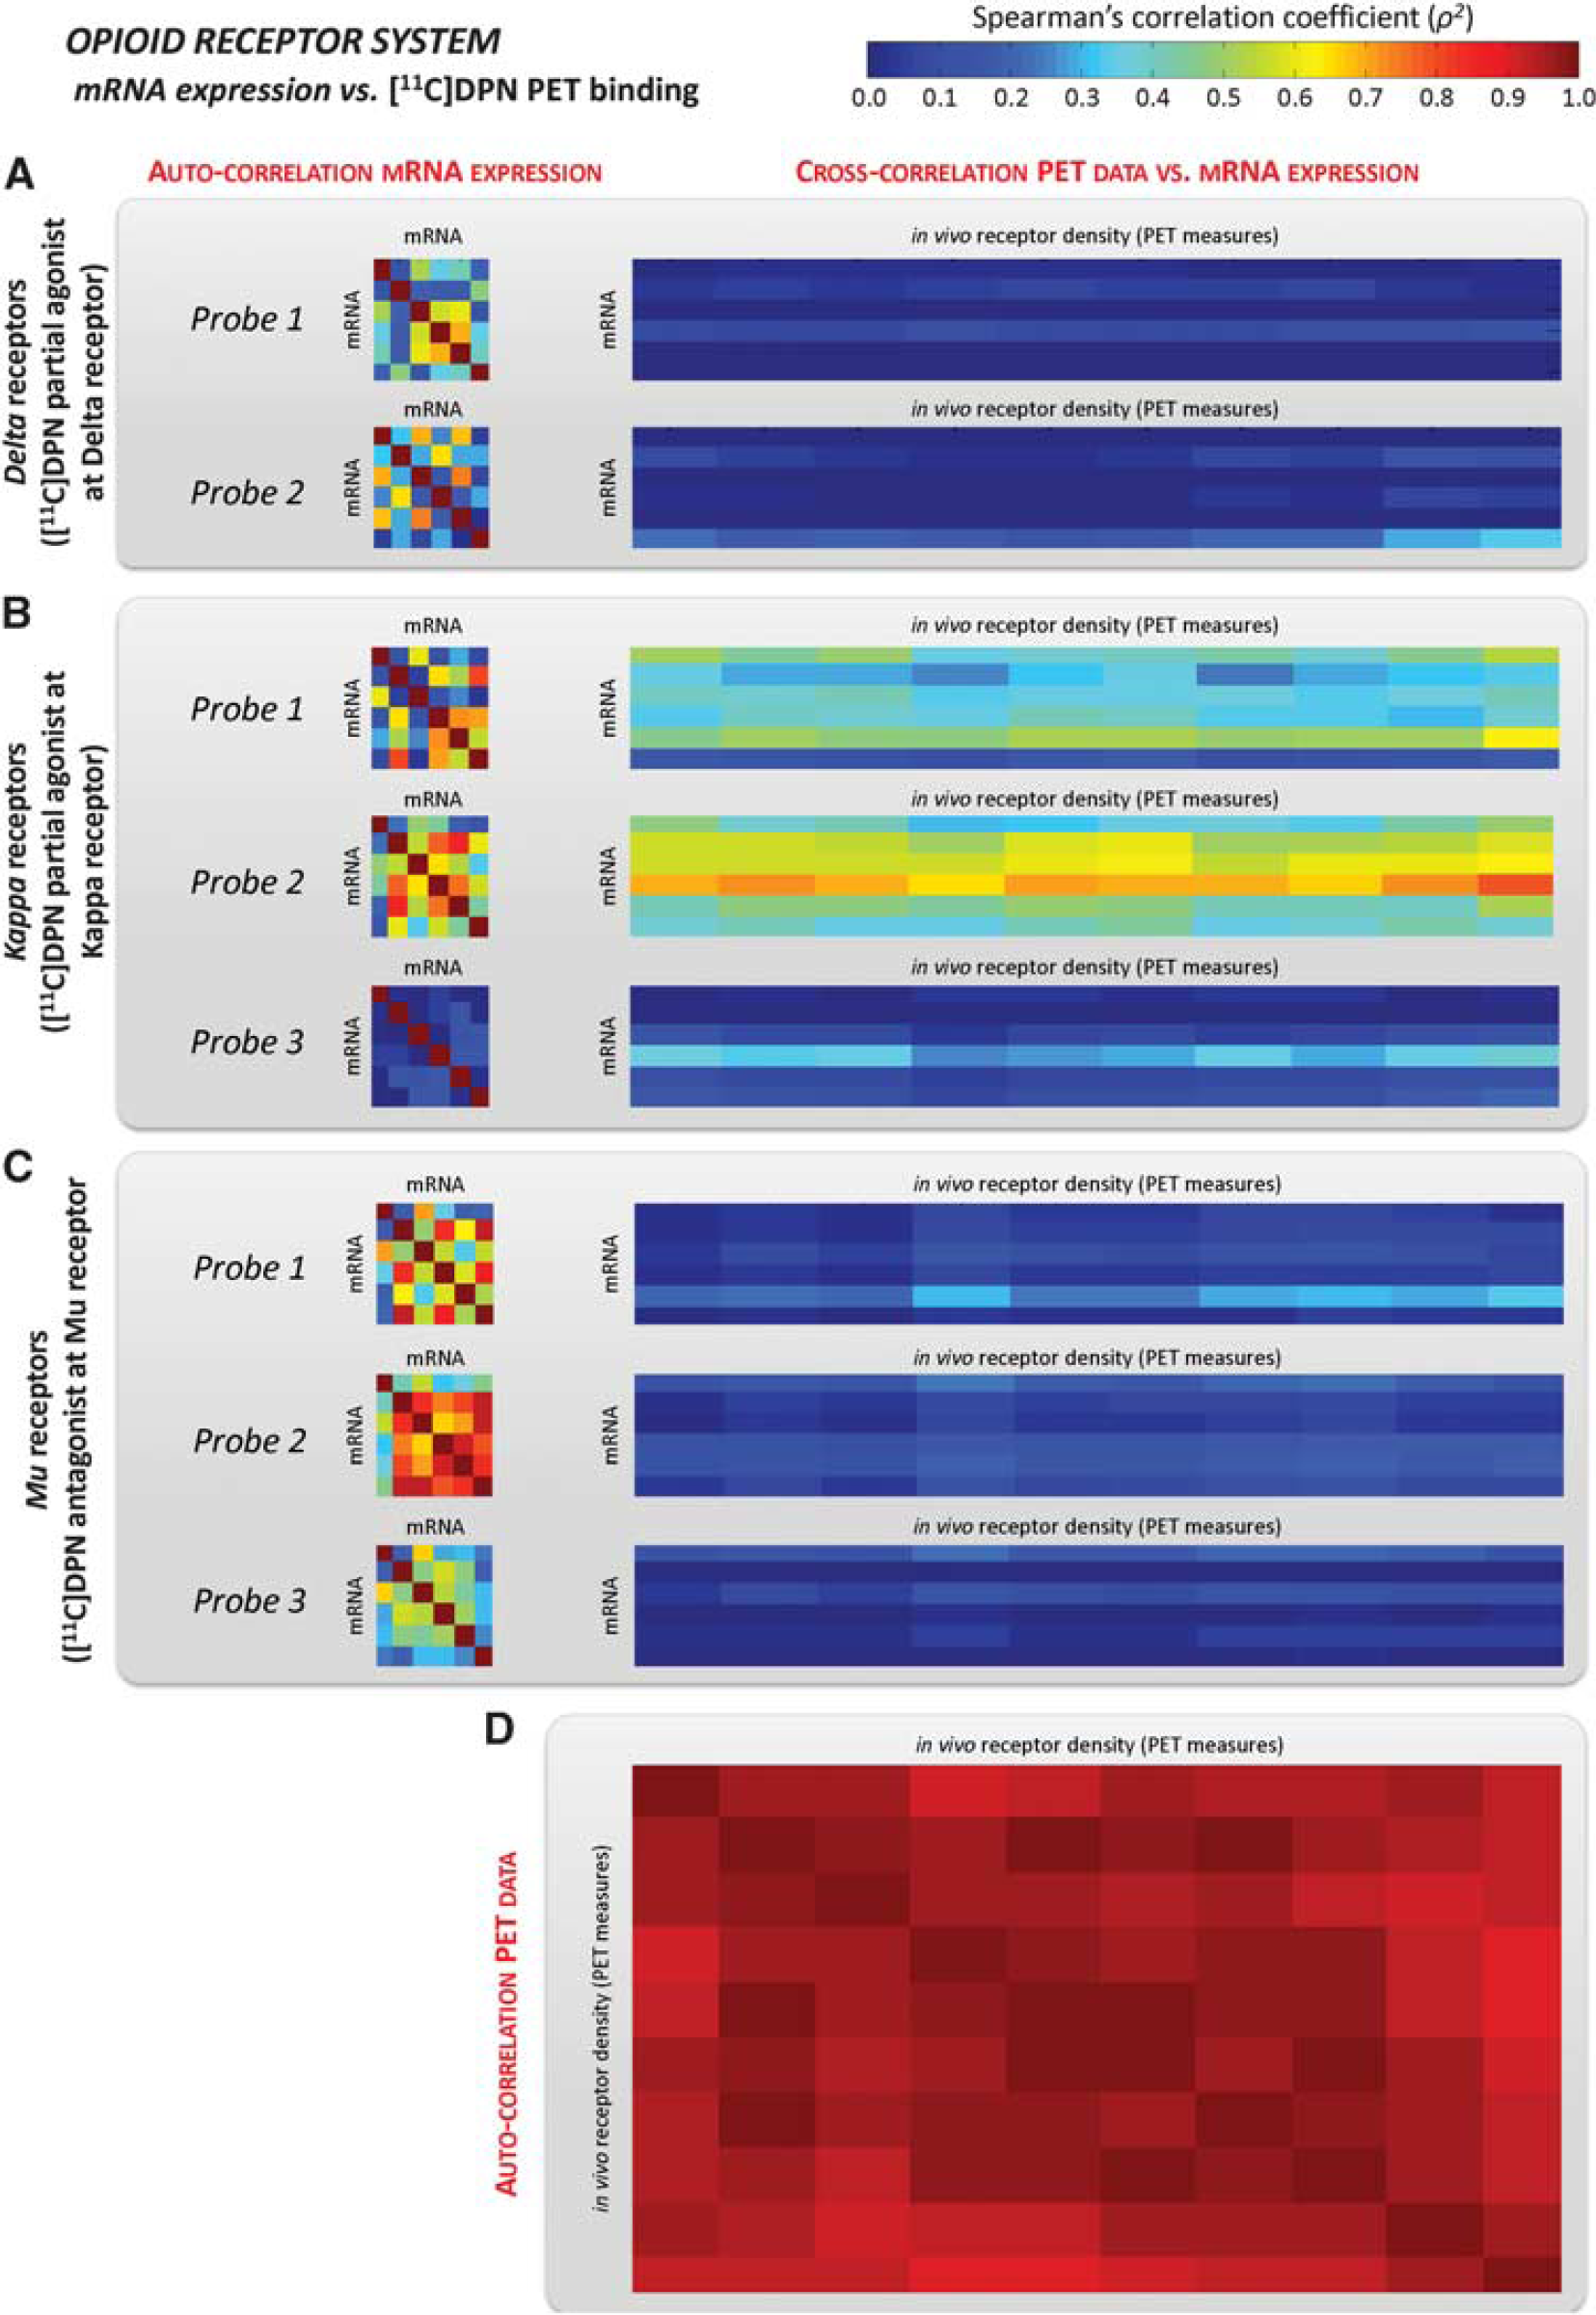
Opioid receptor mRNA expression vs. [11C]diprenorphine ([11C]DPN) volume of distribution. Auto-correlation of mRNA levels (averaged within the regions of interest (ROIs) with at least five genomic samples) for Delta, Kappa, and Mu receptors and their cross-correlation with regional [11C]DPN total distribution volume (VT) computed in the same ROIs (A-C). Each probe is reported separately. The auto-correlation of [11C]DPN PET data is shown in
Cross-correlation of mRNA expression and PET measures of specific binding
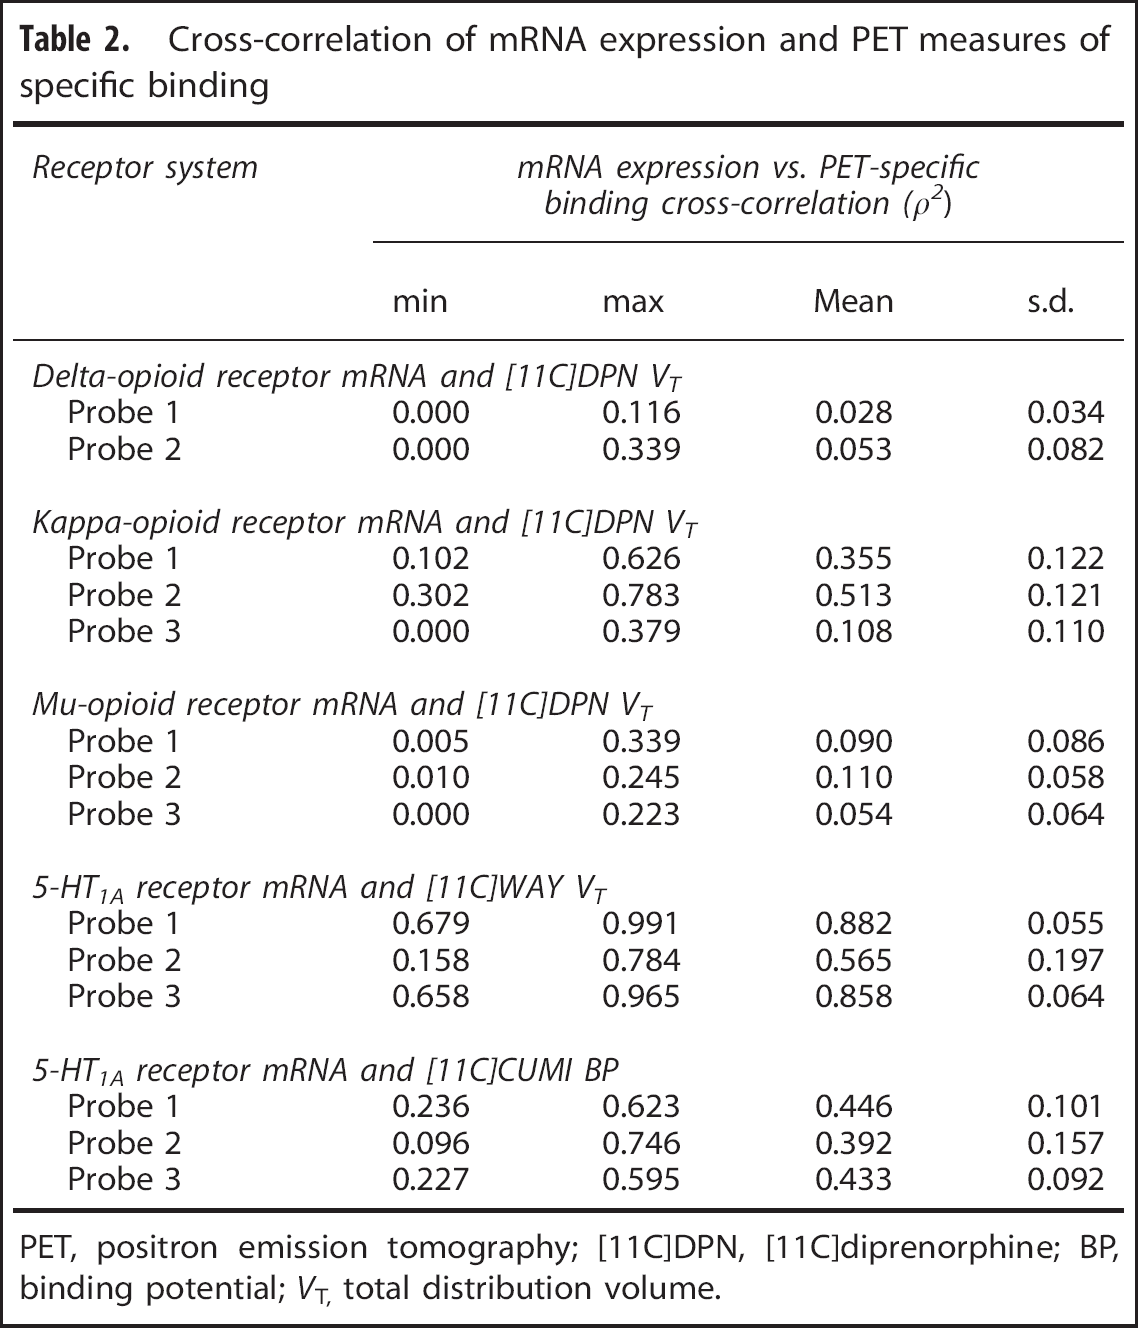
PET, positron emission tomography; [11C]DPN, [11C]diprenorphine; BP, binding potential; VT, total distribution volume.
Serotonin system. As shown in Table 2, the cross-correlations with mRNA probes for the 5-HT1A antagonist [11C]WAY100635 (Figure 4) were remarkably high and nearly double to those for the agonist [11C]CUMI101 (Figure 5). [11C]WAY100635 cross-correlation results were comparable to the auto-correlation values (on average ρ2 = 0.882 and ρ2 = 0.858 for Probes 1 and 3, respectively) while cross-correlation resu ltsfor[11C]CUMI101 were substantially below (almost 50% lower) than the auto-correlation estimates (with a maximum ρ2 = 0.446) (Table 2). Notably, even though Probe 2 for the 5-HT1A receptor had the smallest correlation coefficient for both data sets (ρ2 = 0.565 ± 0.197 and ρ2 = 0.392 ± 0.157 for [11C]WAY100635 and [11C]CUMI101, respectively), it followed the same pattern as the other two probes, that is, its cross-correlation values were comparable to the auto-correlation values when considering the antagonist tracer, and >30% lower for the agonist tracer.
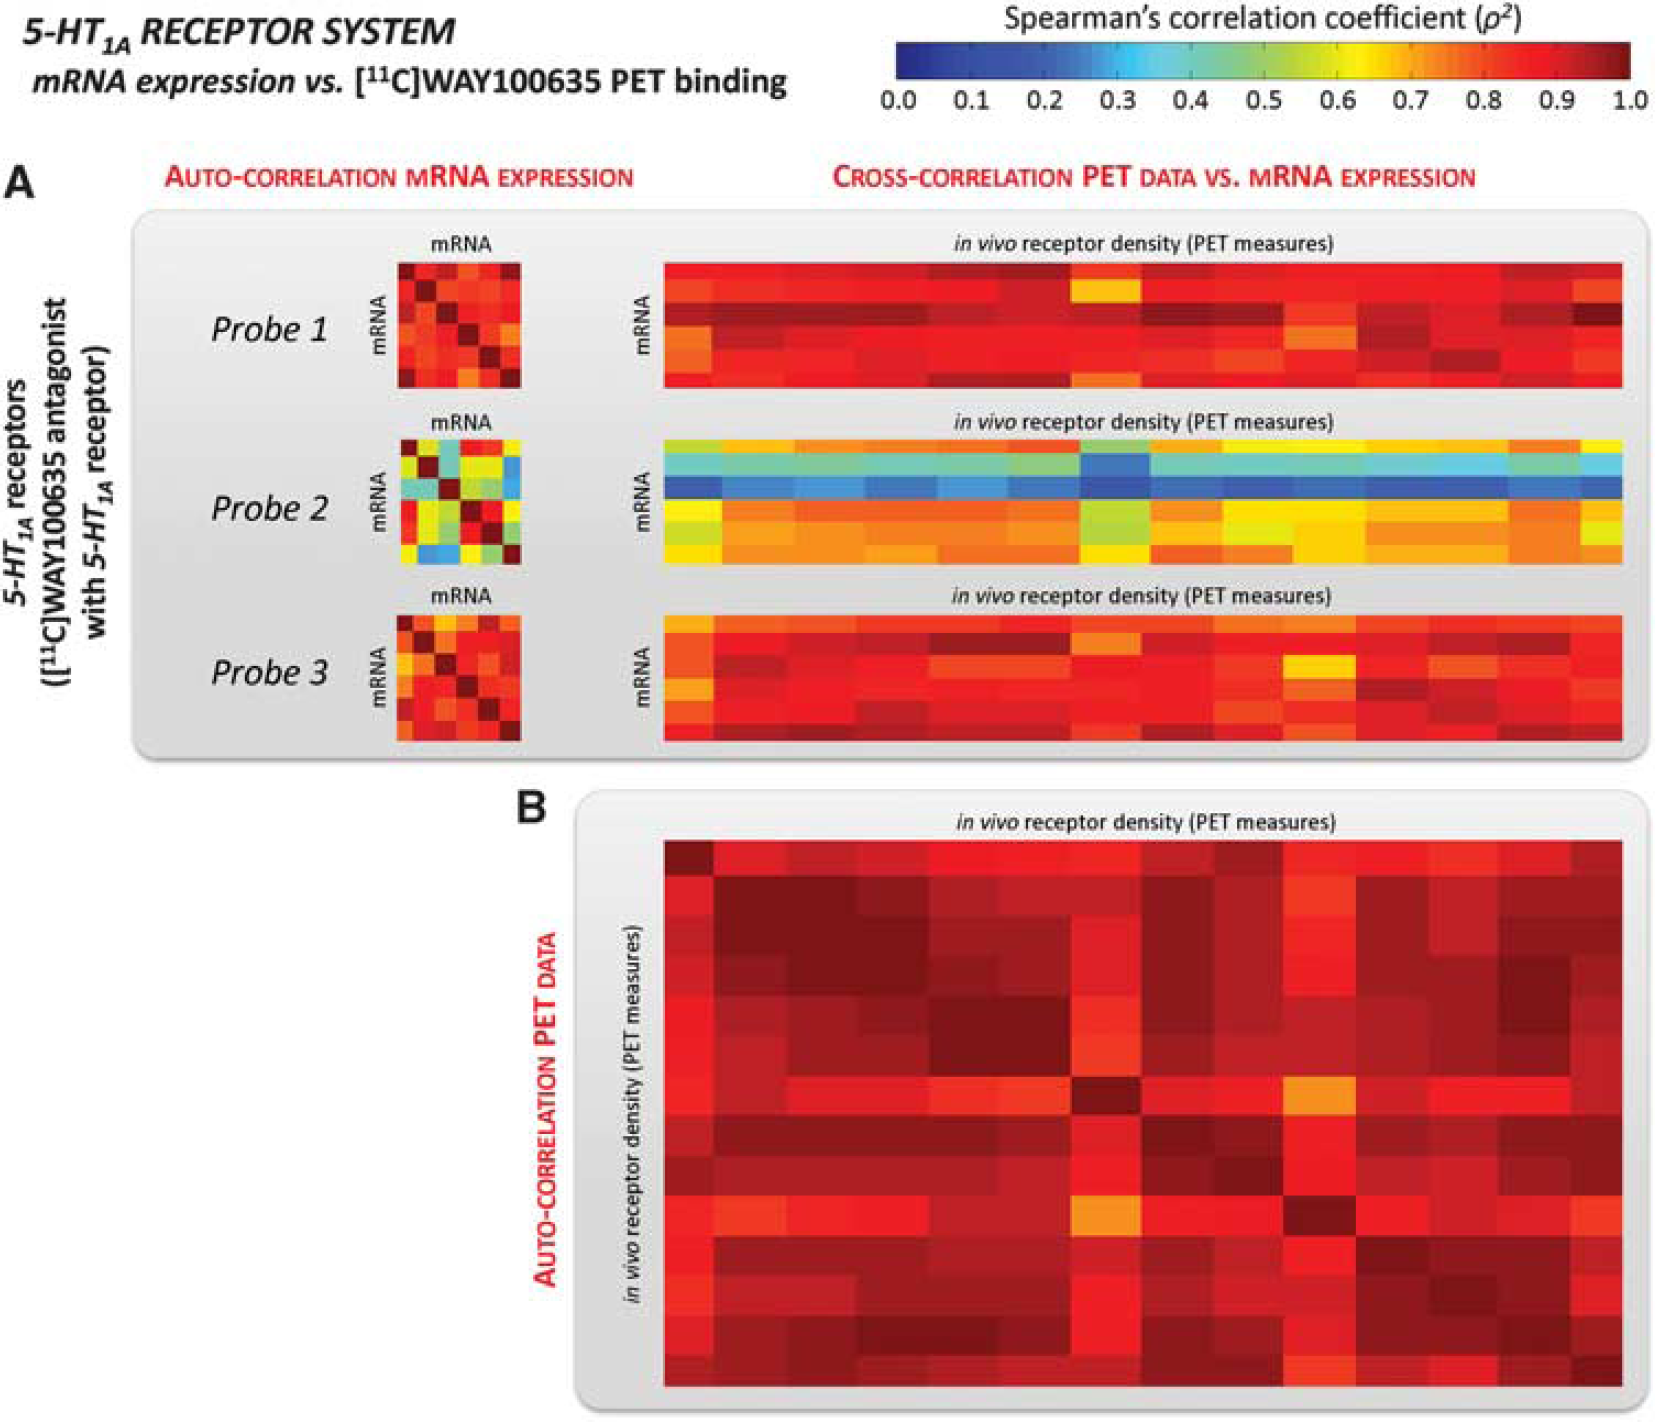
Serotoninergic receptor mRNA expression vs. [11C]WAY100635 volume of distribution. Auto-correlation of mRNA levels for the 5-HT1A receptor (averaged within the regions of interest (ROIs) with at least five genomic samples) and cross-correlation with regional [11C]WAY100635 total distribution volume (VT) computed in the same ROIs
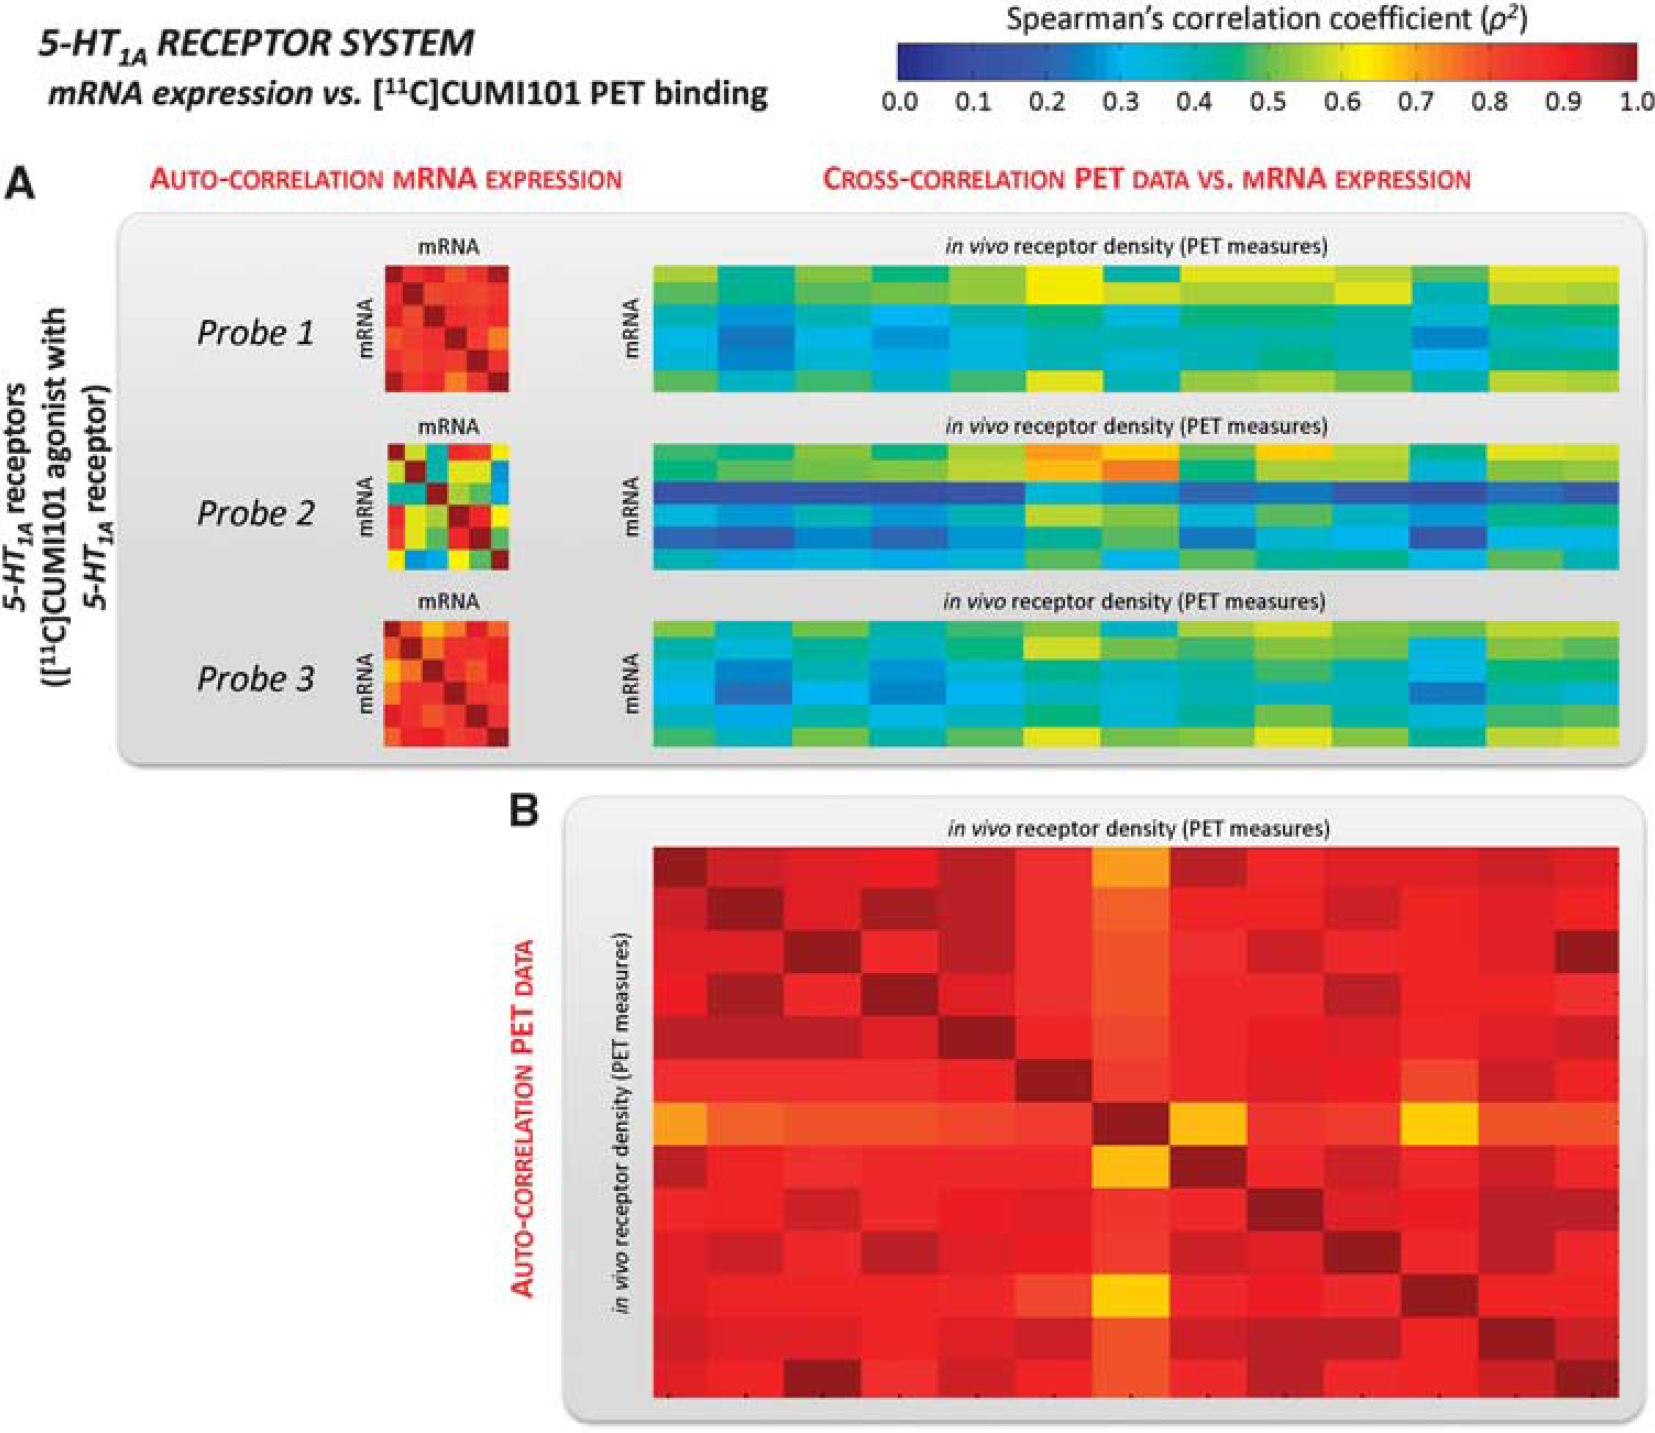
Serotoninergic mRNA expression vs. [11C]CUMI101 binding potential. Auto-correlation analysis for mRNA levels for the 5-HT1A receptor (averaged within the regions of interest (ROIs) with at least five genomic samples) and their cross-correlation with regional [11C]CUMI101 binding potential (BP) computed in the same ROIs
GABARAP and dopaminergic system. When we compared the mRNA expression with mismatched receptor binding (GABARAP and Dopamine D2 mRNA vs. serotoninergic [11C]WAY100635 VT) no correlation was found between the two measures, with ρ2 = 0.017 ± 0.029 and ρ2 = 0.038 ± 0.048 for the most strongly correlating probes (Figures 3 and 4 of Supplementary Material), indicating high specificity of the correlations found for the matching mRNA/PET binding pairs.
These two receptor systems, GABARAP and dopaminergic, were also characterized by varying auto-consistency. GABARAP mRNA expression presented lower auto-correlation (on average, ρ2 = 0.191 ± 0.170 and ρ2 = 0.499 ± 0.160 for the two probes) than the D2 receptor mRNA profiles (ρ2 = 0.368 ± 0.184 to ρ2 = 0.830 ± 0.084).
DISCUSSION
This work shows that maps of the human mRNA transcription architecture generated through DNA microarray analysis can have high or limited predictive potential, depending on the characteristics of the protein system studied.
The availability of genomic mRNA screens of brain tissue sampled at high resolution is of great interest and scientific potential. Genomic maps can help to characterize the functional profile of brain structures and help to generate models of the spatial variability of gene expression across the central nervous system. Such models could be used to reverse-engineer functional imaging data in health and disease, or to inform drug trials.
With existing technologies, direct detailed mRNA transcription mapping can only be performed on postmortem tissue. The usefulness of the resulting maps for in vivo studies depends on the predictive potential of these maps when they are adapted to living study subjects, and this potential is restricted by methodological limitations and violations of underlying biologic assumptions. The impact of these restrictions can be shown by comparing indirectly determined transcription maps with reference maps of actual protein expression. The present study shows such comparisons in an exemplary manner for two intensely studied functional systems, namely those of opioid and serotoninergic neurotransmission.
Opioids have a well-defined pharmaceutical role as analgesics. Endogenous opioids and their receptors are involved in reward, addiction, mood regulation and mood disorders, epilepsy, movement disorders, and dementia (for a review, see Hammers and Lingford-Hughes 18 ). Importantly for this work, the system is also known for the extensive posttranscriptional activity occurring at the level of alternative splicing, mRNA stability, translation, RNA polyadenylation, RNA transport, and covalent modification of the receptors. 21
Serotonin is a neuromediator involved in mood regulation, anxiety, depression, sleep, sexual activity, and appetite. The 5-HT1A receptor subtype is one of the best-studied receptors and has a key role in regulating serotoninergic function throughout the brain. No mechanisms of posttranscriptional regulation have been reported for this receptor, and strong correlations between mRNA and protein are reported under experimental conditions.30–32
The present correlation study between the Allen Atlas mRNA profiles and PET revealed a very high cross-correlation between [11C]WAY100635-specific binding and the expression profiles of the probes associated with the 5-HT1A receptor. Remarkably, our data suggest that mRNA profiles can predict 50% to 80% of the spatial variability of the receptor concentration in the brain. Cross-correlation of mRNA with PET maps was comparable to auto-correlation across mRNA samples. This suggests that one mRNA profile is equally predictive of another independent mRNA or protein profile.
Further face validity for this result emerges from the demonstration that the mRNA-PET cross-correlation was distinctly lower for [11C]CUMI101. This radioligand has agonist properties at the receptor, and the in vivo specific binding component is sensitive to the functional state of the serotonin system.20,33 This is a plausible, tentative explanation for the low correlation.
As expected, cross-correlation between mRNA species and [11C]DPN was low to negligible, as the specific binding of the tracer to the receptor protein is most likely dominated by posttranscriptional events. 21 Our results substantiate this hypothesis, in that auto-correlation for mRNA probes was low. At the same time, auto-correlation for PET measures was very high (Table 1).
These findings have to be considered critically within the technical framework used for the analysis. The design of the correlation study builds directly on the structure of the Allen map of transcript distribution. The sample size of the donor cohort was limited (six donors), and the sampling density for gene expression was heterogeneous across brain regions. This entailed the need for a minimum number of samples per region to stabilize the variance of the data and maintain the statistical power for the analysis. Even when we did not set any threshold (therefore including also ROIs with only one or two samples) the results held, with no significant differences in the auto- and cross-correlation average values (data not shown). Only the correlation variability increased, which was expected given the higher variability of the genomic data set analyzed. The PET data sets were analyzed with different voxelwise quantification methodologies, already validated in the literature, for the estimation of BP and VT. Despite BP represents a value that is closer to the receptor expression profiles, we assessed the impact of using VT instead of BP as a measure of protein density. Thus, we analyzed the [11C]DPN data for which a well-recognized reference region is available in the cerebellum brain area, calculating BP as VT/Vref −1. 26 The cross-correlation results obtained with VT and BP vs. mRNA maps were consistent: for example, for the kappa subunit, BP vs. mRNA cross-correlation values were still comparable to the genomic auto-correlation values (Table 2), ranging from ρ2 = 0.134 ± 0.106 (Probe 3) to ρ2 = 0.503 ± 0.143 (Probe 2), supporting the use of VT as a protein density measure. The lack of correlation of any of the PET data with the GABARAP and the dopaminergic probes eliminates a potential methodological confound, namely an intrinsic variation of the number of samples in different regions and related changes in variance across brain regions that might have induced spurious correlations.
In conclusion, we demonstrated that brainwide mRNA mapping was highly predictive of in vivo protein levels in unrelated control populations for genes where translation products can be assumed to stay stable. The reduced cross-correlation between mRNA activity and the agonist ligand compared with the antagonist for the same site strengthens our results, as does the lack of correlations for genes with a rich variety of posttranscriptional events. A key conclusion is that mRNA mapping is highly predictive of structure, but less of function. Users of transcription atlases should consider this circumstance when interpreting mRNA maps. Full exploitation of mRNA maps will require detailed information about the posttranslational processing of mRNA transcripts.34,35
Footnotes
The authors declare no conflict of interest.
ACKNOWLEDGMENTS
The authors are grateful to Andrea Stevan for the assistance in performing the import of genomic data in PET space and to Dr Denis Peruzzo for the support in the adaptation of the Hammersmith Brain Atlas for [11C]CUMI101 data set.
References
Supplementary Material
Please find the following supplemental material available below.
For Open Access articles published under a Creative Commons License, all supplemental material carries the same license as the article it is associated with.
For non-Open Access articles published, all supplemental material carries a non-exclusive license, and permission requests for re-use of supplemental material or any part of supplemental material shall be sent directly to the copyright owner as specified in the copyright notice associated with the article.