
Abstract
The branched chain amino acid transaminase (BCAT) has an important role in nitrogen shuttling and glutamate metabolism in the brain. The purpose of this study was to describe the cerebral distribution and metabolism of hyperpolarized 2-keto[1-13C]isocaproate (KIC) in the normal rat using magnetic resonance modalities. Hyperpolarized KIC is metabolized to [1-13C]leucine (leucine) by BCAT. The results show that KIC and its metabolic product, leucine, are present at imageable quantities 20 seconds after end of KIC administration throughout the brain. Further, significantly higher metabolism was observed in hippocampal regions compared with the muscle tissue. In conclusion, the cerebral metabolism of hyperpolarized KIC is imaged and hyperpolarized KIC may be a promising substrate for evaluation of cerebral BCAT activity in conjunction with neurodegenerative disease.
Introduction
Enzymatic processes can be noninvasively quantified and imaged in vivo with magnetic resonance spectroscopic imaging of hyperpolarized 13C-labeled metabolites (Golman et al, 2006; Merritt et al, 2007). The application of the Dynamic Nuclear Polarization (dissolution-DNP) method dramatically enhances the magnetic resonance (MR) signal (hyperpolarization) from the 13C label (Ardenkjaer-Larsen et al, 2003) and the incorporation of this label into other metabolites can be monitored. Hyperpolarized metabolic MR has been applied to several preclinical models including those of oncology (Chen et al, 2007; Day et al, 2007; Golman et al, 2006; Kurhanewicz et al, 2011) and cardiology (Golman et al, 2008; Schroeder et al, 2009a, 2009b; Tyler, 2011). These studies have established the usefulness of this novel MR methodology for assessment of cellular metabolic states. The majority of studies performed to date have used the key energy metabolite, pyruvate. The hyperpolarized 13C in C-1 labeled pyruvate is transferred to lactate, alanine, or bicarbonate, thus, providing unique information about the enzymatic processes catalyzed by lactate dehydrogenase, alanine transaminase, and pyruvate dehydrogenase (Merritt et al, 2007). Recently, the potential of chemical shift imaging (CSI) of hyperpolarized 2-keto[1-13C]isocaproate (KIC) for molecular profiling of lymphoma tumors was shown in vivo (Karlsson et al, 2010). Hyperpolarized KIC is metabolized to leucine by the branched chain aminotransferase (BCAT), which catalyzes the flux of hyperpolarized 13C label from KIC to leucine.
In the brain, two isoforms of BCAT are expressed (mitochondrial, mBCAT and cytosolic, cBCAT). The cBCAT is expressed in neurons and the mBCAT is found in astrocytes (Castellano et al, 2007; Garcia-Espinosa et al, 2007).
The BCAT activities are linked to the neuron-astroglia glutamine/glutamate shuttle and have an important role in supporting brain nitrogen homeostasis (Hutson, 2001). These processes are thought to provide a glutamate-‘buffering’ mechanism of the excitatory neurotransmitter whereby high intraneuronal levels and low extracellular levels in the synaptic cleft can be maintained. The intraneuronal concentration of glutamate must be kept high to ensure the supply on depolarization. In contrary, in nerve endings, where the extracellular concentration of glutamate must be kept relatively low (<5 to 10 μmol/L), the transaminase reaction favors KIC reamination consuming glutamate. This is congruent with the fact that the whole brain levels of KIC are <1 mmol/L (Keen et al, 1993; Yokota et al, 1993), favoring leucine generation (Shambaugh and Koehler, 1983; Yudkoff et al, 1996a, 1996b; Zielke et al, 1997). The synthesis of brain glutamate, the major excitatory neurotransmitter of the mammalian nervous system, requires an amino group donor that is efficiently transported into the brain. The branched chain amino acids, isoleucine, valine and in particular leucine, have an important role in this. In astroglia, leucine donates an amino group to α-ketoglutarate to yield glutamate, which is further converted into glutamine. Consequently, leucine is metabolized to KIC, which, like glutamine, is released to the extracellular fluid. 2-Keto[1-13C]isocaproate is taken up by neurons and is regenerated to leucine, consuming glutamate in the process. Leucine is released to the extracellular fluid, from which it again can be used by astroglia to yield glutamate (Yudkoff et al, 2007; see Figure 1). Generally, BCAT catalyzes the reversible α-amino group transfer to α-ketoglutarate to form glutamate and the respective branched chain α-keto acids. The branched chain α-keto acids can be irreversibly decarboxylated by a mitochondrial dehydrogenase (branched-chain α-ketoacid dehydrogenase complex); a reaction that is specific for neurons. The further steps in the catabolic pathways of the three branched chain α-keto acids diverge.
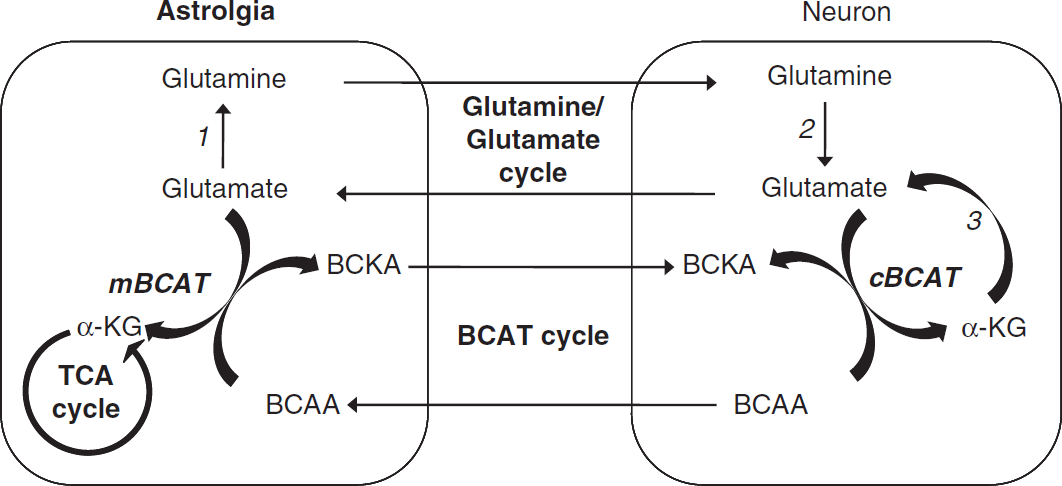
Branched chain amino acid transaminase (BCAT) cycle and de-novo glutamate synthesis. The branched chain amino acids (BCAAs) donate nitrogen via mBCAT in astroglia for glutamate synthesis with reamination of branched chain keto acids (BCKAs) in neurons by cBCAT and shuttling of nitrogen to astroglia via BCAAs. Other key enzymes are glutamine synthetase (1), glutaminase (2), and glutamate dehydrogenase (3). mBCAT, mitochondrial BCAT; cBCAT, cytosolic BCAT; TCA, tricarboxylic cycle; α-KG, α-ketoglutarate.
The aim of our study was to visualize the biodistribution of hyperpolarized KIC and its metabolism to leucine with CSI in the anesthetized rat brain. Regional metabolism was evaluated in rat brain cortex and hippocampal areas. Furthermore, for verification of data quality we have included hyperpolarized [1-13C]pyruvate in the study to allow comparison with recently published data (Hurd et al, 2010a, 2010b).
Materials and methods
Animal Preparation
Ten Wistar rats (180 to 230 g) were anesthetized with isoflurane (0.8% isoflurane, 0.25 L/min oxygen, and 0.75 L/min air). After insertion of a tail vein catheter (inner diameter 0.4 mm) for administration of the 13C-labeled compound, the animal was placed in an animal holder (RAPID Biomedical GmbH, Rimpar, Germany). Respiration and temperature were monitored and kept stable during the scanning session (SA Instruments, Stony Brook, NY, USA). Each animal received a 1.8 to 2 mL injection in ∼10 seconds of hyperpolarized [1-13C]KIC followed by [1-13C]pyruvate administration 1 hour later. The Danish Inspectorate of Animal Experiments approved the study.
Sample Preparation
The [1-13C]pyruvic acid (Sigma-Aldrich, Copenhagen, Denmark) and [1-13C]KIC (Cambridge Isotope Laboratories, Andover, MA, USA) were mixed with 15 mmol/L trityl radical OX063 (Oxford Instruments, Abingdon, UK) and 1.5 mmol/L Dotarem (Guerbet, Villepinte, France). The samples were hyperpolarized in a HyperSense polarizer (Oxford Instruments) or a prototype DNP polarizer to average polarization levels of 15% and 30%, respectively. The polarized samples were dissolved in a buffer (80 mmol/L TRIS, 100 mg/L EDTA, 50 mmol/L NaCl, 80 mmol/L NaOH) with the final concentration of 80 mmol/L 13C-labeled compound (pH ∼7.3 to 8.1, temperature ∼35°C, isotonic).
Magnetic Resonance Experiments
A 4.7 T horizontal bore MR imaging and spectroscopy system (Varian, Palo Alto, CA, USA) was used for all experiments. A 13C surface coil (receive only) was placed on the skull of the animal and positioned inside an actively decoupled 13C/1H volume coil (RAPID Biomedical GmbH). The coil profile was recorded on a phantom of [1-13C]pyruvate at the 13C frequency. Proton MR images from the brain were acquired to retrieve anatomical information and for correct positioning of the slice for 13C magnetic resonance spectroscopy. A standard gradient echo sequence covering the whole rat brain was acquired (echo time/repetition time 4 ms/200 ms, flip angle 20°, 2 averages, 20 slices, 1 mm thick coronal slices). For detailed structural information, a fast spin echo sequence was acquired with following parameters: repetition time 3,500 ms, field of view 30 mm, 5 slices, 2 mm thickness, matrix 256 × 256, number of echoes 16 (Schwarz et al, 2006).
After administration of [1-13C]KIC (n=2 animals) or [1-13C]pyruvate (n=2 animals), dynamic 13C magnetic resonance spectroscopy from a 10 mm thick coronal slice with bregma coordinates −9 to 1 mm was acquired to determine the time window with maximal MR signal from the potential 13C-labeled metabolites. The CSI was started 20 seconds after injection of [1-13C]KIC or [1-13C]pyruvate (1.8 to 2 mL/10 s) the same 10-mm-thick slice 20 seconds after end of injection (n=6 with 2 injections/animal). The CSI pulse sequence had the following parameters: field of view 30 × 30 mm2, 16 × 16 matrix, fully sampled cartesian spiral phase encoding, flip angle 10°, number of points 512 with a bandwidth of 8,000 Hz, TR/TE 68.7/1.45 ms, resulting in a total acquisition time of 17 s (Yen et al, 2009).
Data Analysis
The peak area of the 13C-labeled metabolites was fitted in jMRUI using the AMARES algorithm (Naressi et al, 2001) with prior knowledge of fixed overall first order phase, fixed relative chemical shift, Gaussian line width, and fixed relative phase. A Hamming filter and no zero filling were used in the spatial reconstruction. The effective spatial in-plane resolution is estimated to be 3.5 mm, or approximately twice the nominal resolution. In the spectral reconstruction, a 10 Hz apodization filter was used. For metabolite ratio calculation, a voxel (nominal 1.9 × 1.9 × 10 mm3) (n=5 to 6) in the different anatomical regions (muscle, sagittal vein, cortex, and hippocampus) was selected based on the proton images. The voxels were selected on the structural MRI images correlated to stereotaxic coordinates of anatomical substructures in the rat brain (Schwarz et al, 2006).
Statistics
Student's t-test (unpaired and two tailed) at the 95% confidence level was used to evaluate the difference between group mean values of metabolite ratios. Probability values P<0.02 (∗) or P<0.005 (∗∗) were considered to indicate statistical significance.
Results
Within a few seconds on bolus administration of hyperpolarized [1-13C]KIC, 13C-signals were detectable from hyperpolarized [1-13C]KIC and its transamination product [1-13C]leucine from a 10 mm slice covering the rat brain. Maximum [1-13C]leucine signal was observed 20 to 35 s after injection of hyperpolarized [1-13C]KIC, reflecting BCAT activity (Figure 2). Maximum signals were observed 20 to 35 seconds after [1-13C]pyruvate administration from [1-13C]lactate, [1-13C]alanine, and 13C-bicarbonate.
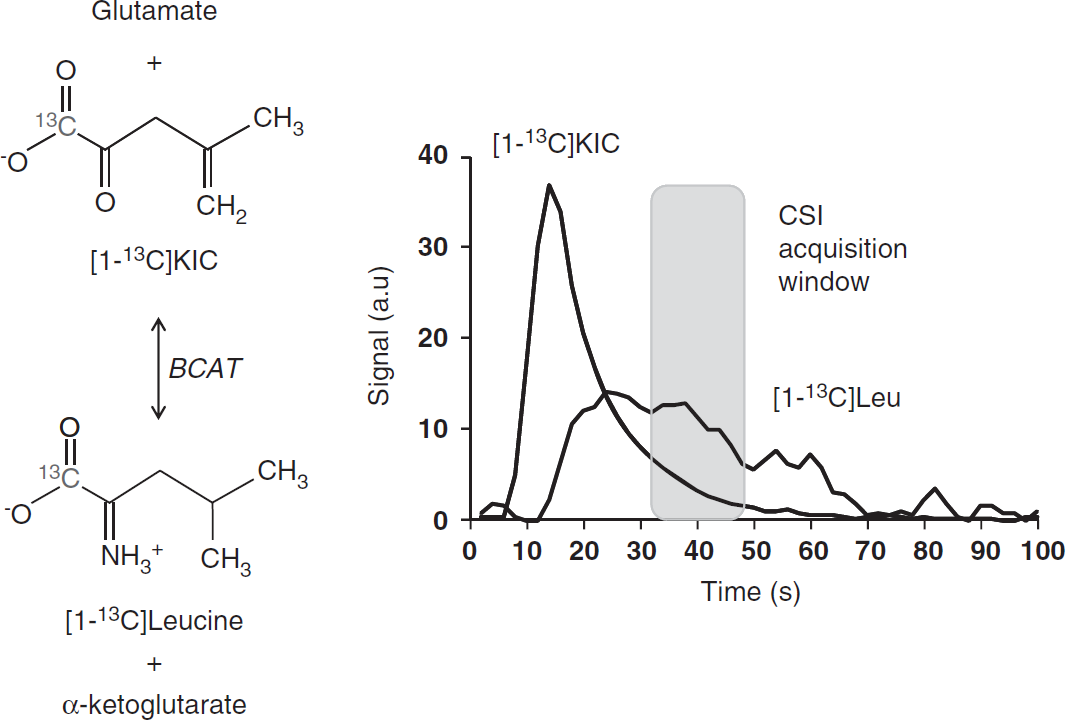
Dynamic 13C magnetic resonance spectroscopy of branched chain amino acid transaminase (BCAT) activity in vivo. (
As indicated in Figure 2, the CSI acquisition (17 s) was initiated 20 s after end of injection where the global maximal leucine signal was observed.
In Figure 3, representative CSI spectra (mosaic view) after (Figure 3A) [1-13C]KIC or (Figure 3B) [1-13C]pyruvate administration are shown for the same rat. Signals from [1-13C]KIC, [1-13C]leucine, [1-13C]pyruvate, [1-13C]lactate, and 13C-bicarbonate were observed throughout the brain. In Figure 4, the quantified metabolite maps are shown for the same animal as in Figure 3, together with the coil sensitivity profile. The signals in the CSI maps are dependent on the receiving surface coil sensitivity, which decreases with the distance from the coil. At 1 to 1.5 cm from the coil, the signal loss along the coil centerline, perpendicular to the surface coil-plane, was measured to be 80%. The metabolic maps showed strong [1-13C]KIC and [1-13C]pyruvate signals from the sagittal sinus vein at the top of the rat brain. The strongest signal from [1-13C]leucine is located to the brain tissue. High signal from [1-13C]lactate was observed in the brain and muscle tissue. The strongest signal from 13C-bicarbonate was observed in the brain, whereas the strongest signal from [1-13C]alanine was confined to muscle tissue.
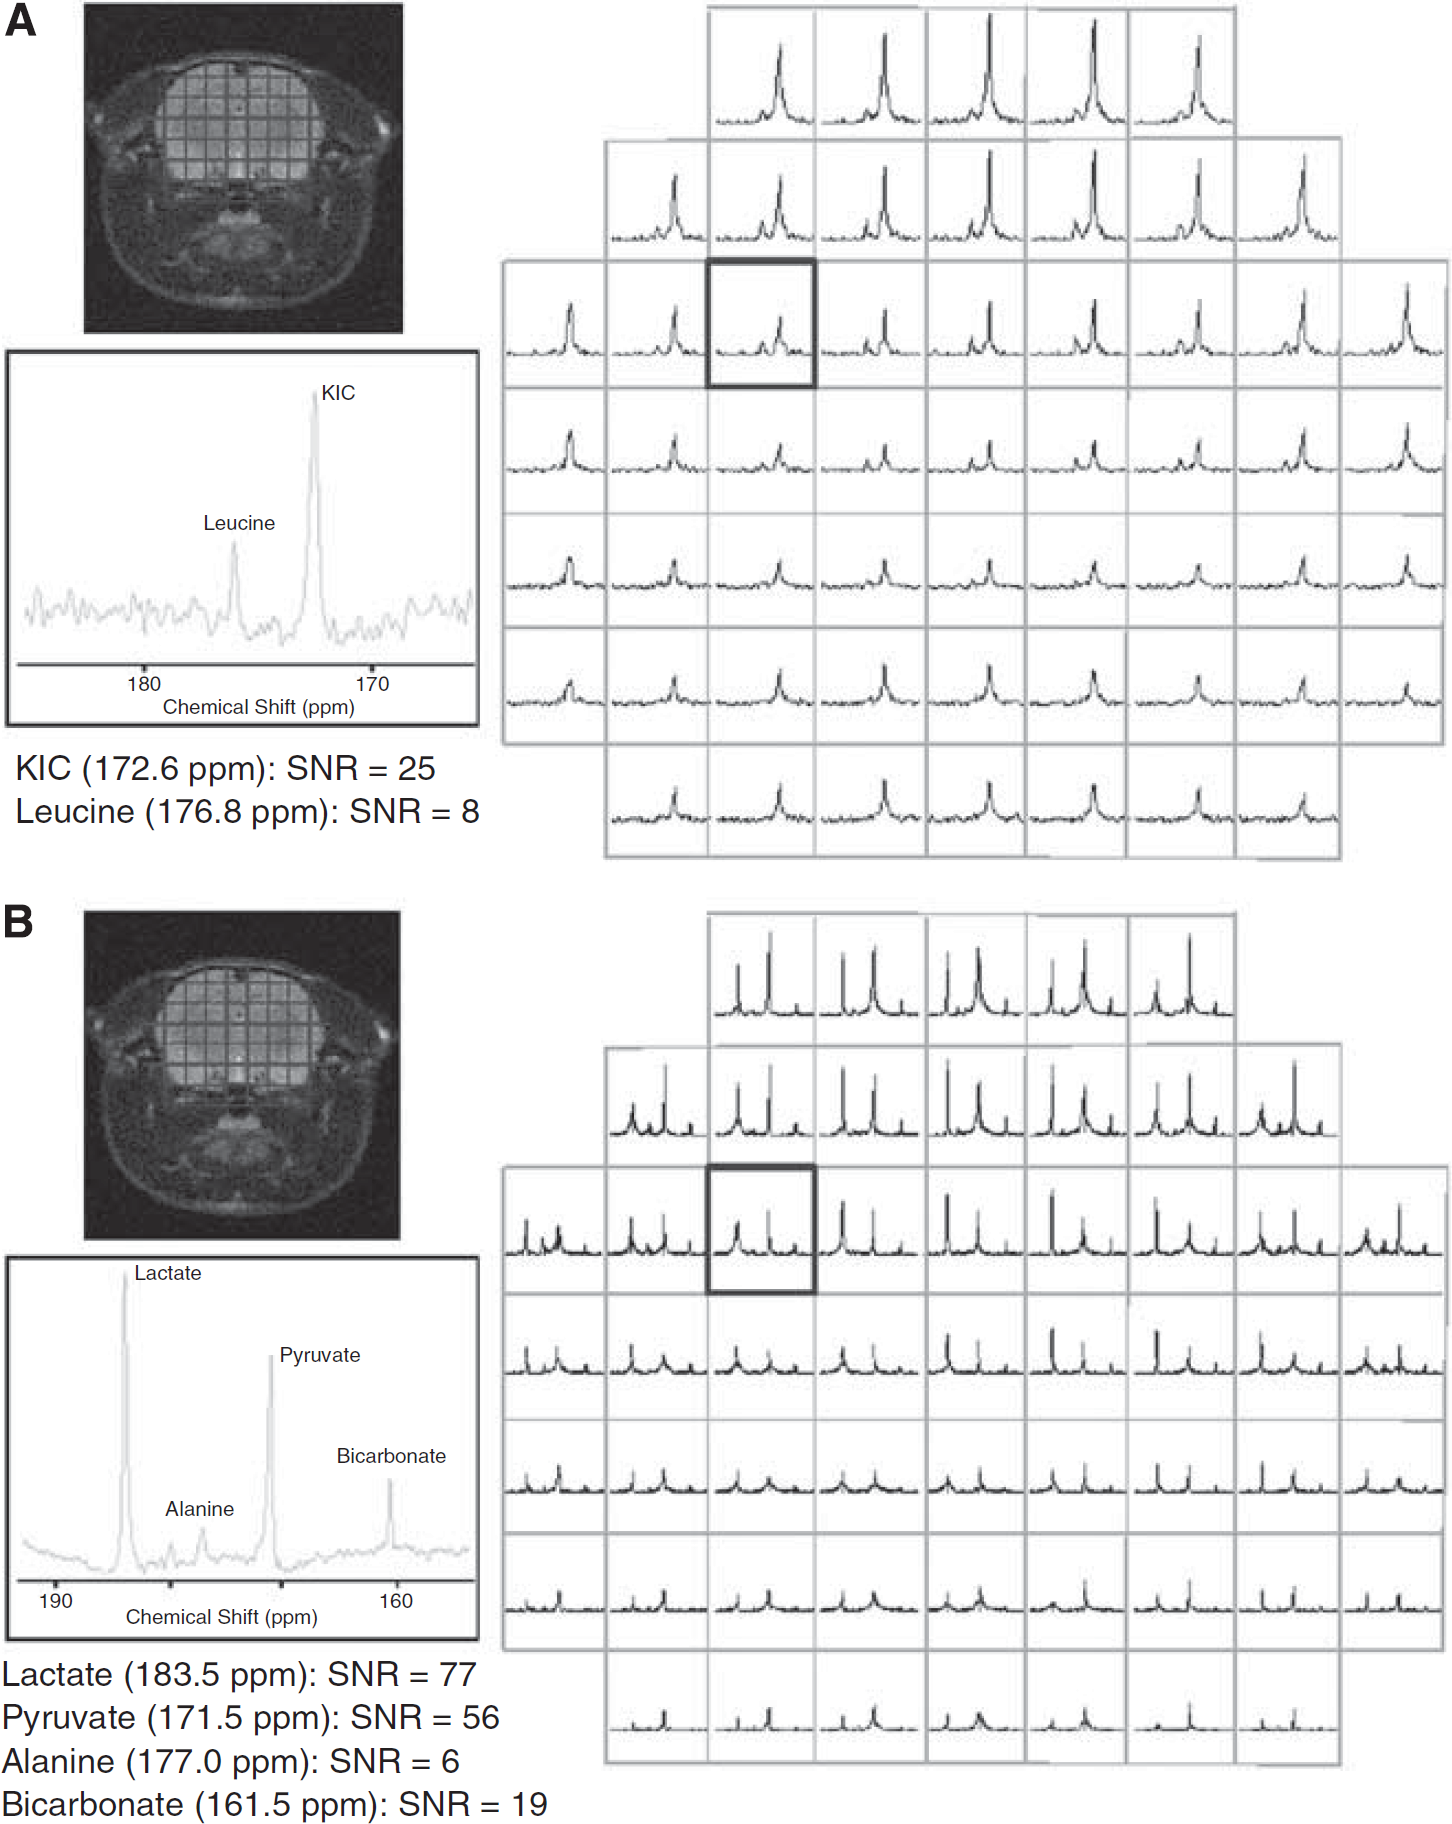
Mosaic view of chemical shift spectra (absolute value) from a representative animal. Spectra were acquired 20 s after end of hyperpolarized (
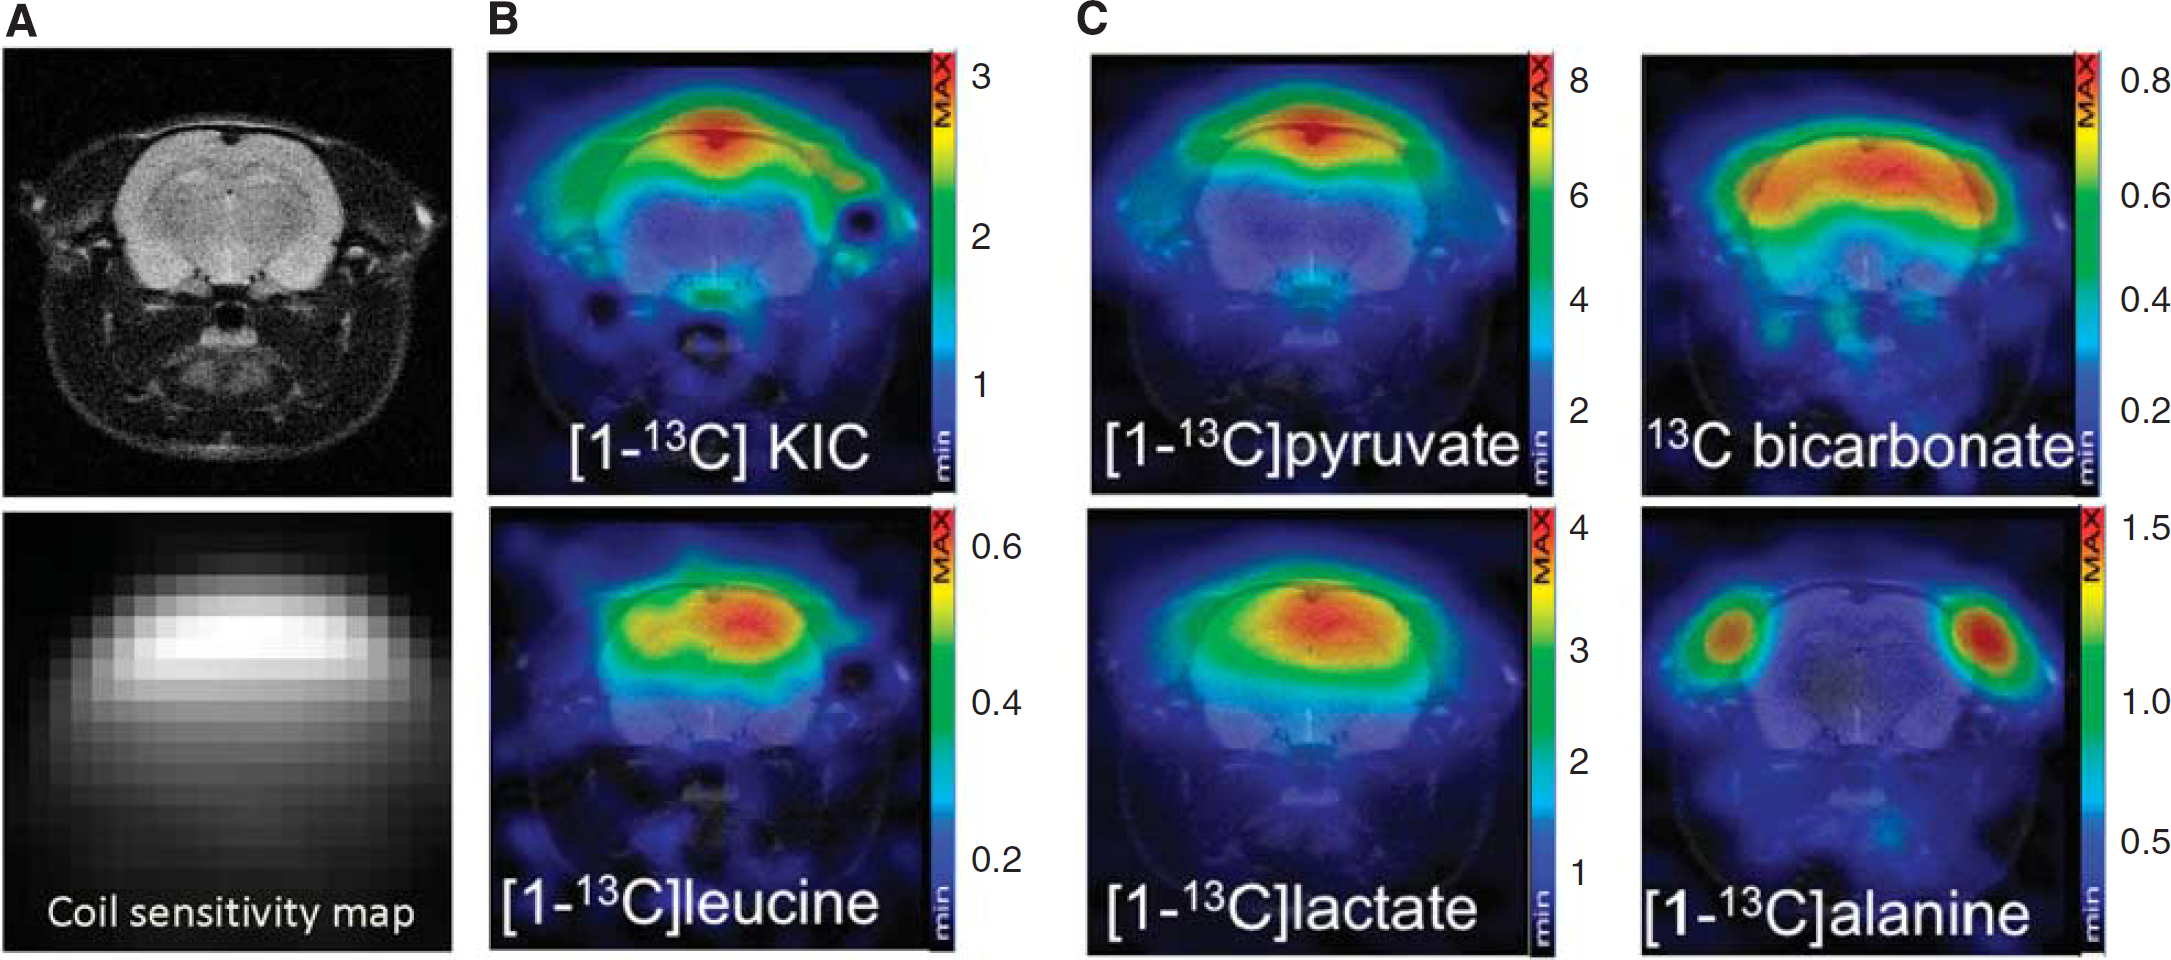
Chemical shift imaging of rat brain branched chain amino acid transaminase (BCAT) activity in vivo. (
The metabolite ratios from voxels corresponding to different anatomical structures in the brain were determined. In Figure 5, the mean metabolite ratios from the anatomical regions; muscle, sagittal sinus vein, cortex, and hippocampus are displayed. Compared with muscle, the leucine/KIC (leu/KIC) ratios, reflecting BCAT activity, were significantly higher in the hippocampus. Compared with cortex and muscle, the lactate/pyruvate (lac/pyr) ratios (reflecting lactate dehydrogenase activity) were significantly higher in the hippocampus. The bicarbonate/pyruvate (bic/pyr) ratios (reflecting pyruvate dehydrogenase activity) were significantly higher in hippocampus compared with the muscle. Moreover, significantly lower ratios of alanine/pyruvate (ala/pyr) (reflecting alanine transaminase activity) were observed in the sagittal vein and all brain regions compared with the muscles.
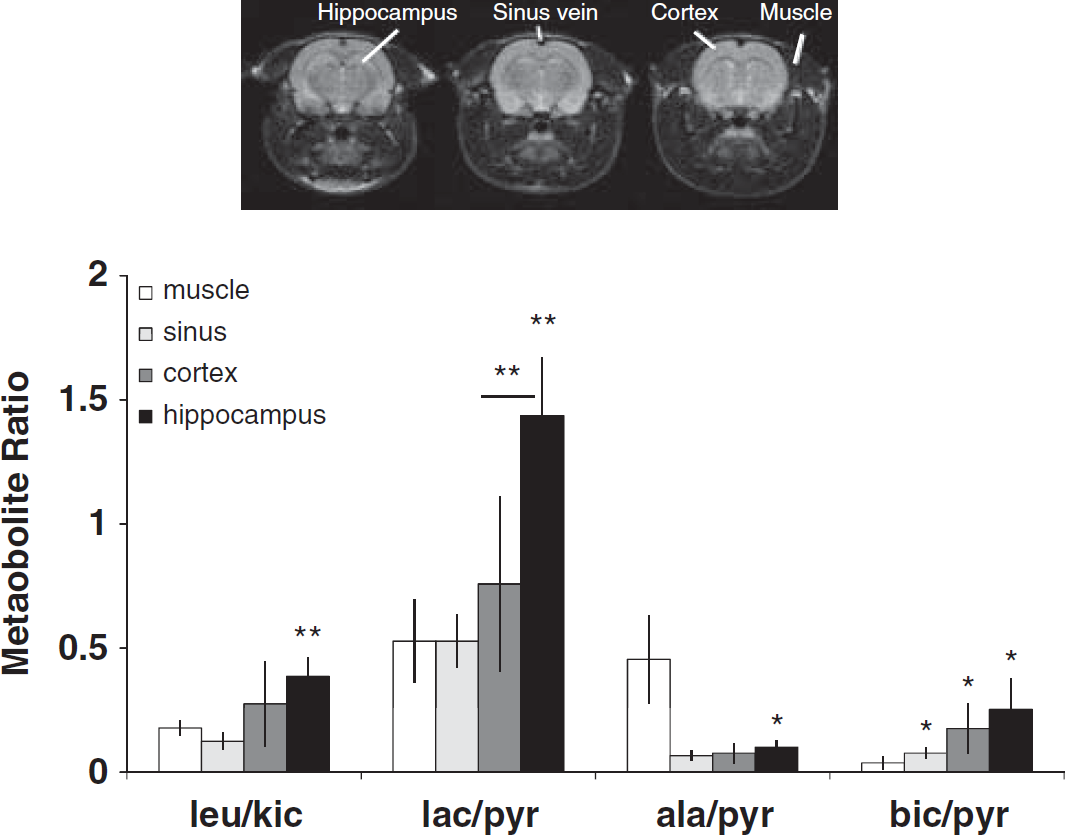
Regional rat brain metabolism. Metabolite amplitude ratios from the muscle, sinus vein and brain regions; cortex and hippocampus with localization indicated on proton images (top). Group mean±s.d., (voxel n=5 to 6), ∗P<0.02; ∗∗P<0.005 (compared with muscle, unless otherwise indicated) (leu, leucine; kic, 2-ketoisocaproate; pyr, pyruvate; lac, lacatate; ala, alanine; bic, bicarbonate).
Discussion
The similar distribution and comparable signal intensities of hyperpolarized KIC and pyruvate confirm the efficient cellular monocarboxylate uptake in the brain regions. It is well known that exogenous KIC (and other monocarboxylates such as pyruvate and lactate) is taken up by the blood–brain barrier via monocarboxylate transporters (MCTs) (Steele, 1986). The blood–brain barrier has restricted permeability and the MCTs are expected to saturate at the doses used in this study (Cremer et al, 1979). In the rodent brain, the three isoforms MCT1, MCT2, and MCT4 are known (Pellerin et al, 2005). MCT2 is the major transporter in the rodent brain and prefers pyruvate, KIC, and lactate as substrates (Km <0.8 mmol/L; Broer et al, 1999). The MCT1 Km for KIC, pyruvate, and lactate are 0.67, 1, and 3.5 mmol/L, respectively (Broer et al, 1999). The low-affinity MCT4 has Km ∼35 mmol/L for lactate, pyruvate, and KIC (Dimmer et al, 2000). The expression of MCT1 is higher in the rat thalamus than in the hippocampus and cortex. The levels of MTC2 in the hippocampus are higher than in the cortex and cerebellum (Vannucci, 2003). MCT4 is expressed in several areas including the cortex, hippocampus, and the paraventricular nucleus in the hypothalamus and cerebellum (Pellerin et al, 2005).
Regional differences of cBCAT have been reported (Garcia-Espinosa et al, 2007; Hutson et al, 1995; Sweatt et al, 2004). In the cortex, cBCAT expression is relatively lower than in hippocampal areas (Castellano et al, 2007) whereas in rat muscles the mBCAT isoform expression dominates (Suryawan et al, 1998). Besides BCAT activity, the regional differences in the glutamate pool concentration are also reflected in the measured leucine signal. Moreover, the delivery of KIC to the tissue, cellular uptake by the MCTs and the leucine pools in the cell, all contribute to the observed ratios. The observation of higher leucine-to-KIC ratio in hippocampus than the ratio in cortex is consistent with the literature, which describes that both MCT2 and cBCAT are expressed higher at higher level in the hippocampus compared with cortex. Our findings using hyperpolarized pyruvate agree well with the literature. Hyperpolarized pyruvate is efficiently taken up by the anesthetized rat brain and metabolized to lactate and bicarbonate (Hurd et al, 2010a, 2010b; Marjanska et al, 2010; Mayer et al, 2011). Throughout the rat brain, differences in intracellular lactate dehydrogenase expression and kinetic parameters are reported (Bittar et al, 1996; Laughton et al, 2000; O'Brien et al, 2007).
Both astroglia and neurons contain mitochondria, however, neurons preferably transform pyruvate to acetyl-CoA catalyzed by pyruvate dehydrogenase. In contrast, astroglia preferably generate lactate from pyruvate (Halim et al, 2010; Pellerin, 2005). Throughout the rat brain, alanine transaminase activity is reported, although, being much lower compared with the lactate dehydrogenase activity (Erakovic et al, 2001). This corresponds well with our observations that the signal from hyperpolarized [1-13C]alanine is observed primarily in the rat skull temporal muscles.
The 13C-signals are projections from a 10 mm thick slice with estimated effective in-plane resolution of approximately 3.5 × 3.5 mm2. The spatial resolution is sufficient to quantify regional differences between the cortex and the hippocampus. Yen et al (2009) has described the impact of the point-spread function on the applied CSI sequence based on which we estimate the effective resolution.
The rat brain metabolism is affected by the use of halogen anesthesia. The levels of isoflurane used in our study are reported to significantly decrease the glucose uptake in most brain regions except for corpus callosum, hippocampus, and hypothalamus, with unchanged local cerebral blood flow (Maekawa et al, 1986). During the scanning session, isoflurane may decrease the uptake and metabolism in most brain regions, perhaps with the exception of the hippocampal area. It cannot be distinguished whether the general tendency of lower metabolism in, i.e., cortex is caused only by the isoflurane or by the regional differences in metabolism. Interestingly, no changes in brain glutamate levels have been reported; however, lactate levels are increased in brain tissue by isoflurane (Horn and Klein, 2010). The endogenous lactate concentration will influence the observed lactate signal (Day et al, 2007).
In conclusion, we have shown for the first time that hyperpolarized KIC and leucine is distributed throughout the rat brain and CSI of hyperpolarized KIC is a sensitive method to assess the BCAT activity in vivo. Both hyperpolarized KIC and pyruvate may be relevant compounds for brain imaging of different biochemical reactions in, e.g., rat models for neurodegenerative diseases such as Alzheimer's disease where global and regional changes in glucose (Ibanez et al, 1998) and glutamate (Hyman et al, 1987) metabolism have been reported.
Footnotes
Disclosure/conflict of interest
The authors declare no conflict of interest.