
Abstract
In vivo characterization of the brain pharmacokinetics of novel compounds provides important information for drug development decisions involving dose selection and the determination of administration regimes. In this context, the compound-target affinity is the key parameter to be estimated. However, if compounds exhibit a dynamic lag between plasma and target bound concentrations leading to pharmacological hysteresis, care needs to be taken to ensure the appropriate modeling approach is used so that the system is characterized correctly and that the resultant estimates of affinity are correct. This work focuses on characterizing different pharmacokinetic models that relate the plasma concentration to positron emission tomography outcomes measurements (e.g., volume of distribution and target occupancy) and their performance in estimating the true in vivo affinity. Measured (histamine H3 receptor antagonist—GSK189254) and simulated data sets enabled the investigation of different modeling approaches. An indirect pharmacokinetic-receptor occupancy model was identified as a suitable model for the calculation of affinity when a compound exhibits pharmacological hysteresis.
INTRODUCTION
In vivo characterization of the brain pharmacokinetics of novel CNS compounds provides important information for drug development, enabling dose selection and determination of optimal administration regimes. Although in vitro estimates of affinity are usually the starting point for pharmacokinetic characterization, in vivo conditions such as the presence of endogenous ligands, local ionic environments, receptor clustering, and ligand rebinding effects are difficult to reproduce in vitro leading to uncertainty around these estimates. Furthermore, affinity captures only an equilibrium property of the compound and thus it is just one component of a more comprehensive pharmacokinetic characterization. In particular, compounds with slow tissue kinetics relative to plasma, where the drug–target interaction is the rate-limiting process, are characterized by pharmacological hysteresis. 1 Hysteresis is the dependence of a system not only on its current environment but also on its past environment and thus to predict its future development, either its internal state or its history must be known. While hysteresis traditionally concerns systems with alternately increasing and decreasing inputs, where the outputs form a loop, it can also occur in systems where there is a dynamic lag between the input and output. This effect is also referred to as hysteresis, or rate-dependent hysteresis and is the phenomenon studied here in relation to dynamic lags between the plasma and target bound concentrations.
Positron emission tomography (PET) has been used to study the in vivo pharmacokinetic properties of ligands binding to receptors in the brain via a number of different methods. 2 For example multiple injection (MI) protocols using different specific activities (SA) were first proposed by Delforge et al 3 and subsequently used to estimate the affinity of labeled compounds, for example, CFT, 4 fallypride, 5 and fluorocarazolol. 6 Further, if a reference region devoid of specific target sites exists, the pseudoequilibrium method or multiple ligand concentration receptor assay can be applied using different SA injections, allowing for estimation of the affinity in an analogous manner to the in vitro Scatchard approach.7,8 These methods work by achieving different levels of target occupancy via homologous competition with the radiolabeled compound, allowing separate estimates of target density and radioligand affinity. However, during drug development a radiolabeled version of the drug candidate may not exist rendering these methods unviable. An alternate approach involving heterologous competition can be applied if a suitable PET radioligand exists for the target. These methods involve modeling changes in the specific PET outcome measures (VT, BPND or target occupancy) due to heterologous competition with the unlabeled compound of interest. Two general models that relate the target occupancy to the plasma concentration can be formulated. The first and simplest model assumes that the target bound concentration of the compound is in equilibrium with the plasma concentration at all times leading to an Emax type relationship. 9 The second approach relates the two quantities in the nonequilibrium condition when a dynamic lag exists between the plasma and target bound concentrations.10–12
In this paper, the in vivo affinity of GSK189254, a highly selective histamine H3 ligand, 13 was investigated using different analytical methods applied to a nonhuman primate PET study using [ 11 C]GSK189254 as the radioligand. In addition, computer simulations were used to explore a wide range of kinetic behavior that included scenarios where compounds rapidly equilibrated between plasma and tissue through to scenarios involving a substantial dynamic lag between plasma and target bound concentrations congruous with pharmacological hysteresis. We hypothesized that the different approaches would all provide good estimates of the in vivo affinity for compounds that rapidly equilibrate between plasma and tissue but that biased estimates would be obtained for approaches that do not properly account for a dynamic lag between plasma and target bound concentrations in conditions of pharmacological hysteresis.
Theory
This section outlines the mathematical framework for the different methods that estimate affinity.
Multiple injection method. While tracer alone PET studies only allow for the estimation of the product of the available receptor density and affinity (the binding potential), the MI method
3
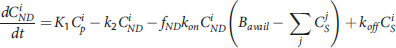
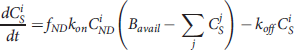
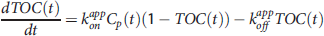
enables estimation of both the available receptor density (Bavail) and the radiotracer equilibrium dissociation rate constant (Kd–inversely proportional to affinity). The MI method achieves this by driving the receptor system to different levels of occupancy through the coinjection of cold ligand (i.e., the experiment is performed at different SA). In brief, a set of 2n differential equations (i = 1,2, ... n—one for each injection) representing the rate of change of free plus nonspecifically bound (CND) and specifically bound (CS) mass concentrations is solved simultaneously to determine K1, k2, fND, kon, koff, and Bavail.
14
The apparent equilibrium dissociation rate constant (Kappd) of the compound is defined by the ratio
The application of the MI method is restricted to homologous competition studies in which both the labeled and unlabeled compounds have the same kinetic properties.
PseudoEquilibrium method. When the bound compartment is in equilibrium with the free compartment (i.e.,
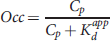
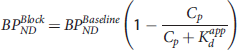
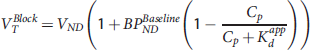
Direct PK-RO model. A direct pharmacokinetic-receptor occupancy (PK-RO) model can be applied to both homologous and heterologous competition studies. When the kinetics of the unlabeled compound of interest are sufficiently rapid such that its plasma, free tissue, and bound concentrations do not demonstrate any dynamic lag they can be considered in equilibrium at all times. Under these conditions, the relationship between the target occupancy (Occ) and the plasma concentration of the unlabeled compound of interest can be described by
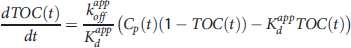
Indirect PK-RO model. Compounds with a dynamic lag between plasma and target bound concentrations exhibit pharmacological hysteresis and require a more comprehensive model that properly accounts for this lag.11,12 In this case the model is said to be indirect. An indirect PK-RO model can be applied to homologous and heterologous competition studies. Such indirect models have been considered previously in the literature10,15 and can describe the observed time occupancy curve (TOC(t): fractional occupancy at time t) as a function of the drug concentration by
MATERIALS AND METHODS
Study Design
[ 11 C]GSK189254 PET scans were carried out in one adult female baboon (Papio Anubis, ~15 kg) at the Yale PET Center following Institutional Animal Care and Use Committee (IACUC) approval. On each scanning day, the fasted baboon was immobilized with ketamine (10 mg/kg i.m.), glycopyrrolate (0.005 to 0.01 mg/kg i.m.) and anesthetized with 1.5% to 2.5% isoflurane via an endotracheal tube. Vital signs were monitored every 15 minutes and the temperature was kept constant at ~37 °C with heated water blankets. An i.v. catheter was inserted for administration of fluids, drugs, and the PET radiotracer [ 11 C]GSK189254 and an arterial catheter was inserted for blood sampling. Nine scans were acquired in total over five scanning sessions performed on separate days. At least 7 days were allowed between each of the scanning sessions for animal recovery and drug clearance. Sessions 1, 2, and 3 consisted of a baseline scan (tracer administration of [ 11 C]GSK189254) followed by a nontracer scan at high (session 2), medium (session 1), and low (session 3) SA. The time between the end of the baseline scan and the beginning of the nontracer scan for sessions 1, 2, and 3 was 2.7, 0.8, and 1.7 hours, respectively. For session 4, 1.5 μg/kg of unlabeled GSK189254 was administered i.v. and followed by two tracer scans starting at 1 and 6 hours postadministration. For session 5, 1.5 μg/kg of unlabeled GSK189254 was administered i.v. and followed by a tracer scan at 15 hours.
Using estimates of the GSK189254 affinity obtained previously in humans, 16 the coadministered unlabeled dose was initially selected for scan 2 in session 1 so as to achieve a target occupancy of ~50% in the baboon (0.08 μg/kg). Occupancy estimates from session 1 were then used to adjust the concentration of unlabeled GSK189254 on the subsequent scanning sessions to achieve low (0.035 μg/kg) or high (0.37 μg/kg) levels of target occupancy.
Radiochemistry
Production of [ 11 C]CO2 was initiated with the 14 N(p,α) 11 C nuclear reaction by bombarding, with a proton source, a mixture of nitrogen with oxygen (0.5% to 1%) in a high pressure target using the GE PETtrace cyclotron. The target was routinely irradiated with a proton beam current of 55 μA for 30 minutes and provided about 111 GBq of [ 11 C]CO2 at the end of bombardment.
The [ 11 C]CO2 was then transferred into a GE MicroLab methyl iodide production module or a GE TRACERLab FxC-Pro module installed inside a hot cell and trapped in a mixture of nickel with a molecular sieve. Hydrogen was then passed through the catalyst and reacted with [ 11 C]CO2 to afford [ 11 C]CH4, which was converted to [ 11 C]MeI by reaction with iodine at high temperature (720 °C). Radiolabeling was performed in a Bioscan AutoLoop by trapping [ 11 C]MeI in a stainless steel tubing loop containing a solution of desmethyl GSK189254 (0.3 to 0.5 mg) and 1 mol/L KOH (2 to 4 μL) in DMF (0.1 mL) and then reacted at ambient temperature for 5 minutes. Radiochemical yield was 6.1% ± 1.5% (decay-uncorrected, based on [ 11 C]MeI), with SA 477 ± 204 GBq/μmol at end of synthesis (n = 10). Radiochemical purity of the final product was >95%.
Data Acquisition
The animal's head was positioned in the ECAT EXACT HR+ PET scanner (Siemens/CTI, Knoxville, TN, USA) using a custom-designed stereotaxic head holder. A transmission scan was obtained to allow for attenuation correction. [ 11 C]GSK189254 was then administered (134 ± 50 MBq) intravenously as a bolus over 3 minutes and dynamic emission data were acquired for 2 hours (33 frames). Data were corrected for attenuation, randoms, scatter, and deadtime, and reconstructed using an attenuation-weighted OSEM algorithm. 17
A structural T1-weighted magnetic resonance (MR) image of the baboon brain was also acquired to assist with anatomical localization of regions of interest. A T1-weighted coronal MR imaging sequence was used on a 3-T scanner (echo time (TE) = 3.34, repetition time (TR) = 2,530, 176 slices, slice thickness = 0.54 mm, flip angle = 7 degrees, image matrix = 256 × 256, pixel size = 0.5 × 0.5, field of view (FOV) = 140 mm, 3D turbo flash).
During each PET scan, 21 manual arterial blood samples were drawn to allow measurement of whole blood and plasma radioactivity and the parent fraction in plasma. In each scan, before injection of the radiotracer, a sample of fresh blood was collected to measure the radiotracer plasma-free fraction (fp) via ultrafiltration (Centrifree Micropartion Devices No. 4104 by Amicon, Dovers, MA, USA).
Analysis of the unchanged parent compound and its metabolites in arterial plasma samples collected at 6, 20, 40, 60, and 90 minutes after injection was performed by using a column-switching HPLC (high-performance liquid chromatography) assay. 18 The parent compound retention time was around 13 minutes after injection. All the HPLC eluent was collected in fractions by an automated Spectrum Chromatography CF-1 fraction collection device. The counts of fractions were volume and decay corrected. The unmetabolized parent fraction was calculated as the ratio of the sum of radioactivity in the fractions containing the parent compound to the total amount of radioactivity collected. This fraction curve was also corrected for the time-varying extraction efficiency of radioactivity in corresponding filtered plasma samples. The fractions were then normalized to the recovery rate, which was determined by a reference plasma sample.
Additional arterial plasma samples were collected during scanning sessions 4 and 5 to assess the concentration of unlabeled GSK189254. Samples were collected at 5, 15, 30 minutes and 1, 2, 3, 5, 8, 14, 15, 17, and 18 hours postadministration of 1.5 μg/kg of unlabeled GSK189254 and stored at −80°C for later analysis. Samples were analyzed by HPLC/MS/MS with a lower quantification limit of 20 pg/mL.
Data Analysis
Image analysis. Intermodality registration (MRI-to-PET) was performed using the automated image registration algorithm 19 as an initialization step, followed by registration with NMI (normalized mutual information) to transform MRI into PET space. A baboon MRI template was also nonlinearly warped into the individual PET space via nonlinear registration (NMI-based linear plus nonlinear registration) to the subject's MRI. The template was created by averaging five individual baboon MRI images that were spatially normalized using a NMI-based linear plus nonlinear registration. Template regions for striatum, insula, and cerebellum, representing high, medium, and low uptake regions respectively, were applied to the dynamic PET data to generate regional TACs.
Input function. Arterial plasma activity samples were fitted to a model consisting of linear interpolation before the peak and a nonnegative sum of exponentials after the peak resulting in a continuous representation of the total arterial plasma activity. The parent fraction was fitted using a single exponential plus a constant model. The parent plasma input function was calculated as the product of the total arterial plasma curve and the fitted parent fraction curve. Whole blood samples were linearly interpolated to generate a continuous function. Due to technical difficulties, arterial blood samples were not collected for scan 2 in session 1. To avoid losing the scanning session, the data were analyzed using the baseline input function from the same scanning session, scaled for the difference in injected dose.
Estimation of in vivo affinity. The GSK189254 in vivo affinity was estimated using the methods presented in the Theory section (except the pseudoequilibrium method was excluded due to the lack of a reference region). For the MI method, the coinjection data obtained during the medium, high, and low SA sessions were used to obtain three independent estimates of Kappd (one for each scanning session). Within a given scanning session, the implementation of the MI method consisted of fitting simultaneously the striatum, insula, and cerebellum, for baseline and coinjection scans, and constraining the value of kon, koff and the nondisplaceable volume of distribution VND to be the same across all regions. Therefore, for each MI scanning session (medium, high, and low SA) one estimate of Kappd and three estimates of Bavail (striatum, insula, and cerebellum) were obtained.
The Direct PK-RO model was implemented in two different ways. First, equation 5 was used to relate VT and the unlabeled GSK189254 plasma concentration; this method is referred to as ‘Direct-VT’ . Regional VT values were estimated using one- or two-tissue compartment models with the metabolite-corrected arterial input function. The appropriate tracer compartmental model was determined by the Akaike model selection criteria. For scanning sessions 1, 2, and 3, where the unlabeled plasma concentration of GSK189254 was not directly measured, plasma activity and SA measurements were used to estimate the unlabeled GSK189254 plasma concentration 1 hour after injection. Equation 5 was then fitted simultaneously to striatum, insula, and cerebellum VT values as a function of the GSK189254 plasma concentration, constraining the value of VND and Kappd to be the same across all regions, with individual estimates of BPBaselineND for each region. Second, equation 3 was used to fit the TOC using the measured plasma concentration during scanning sessions 4 and 5 at 1, 6, and 15 hours after administration of 1.5 μg/kg GSK189254; this method is referred to as ‘Direct-TOC’ . Here, the TOC at 1, 6, and 15 hours was estimated using the occupancy plot analysis 20 using average baseline VT values (from sessions 1, 2, and 3) and the VT values postdrug administration. Finally, the Indirect PK-RO model (Equation 6) was applied to the TOC and plasma data, obtained from scanning sessions 4 and 5, to obtain a separate estimate of the affinity.
Simulations. Due to the impracticality of testing a large number of compounds with a broad range of kinetic properties, computer simulations were used to explore a wide range of compound kinetics and assess their impact on the estimation of affinity using both direct and indirect PK-RO models.
Using the nonlinear model equations (equations 1 and 2), a simulated set of TOCs was generated covering a range of parameter values (koff: 1 × 10⁻⁴ to 0.02 min−1, Kd: 0.01 to 0.4 nmol/L and k2: [0.01 0.1 1] min−1). The measured arterial plasma time course of unlabeled GSK189254 obtained after the 1.5 μg/kg dose (sessions 4 and 5) was used as the input function and kon was reparameterized as ss.
The TOC was defined as CS(t)/Bavail (for t = 1, 6, and 15 hours) with Bavail arbitrarily fixed at 1 nmol/L. Kd was determined by fitting either the Direct or Indirect model to the simulated TOCs using the same GSK189254 input function. Differences in the estimated Kd from the true value were investigated as a function of koff, Kd, and k2 for both models. While koff and Kd control the kinetics of the compound at the target site, k2 was used to control the kinetics of the compound at the plasma–tissue interface. High values of k2 (1 min−1) resulted in rapid quasi-equilibrium between plasma and free tissue concentration (<15 minutes) while low values of k2 (0.01 min−1) produced much longer equilibration times (~30 hours). The simulated nondisplaceable volume of distribution VND (= K1/k2) was fixed to 1 mL/cm3 to allow only k2 to control the plasma–tissue dynamic.
The relationship between the Direct PK-RO model fit and the simulated target occupancy data was characterized by the goodness-of-fit (sum of squared error—SSE). The SSE was explored as a function of koff, Kd, and k2 for both models.
In the simulations described above, the duration of the study is defined as the time of the last simulated TOC sample (15 hours postdrug). To investigate the impact of study duration (Td) on the estimates of koff and Kd, a range of study durations were simulated (Td = 1 to 24 hours) with two TOC samples (at Td/2 and Td hours) and these data were fit to the direct and indirect models.
RESULTS
All scans in the protocol were completed and no adverse events were observed due to the administration of GSK189254. An average of 7.0 ± 0.2 ng/kg of radioligand mass was injected during the tracer scans. Model fits obtained for scan 2 in session 1, where a scaled version of arterial blood activity was used, provided VT estimates that were consistent with the rest of the data set.
The two-tissue compartment model with fixed blood volume (Vb = 0.05) was the most parsimonious model (as determined by the Akaike information criteria—AIC) for all regions and scans. The average plasma-free fraction was 0.62 ± 0.02. Under the assumption of passive diffusion 14 and using the average VND estimated from all the methods applied (VND = 2.9 ± 1.1 mL/cm3), the estimated fND was 0.21. The average baseline VT values (n = 3) for the striatum, insula, and cerebellum were 95 ± 8, 67 ± 7, and 40 ± 2 mL/cm3, respectively, which are consistent with previous reports in primates and humans.16,21
A summary of target occupancy estimates derived from the slope of the occupancy plot are shown in Table 1.
Target occupancy for all scanning sessions measured from the occupancy plots using the striatum, insula, and cerebellum
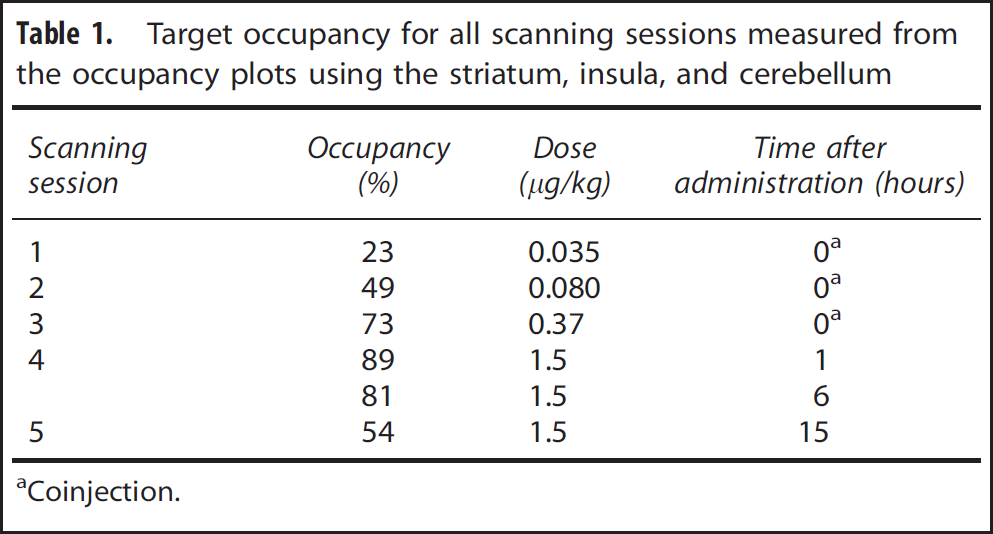
Coinjection.
Multiple Injection Method
The striatum, insula, and cerebellum were fitted simultaneously, generating individual estimates for Bavail and a single value for Kappd. The coefficient of variation for Kappd estimates decreased as the coinjection SA decreased (40%, 31%, and 24% for high, medium, and low SA) and this pattern was replicated for Bavail (>20% for high and between 10% and 5% for medium and low SA). The estimated VND for the three coinjection scanning sessions was 2.01 ± 0.2 mL/cm3.
Table 2 shows a summary of the coinjection parameter estimates obtained from the application of the MI method to scanning sessions 1, 2, and 3.
Parameter estimates (equilibrium dissociation constant and available receptor density) obtained using the MI method
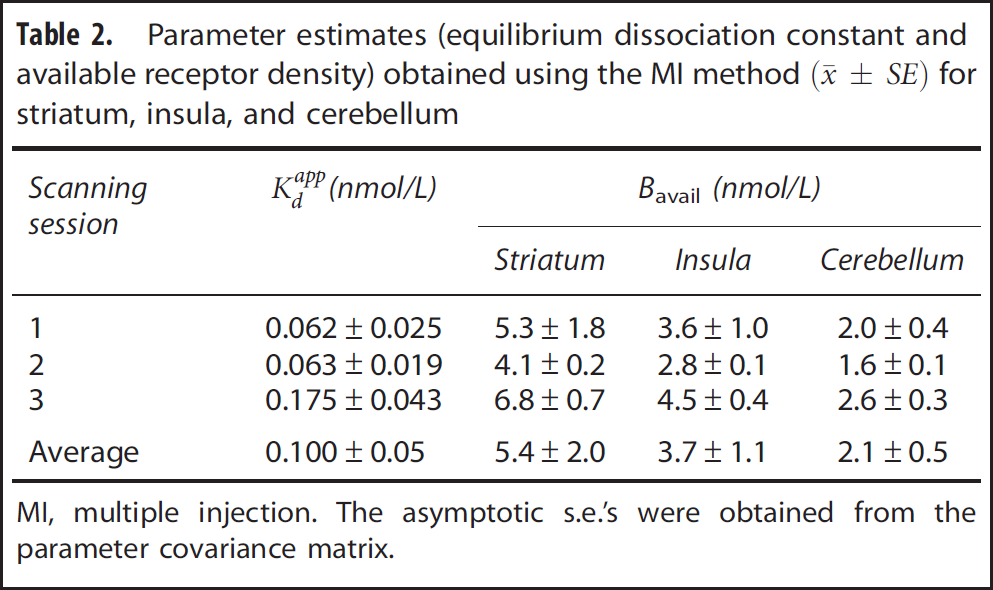
MI, multiple injection.
The asymptotic s.e.'s were obtained from the parameter covariance matrix.
Direct-VT PK-RO model
Figure 1 shows the fits of the direct PK-RO model to VT using equation 5. The striatum, insula, and cerebellum data were fitted simultaneously with regional values of BPND for each region and common values for Kappd and VND. The estimated Kappd was 0.05 ± 0.02 nmol/L, for Bavail (= Kappd BPBaselineND/fND)) the values were 5.5 ± 1.8 nmol/L, 3.6 ± 1.3 nmol/L, and 2.0 ± 0.9 nmol/L for striatum, insula, and cerebellum, respectively, and VND was 4.4 ± 5.2 mL/cm3.
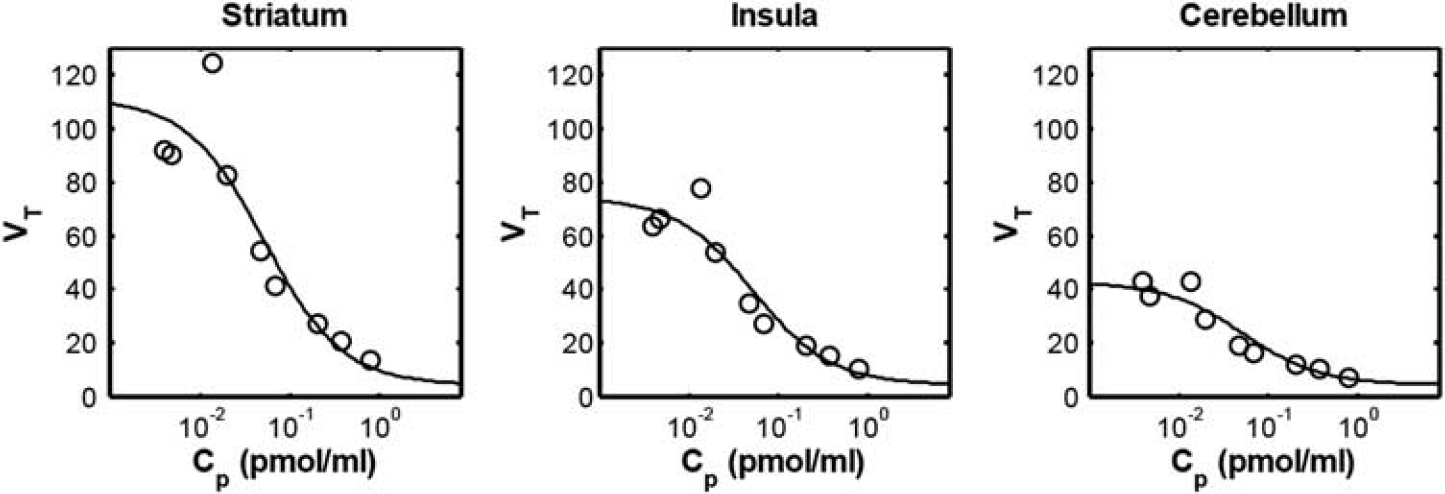
Direct model applied to three different brain regions. Open circles are the estimated VT values. Solid line is the Direct PK-RO model fit. VND and Kappd were constrained across the three regions.
Indirect and Direct-Time Occupancy Curve PK-RO Model
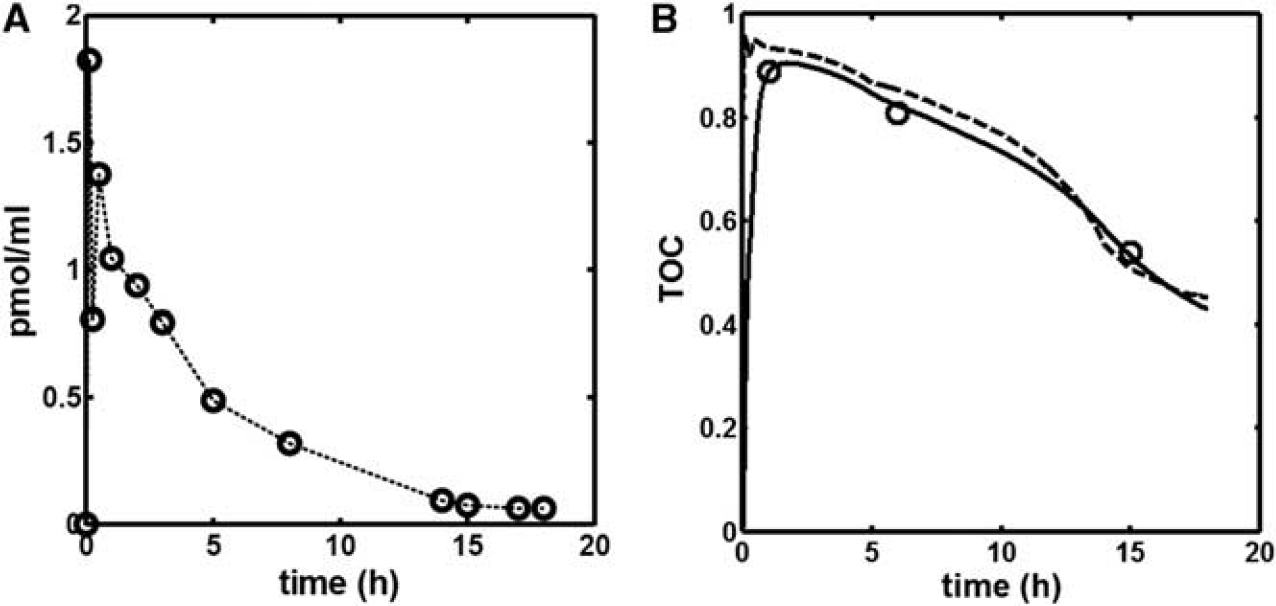
The time course of the unlabeled GSK189254 plasma concentration obtained during scanning sessions 4 and 5 following the administration of 1.5 μg/kg of unlabeled GSK189254 is shown in Figure 2A. The concentration peaks at ~5 minutes (1.8 nmol/L) with a terminal half-life of ~4 hours. Figure 2B shows the Indirect-TOC model fit (continuous line) to the target occupancy measurements at 1, 6, and 15 hours after administration of 1.5 μg/kg unlabeled GSK189254. For comparison, the Direct-TOC model fit (dashed line) is also shown.
(
PK-RO model estimates of the GSK189254 affinity were Kappd = 0.073 ± 0.018 nmol/L (Direct x ± SE) and Kappd = 0.101 ± 0.005 nmol/L (Indirect x ± SE) where the standard errors (s.e.) were derived from the parameter covariance matrix obtained from the fitting procedure. Model selection criteria indicated that the Indirect model was preferred (AIC: -17 Direct versus −24 Indirect and F test P = 0.05).
Table 3 shows a summary of the estimated equilibrium dissociation constants in the baboon across all different analysis methods.
Summary of GSK189254 Kd and Kdapp estimates obtained from four different analysis methods
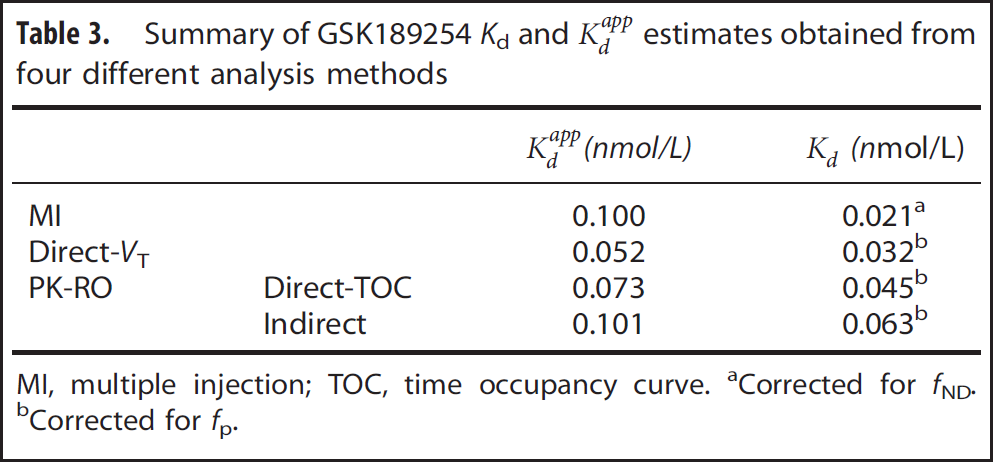
MI, multiple injection; TOC, time occupancy curve.
Corrected for fND.
Corrected for fp.
Simulations
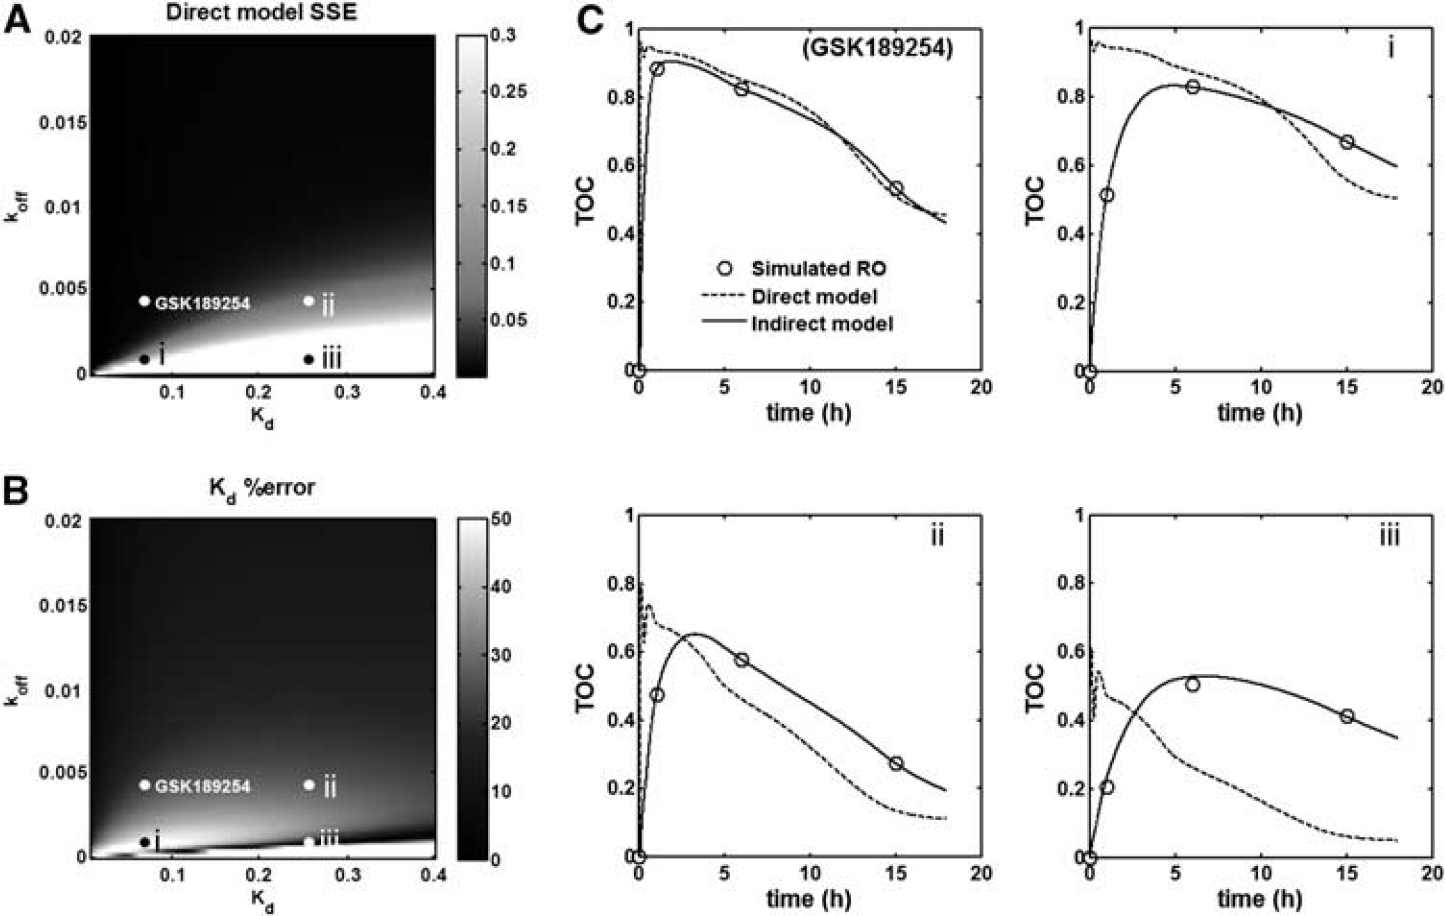
Figure 3A displays the SSE for the Direct PK-RO model as a function of Kd and koff for a fixed value of k2 = 1 min−1. As a general rule, the error for the Direct model was low when koff values were high, that is, little lag between plasma and target bound concentrations, but this error became substantial as koff becomes small, that is, substantial lag between plasma and target bound concentrations. The SSE obtained with the Indirect PK-RO model was consistently lower than that obtained with the Direct model across the full Kd–koff space, indicating that the Indirect PK-RO model always described the data better. In Figure 3B, the estimated error for Kd with the Direct model is shown as a function of Kd and koff. The low-error region with koff values smaller than 0.005 min−1 (dark stripe in the lower part of the figure) corresponds to an artifact where the Kd is estimated correctly whilst the model fit is poor.
(
Slower rates of equilibration between plasma and tissue, as simulated by decreasing values of k2, showed a similar pattern to those shown in Figure 3A with a worsening of the Direct PK-RO representation of the data accompanied by a poorer estimation of Kd. For example, when the simulated Kd and koff were identical to the ones estimated from the GSK189254 in vivo study, the direct model SSE increased ~3-fold for k2 = 0.1 and ~53-fold for k2 = 0.01 as compared with k2 = 1. Figure 3C shows four examples of the Direct and Indirect model fits to the simulated data. Each plot corresponds to points depicted in Figures 3A and 3B. The GSK189254 plot was obtained using the koff and Kd estimates obtained from the in vivo GSK189254 experiment. In (i) the value of koff is fourfold smaller than in the GSK189254 plot. In (ii) Kd is fourfold larger than in the GSK189254 plot. Plot (iii) is an example where the Direct model correctly estimates Kd but the model fit is poor. In all these examples, the Indirect PK-RO model accurately estimates the Kd.
Figure 4 shows the effect of the study duration (Td) on Kd %bias for the direct and indirect models for three different values of koff (0.001, 0.005, and 0.01 min−1 in A, B, and C, respectively). The values for k2 and Kd were fixed at 1 min−1 and 0.06 nmol/L, respectively. In general, for the indirect model, the smaller the value of koff (increased lag between plasma and target bound concentrations) the longer the time needed to accurately estimate the true simulated Kd (e.g., ~5 hours for koff = 0.001 min−1 and only ~1 hour when koff = 0.01 min−1). In contrast, with the exception of coincidental cases similar to those observed in Figure 3, the direct model always produced biased estimates of Kd independent of the study duration.
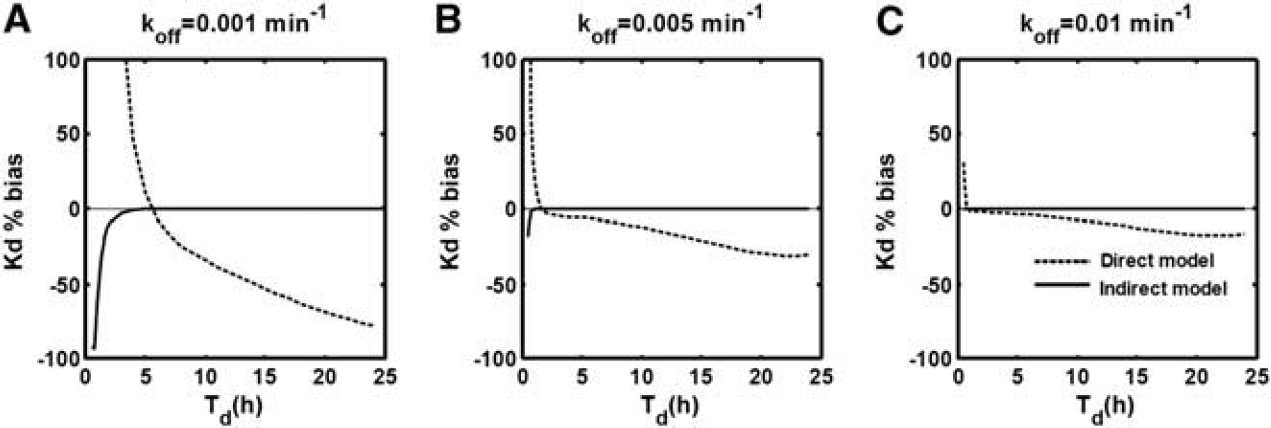
Effect of the study duration (Td) on the accuracy of direct (dashed line) and indirect (solid line) estimates Kd for three different values of koff; (
DISCUSSION
Estimation of the in vivo affinity of compounds has an important role in the development of novel drugs that bind reversibly to specific molecular targets in the brain. For example, an accurate estimation of in vivo affinity from early first time in human studies, in conjunction with knowledge of the desired target occupancy, facilitates optimal dose selection for larger clinical trials. In the PET field, accurate measurement of the in vivo affinity can also be important in providing confidence that mass dose effects are not present.
Positron emission tomography methods for the estimation of in vivo affinity can be grouped into two categories: (1) those applicable only to homologous competition studies and (2) those applicable to both homologous and heterologous competition studies. When the compound of interest is itself radiolabeled with a PET isotope and possesses a quantifiable specific signal, homologous competition studies can be performed and analyzed to estimate the affinity of the compound. However, more usually, the labeled compound does not possess suitable characteristics to allow quantification of the specific signal. In these cases, one must rely on an established PET radioligand that binds to the same target as the compound of interest and measure changes in the PET signal due to heterologous competitive binding between the radioligand and the unlabeled compound of interest. These data can then be analyzed by direct or indirect PK-RO methods described here. In addition, these PK-RO methods can be applied to homologous competition studies (as has been done here with GSK189254 as part of this investigative work).
All these methods, whether applied to homologous or heterologous competition, characterize the pharmacokinetic relationship between plasma (or a surrogate measurement of free tissue concentration in the case of the transient equilibrium method) and target bound concentrations of the unlabeled compound of interest to estimate its in vivo affinity. However, each method makes different assumptions about the rate of exchange between different compartments in its transit between plasma and the target and vice versa. Consequently, it is possible to obtain incorrect estimates of the in vivo affinity if the assumptions made by the model are invalid. In particular, if the compound displays pharmacological hysteresis and the model does not allow for a dynamic lag between plasma and target bound concentrations then the affinity estimates will be invalid. For example, the MI method treats the BBB transit and the binding process separately. When the injection protocol is appropriately optimized,6,22 these two processes can be isolated making it possible to estimate the affinity of the compound. On the other hand, with the pseudoequilibrium method, although the relationship between the surrogate bound concentration (obtained by subtracting the target and the reference TACs) and the free tissue concentration arises from an equilibrium condition, differences between the true and surrogate bound concentrations can lead to errors in the estimated affinity. The application of the direct PK-RO method to heterologous competition assumes that the plasma and bound concentration are in instantaneous equilibrium at all times and ignores any finite exchange processes in BBB transport and target binding. The indirect PK-RO model tries to address these limitations by introducing a finite exchange process for the target binding while the BBB transit is assumed to equilibrate instantaneously. Although a more comprehensive heterologous method could be defined along the lines of the MI model that accounts for both BBB transit and target binding, the limited data obtained during a heterologous type of study (usually two or three occupancy time points) would make it difficult to kinetically separate BBB transit and target binding.
In our hands, the four different analysis methods produced similar subnanomolar affinity estimates of GSK189254 in the baboon study (Table 3). Model selection criteria did indicate a preference for the Indirect over the Direct PK-RO model; however, the difference in Akaike score was modest and the F test indicated only a borderline improvement. These results suggest that the dynamic lag between plasma and target bound concentrations of GSK189254 was small in baboon and that the application of models that do not account for pharmacological hysteresis are relatively unbiased.
Computer simulation allowed us to explore scenarios where there was an increased dynamic lag between plasma and target bound concentrations to investigate the impact on Kd estimation. The equilibration rate between plasma and tissue across the BBB, which is not explicitly considered in the Indirect PK-RO model, was modified via k2 with smaller values producing longer equilibration times, whilst the equilibration rate between tissue and target was modified via koff and Kd. Figure 3A and 3B show the performance of the Direct PK-RO model when k2 is fixed (1 min−1). As expected, for smaller koff or larger Kd values, which increase the dynamic lag between plasma and target bound concentrations, there was an increasingly poor prediction of the target occupancy (Figure 3A). The pattern observed in Figure 3B showed a region of small differences between the estimated and the true Kd (dark area below values of 0.005 min−1 for koff) that represents an artifact for cases in which the equilibrium dissociation constant is correctly predicted in spite of significant data-model mismatch.
For the Indirect PK-RO model, when plasma and free tissue concentrations could be considered in equilibrium at all times (k2 = 1), the model always described the simulated TOC correctly (small SSE values) regardless of the simulated value of koff or Kd and consequently the Kd was accurately estimated (mean(|Kd %bias|)~1%) except when the simulated koff value approached 0. The simulations also showed that when there was little dynamic lag between plasma and target bound concentrations (represented by increasing values of koff) the estimation of koff becomes inaccurate, suggesting that the processes of dissociation from the target and tissue clearance cannot be identified by the indirect model when they are kinetically similar or when the plasma clearance is the limiting factor.
Examples in Figure 3C show that the Indirect PK-RO model always described the TOCs correctly even when a substantial lag exists between plasma and target bound concentrations, while the direct PK-RO model fails when koff is small and/or when Kd is high. The rate of equilibration between plasma and tissue (effect of k2) was also investigated for the indirect PK-RO model. Slower rates of equilibration between plasma and tissue (k2 = 0.1 and 0.01 min−1) had a small impact on the Kd estimates with an average bias of ~10% for the smallest value of k2. However, a substantial impact on the accuracy of the koff estimates was observed when the equilibration between plasma and tissue was slow (from ~10% for k2 = 1 min−1 increasing to ~80% for k2 = 0.01 min−1).
Simulations investigating the impact of study duration (Td) on the accuracy of Kd estimates revealed that the indirect model was able to accurately recover the Kd unless the kinetics of the compound were particularly slow or Td was too short such the TOC appeared irreversible with respect to the plasma concentration. It should be noted that the choice of doses and times at which the TOC is sampled has an impact on the precision of the affinity estimates 23 but that this should not change these general findings. In contrast, the direct model repeatedly failed to recover the true Kd value (except for artifactual cases explained previously). Exploration of these data indicated that the direct model underestimates the value of Kd by a factor that depends on the terminal washout of the free concentration (Kdirectd = (koff – β)/kon) where β is the terminal washout rate of the free concentration. This is analogous to errors introduced in the quantification of a PET partition coefficient (VT) from the ratio of nonequilibrium tracer data. 24
In summary, noise-free computer simulations have demonstrated that the indirect PK-RO model is a robust approach for the estimation of Kd even under conditions of pharmacological hysteresis. When the drug–target interaction is the rate-limiting process, koff can also be estimated. It is beyond the scope of this work to investigate the effects of noise in the plasma and occupancy measurements on the estimation of the model parameters; however, it is recognized that for the data presented, the indirect model estimates two parameters from three data points and as such the estimates have the potential to be sensitive to noise.
CONCLUSION
Positron emission tomography can achieve characterization of the in vivo pharmacokinetic properties of compounds that reversibly bind to molecular targets in the brain. Although the selection of the appropriate analysis method depends on study design factors (e.g., homologous versus heterologous competition and the presence or absence of a reference region), it is also important to consider the kinetics of the compound under investigation and select an appropriate biological model that may need to account for pharmacological hysteresis.
DISCLOSURE/CONFLICT OF INTEREST
The authors declare no conflict of interest.
Footnotes
ACKNOWLEDGEMENTS
The authors acknowledge the expert assistance of Krista Fowles, Shervin Liddie, Siobhan Ford, Christine Sandiego and the rest of the team at the Yale PET Center.