
Abstract
Understanding regulation of blood–brain barrier (BBB) is crucial to reduce/prevent its disruption during injury. As high brain complexity makes interpretation of
Introduction
The blood–brain barrier (BBB) constitutes a neurovascular unit formed by microvascular endothelial cells (ECs), pericytes, and perivascular astrocytes (Hawkins and Davis, 2005). The ECs of the BBB display a specialized phenotype characterized by the presence of tight junctions (TJs) that limit diffusion of water-soluble compounds from the blood to the brain tissue (Brightman and Reese, 1969). In addition, the barrier acts as a selective filter toward lipophilic molecules by expression of ATP-binding cassette (ABC) transporters in their luminal and abluminal compartments (Soontornmalai et al, 2006; Warren et al, 2009). Astrocytes have been well documented to induce barrier properties in brain ECs both
Disruption or dysfunction of the BBB constitutes a well-described hallmark of many neurologic diseases including Alzheimer's disease (Zlokovic, 2008), neuroAIDS (Banks et al, 2006), neuroinflammation (Engelhardt, 2008), Parkinson's disease (Zlokovic, 2008), and stroke (del Zoppo and Mabuchi, 2003; Kaur and Ling, 2008; Kulik et al, 2008; Lee et al, 2004). Elucidation of the cellular and molecular mechanisms by which vascular leakage is induced during disease is dramatically limited due to the major technical challenges faced when using
In this study, we have developed an innovative 3D BBB model based on collagen extracellular matrix (Koh et al, 2008; Ment et al, 1997). This model remarkably allows each cell of the BBB to display their unique morphology as occurs
Materials and methods
All experiments were performed in accordance with Swiss animal protection laws and University of Zürich institutional guidelines for animal experimentation.
Cell Culture
Rat brain endothelial cell line (RBE4; Roux et al, 1994) from passages 45 to 55 were cultured on gelatin-coated dishes (Corning Inc, Corning, NY, USA) as previously described (Al Ahmad et al, 2009). Primary rat astrocytes were isolated from neonatal pups as described previously (Chow et al, 2001). Primary rat brain pericytes were obtained from adult rat brains and isolated following the protocol established by Dore-Duffy (2003). Freshly isolated pericytes were cultured in Dulbecco's modified Eagle medium (DMEM) supplemented with 20% fetal bovine serum, 50 mg/mL gentamycin sulfate and 2.5 mg/mL amphotericin B until near confluency. Purity of all primary cultures was confirmed using cell-specific markers as previously described (Al Ahmad et al, 2009).
Collagen Matrix
Rat-tail collagen was extracted following a method established by Bell et al (1979). Briefly, rat-tail tendrils were sectioned, minced, and dissolved overnight at 4°C in 15 mmol/L acetic acid solution (Sigma-Aldrich, Buchs, Switzerland). Debris was removed by ultracentrifugation for 1 hour at 20,000
Three-Dimensional Cell Culture
The procedure for 3D cell culture is schematized in Figure 1A. In brief, collagen solution was mixed with 1/10th volume of 10 × Earle's balanced salt solution (Sigma-Aldrich) containing phenol red then neutralized with 1 N NaOH solution (Sigma-Aldrich). The ECs were added at a density of 5 × 10⁵ cells/mL in monoculture experiments. For coculture experiments, RBE4 cells, astrocytes, and pericytes were cultured in ratios that are estimated to occur
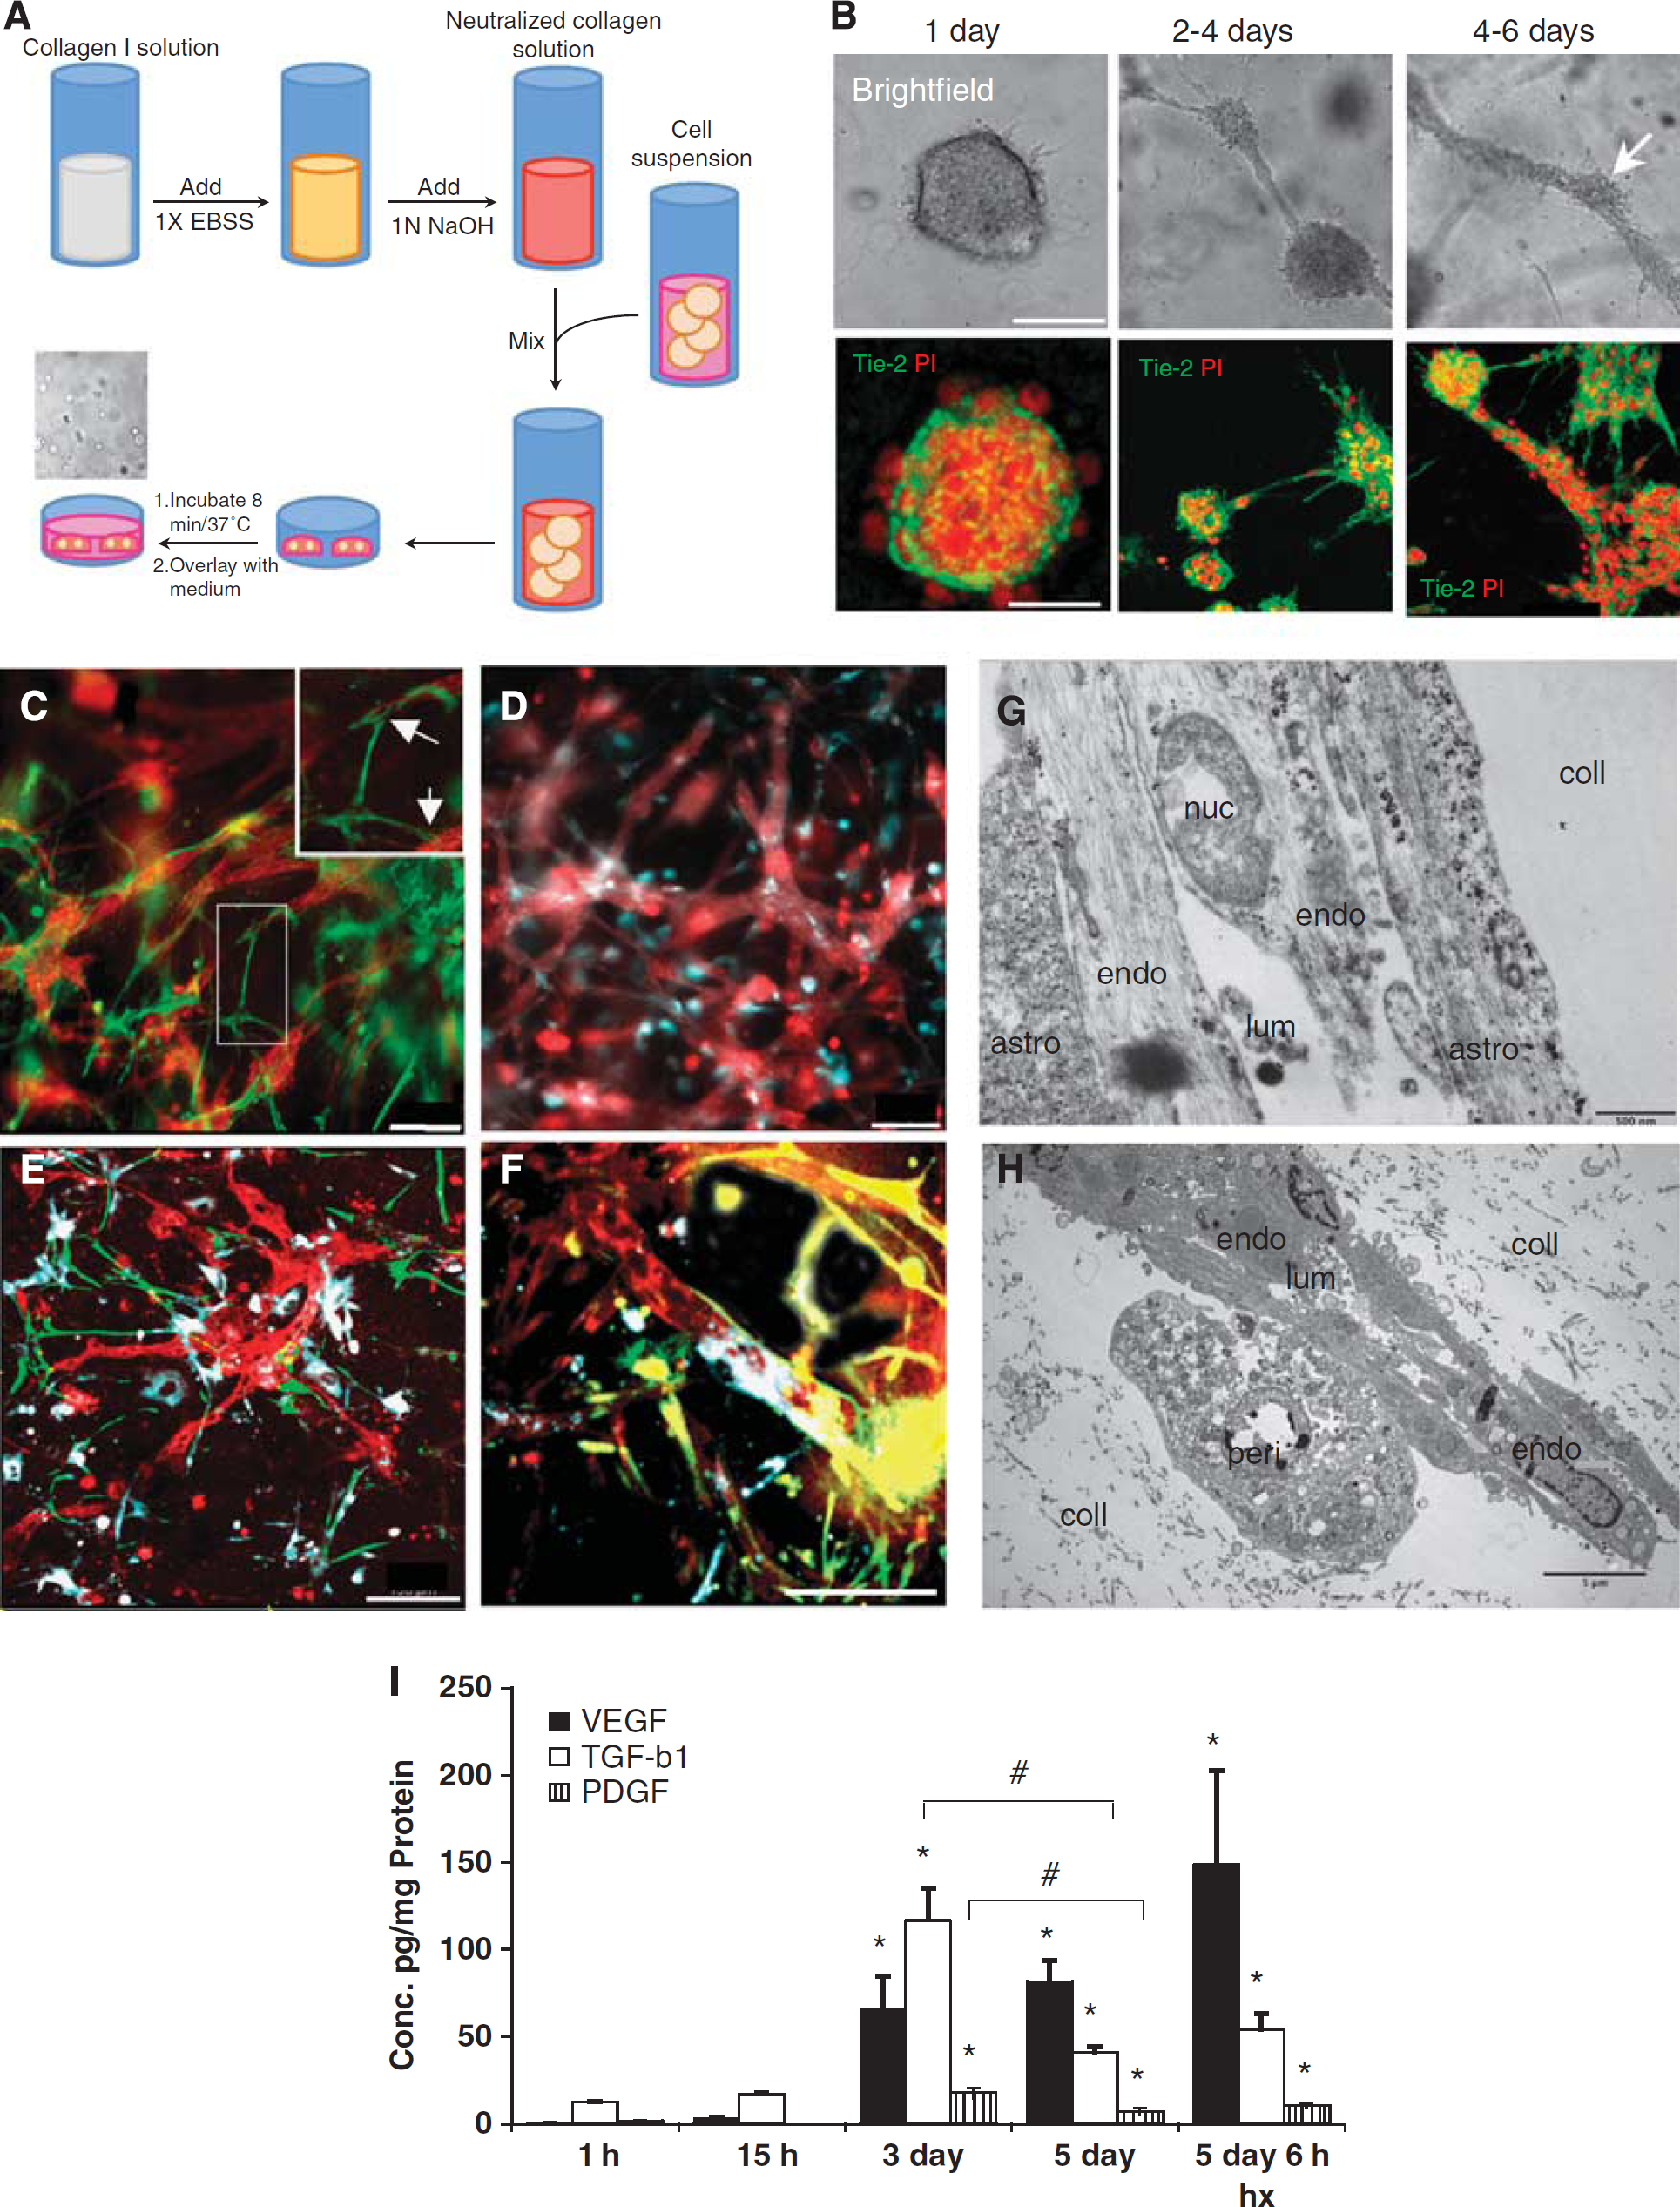
Collagen three-dimensional (3D) matrix supports tube formation, appropriate cellular interactions, and time-dependent expression of angiogenic molecules. (
Cell Density Determination
To facilitate cell counting, collagen matrix was dissociated by incubation for 20 minutes at 37°C in collagen digestion buffer (1 mg/mL collagenase, 0.1 mmol/L CaCl2, 1 mmol/L MgCl2). Cells were centrifuged for 5 minutes at 1000
Morphological Analysis
To determine tube number, length, and diameter, whole mounted collagen droplets were observed using inverted fluorescence microscope (Axiovert 200M, Carl Zeiss, Feldbach, Switzerland) in brightfield mode. Micrograph pictures were acquired with a × 10 objective using an 8-bit CCD camera (Axiocam HRm, Carl Zeiss) and processed using Axiovision 4.6 software (Carl Zeiss). The different features were determined using the measure tool included in Axiovision software package.
Enzyme-Linked Immunosorbent Assay Measurements
Quantitation of secreted levels vascular endothelial growth factor (VEGF), platelet derived growth factor (PDGF)-AB, and transforming growth factor (TGF)-β1 in culture media were performed using Quantikine ELISA kits (R&D Systems Europe, Abingdon, UK) according to the manufacturer's instructions. Optical densities were measured using a microplate reader (Multiskan RC; Thermo Labsystems, Helsinki, Finland) at 450 nm, with wavelength correction at 570 nm.
Quantitative Real-Time PCR
Total RNA was isolated directly from collagen droplets using TRIzol reagent (Invitrogen, Carlsbad, CA, USA). A measure of 2 μg of total RNA per sample was then reverse transcribed using the ImProm-II ReverseTranscriptase (Promega, Madison, WI, USA) according to the manufacturer's instructions. Quantitative real-time PCR was performed with an ABI 7500 Fast Real-Time PCR System using the Power SybrGreenPCR Master Mix (Applied Biosystems, Foster City, CA, USA). The following primers were used: fgf2, 5′-AACGGCGGCTTCTTCCTGCG-3′ and 5′-TGGCCTTCTGTCCAGGCCCC-3′; flt1, 5′-GCCGAGGACGCAGGGGACTA-3′ and 5′-GACAGGGGTGCCACAGCCAC-3′; gapdh, 5′-GAGGACCAGGTTGTCTCCTG-3′ and 5′-ATGTAGGCCATGAGGTCCAC-3′; vegfr2, 5′-ACACACAGCGAGCACCGAGC-3′ and 5′-GAGCGGAAGCGTGCCCCTTT-3′; tie2 5′-AAGGCCTCTGGCTGGCCACT-3′ and 5′-TTTGGGGCATGCAGGGGCTC-3′. All data were normalized to gapdh, and fold changes were calculated by the comparative
Immunocytochemistry
After 6 days of culture, droplets were washed with cold PBS and fixed with 4% paraformaldehyde solution then permeabilized with 0.1% Triton X-100 solution and blocked with 10% normal goat serum for 4 hours at room temperature. Droplets were incubated overnight at 4°C with primary antibodies raised against CD31 (1:100, Chemicon, Millipore, Zug, Switzerland); glial fibrillary acidic protein (1:100, Sigma-Aldrich), α-smooth muscle actin isoform (1:100, Sigma-Aldrich), zonula occludens-1 (ZO-1; 1:100, Invitrogen), claudin-5 (1:100, Invitrogen), β-catenin (1:100, Chemicon), Tie2 (1:100, Santa Cruz Biotechnology, Heidelberg, Germany), P-glycoprotein (P-gp; 1:100, Calbiochem, VWR, Dietikon, Switzerland), utrophin and multidrug resistant protein-2 antibodies (a gift from Dr JM Fritschy). Detection was performed using either Alexa-488 or Alexa-546-conjugated antibodies (Invitrogen). Because of the absence of a well-accepted pericyte-specific marker, to simultaneously observe all three cell types pericytes were prelabeled with DiD a farred fluorescent lipophilic dye (Invitrogen) following the manufacturer's instructions. Samples were observed using a Leica confocal microscope (Leica SP2, Leica Microsystems, Heerbrugg, Switzerland) and acquired with Leica Confocal Software. To obtain 3D image reconstructions, a stack of 70 to 80 micrograph pictures were acquired for each sample, maintaining a thickness of 0.5 μm between each focal plan, and processed by Imaris 6.0 software (Bitplane, Zurich, Switzerland). Image reconstruction also enabled creation of virtual
Transmitted Electron Microscopy
Droplets were fixed with 3% glutaraldehyde buffer, postfixed with 2% OsO4 buffer, and dehydrated with 70% to 100% ethanol-containing solutions. Dehydrated samples were embedded into Epon 813 resin (Epon, Hexion, Rotterdam, The Netherlands), and 70 nm slices were cut using a diamond-knife ultramicrotome. Sections were observed using a transmission electron microscope (CM-100, Philips Research, Eindhoven, The Netherlands). Micrograph pictures were obtained using a 12-megapixel digital camera (Gatan GmbH, München, Germany) and Digital Micrograph software (Gatan GmbH). Images were processed using ImageJ 1.41 (ImageJ, NIH, Bethesda, MD, USA).
P-Glycoprotein Activity Assay
P-glycoprotein activity was assessed by live imaging confocal microscopy based on (
O2 Deprivation Stress Experiments
Experiments were performed in a purpose-built hypoxic glove-box chamber (InVivO2 400, Ruskinn Technologies, Pencoed, UK) maintained at 37°C with 5% CO2. Culture droplets were exposed to 1% O2 for up to 48 hours.
Statistical Analysis
All results are expressed as mean ± s.d. of at least four or more independent experiments. Statistical significance was assessed using one-way and two-way analysis of variance.
Results
The Three-Dimensional Collagen Matrix Supports Endothelial Tubulogenesis and Appropriate Multicellular Cellular Interactions
The RBE4 cells exhibit vasculogenic and angiogenic-like features when cultured inside a 3D collagen matrix (Figure 1B). In the collagen matrix, RBE4 quickly formed multicellular cysts within 24 hours of culture (upper panels), rapidly followed by formation of intercystal connections by Day 2. After 4 days of culture, these intercystal connections changed morphology and were progressively replaced by thicker tubular structures denominated as ‘tube-like structures.’ These tubes displayed longer and thicker processes than intercystal connections, but also presented branching processes (see Supplementary Figure S1). An examination of the different structures using different fluorescent cellular markers (Figure 1B) revealed that such features were multicellular complexes. In conclusion, 3D collagen-based matrices allow cell motility and also support tubulogenesis of these cells.
We next cocultured RBE4 cells with astrocytes and pericytes and examined cell morphology using cell-specific markers (Figures 1C–1F). The presence of either astrocytes (Figure 1C) or pericytes (Figure 1D) did not interrupt formation of endothelial tube-like structures. Indeed, astrocytes cocultured with RBE4 cells formed processes (green, and arrows in high power insert) that contacted the EC tubes (red), whereas pericytes rather appeared to overlap them with their whole cell bodies (blue). The presence of both astrocytes and pericytes (Figures 1E and F) did not interfere either with the endothelial tubulogenesis or the cellular interactions. Electron microscopy on these cocultures (Figures 1G–1H) revealed that astrocyte processes (Figure 1G) and pericytes (Figure 1H) physically contacted the RBE4 tubes. Notably, we observed the presence of a lumen within the tubes confirming the structures as analogous to
Expression Profiles of Angiogenic Factors During Three-Dimensional Culture Development
To confirm that our model reproduces expression profiles associated with angiogenesis
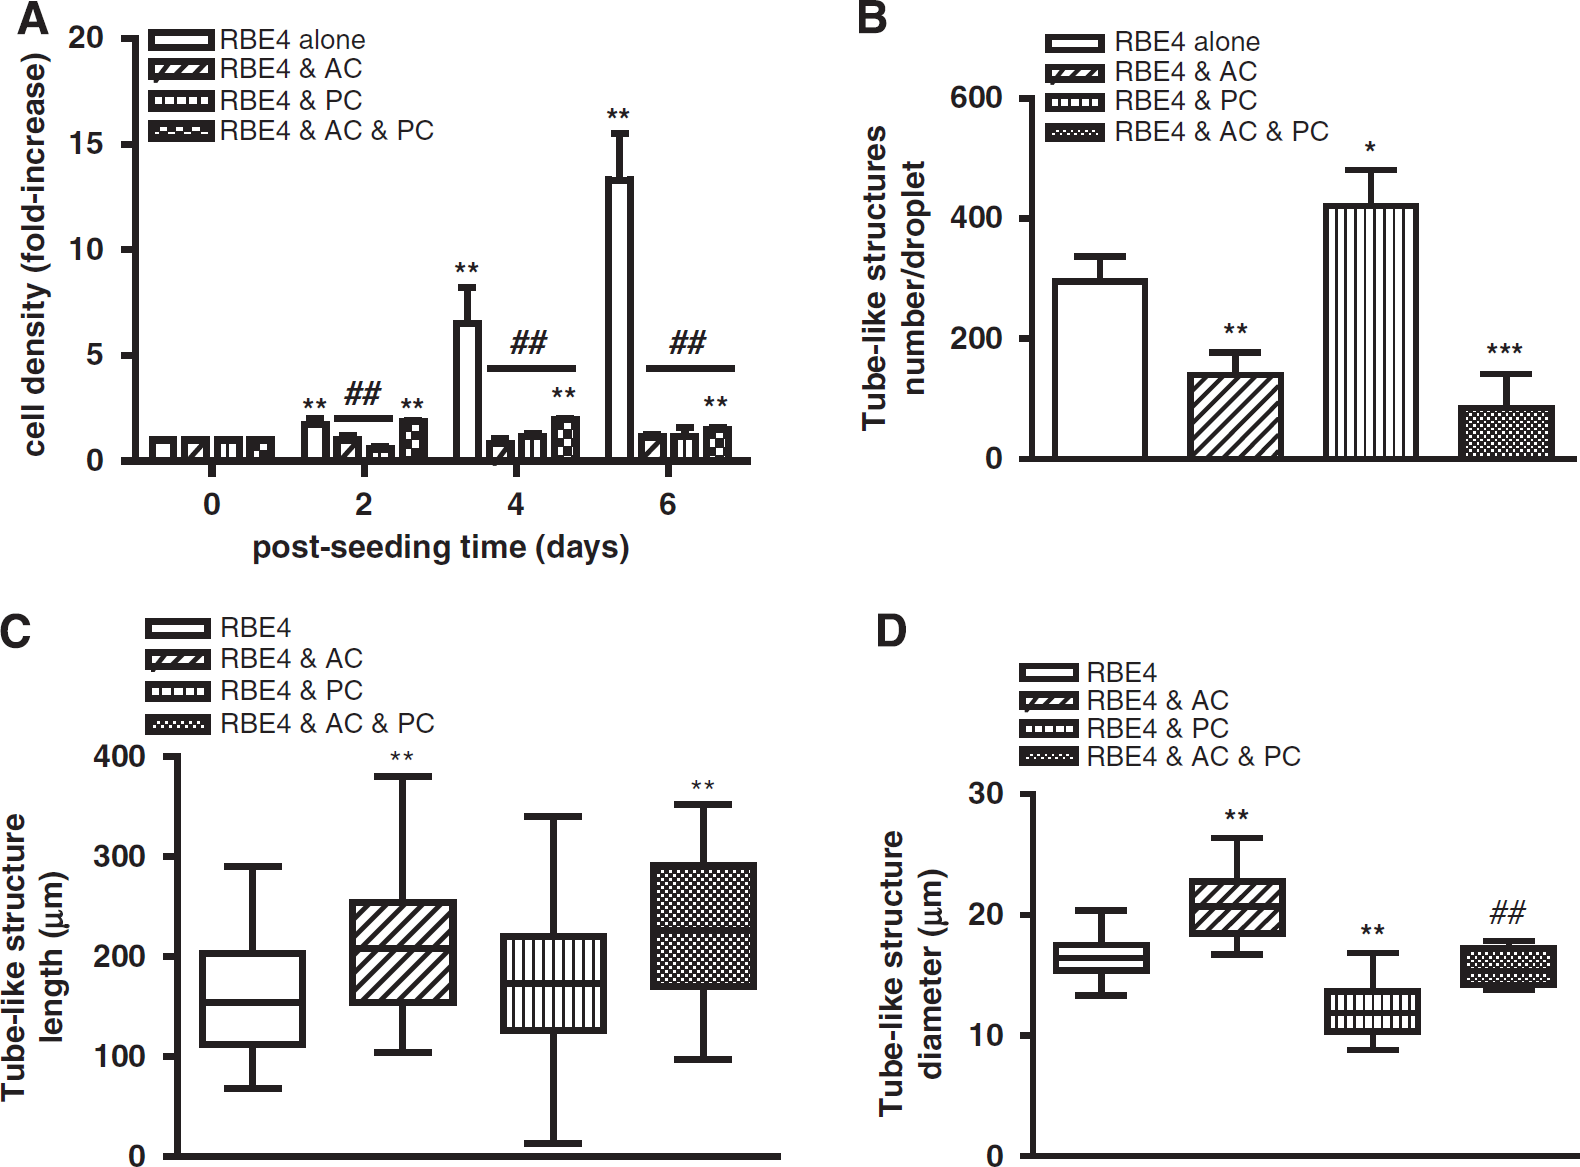
Astrocytes (AC) and pericytes (PC) differentially modulate RBE4 tube morphogenesis. (
Astrocytes and Pericytes Oppositely Regulate EC Angiogenesis
The RBE4 cells cultured alone proliferate very rapidly within the collagen matrix, resulting in an increase of up to eightfold over 6 days of culture. Whereas pericyte monocultures also proliferated within the matrix, albeit it not as rapidly as RBE4 cells, astrocytes did not (see Supplementary Figure S3). Surprisingly, coculture of either astrocytes or pericytes with RBE4 completely abolished EC proliferation during culture (Figure 2A), although the presence of both cells partially supported proliferation. To evaluate the impact of both cells on tube formation, we quantified alterations in the number, length, and diameter of tube-like structures during culture genesis (Figures 2B–2D). Astrocyte coculture significantly reduced the number of tubes formed by > 50% compared with RBE4 monocultures, indicating that astrocytes prevent the angiogenic-like process (Figure 2B). In contrast, pericytes increased tube numbers by ~40%, indicating a predominantly proangiogenic role. The three-cell cocultures also had a strong inhibitory effect, suggesting that overall astrocytes dictate the EC angiogenic rate. Although astrocyte coculture limited the number of tubes, tube length was significantly increased (Figure 2C) compared with monocultures (median values of 208.7 and 154.3 μm, respectively). Pericytes alone had no effect, but the presence of both cells produced the longest tubes (median value of 227.0 μm). Astrocyte coculturing also increased tube diameter compared with ECs alone (20.53 μm versus 16.55 μm respectively), in contrast to pericytes (11.88 μm; Figure 2D). The presence of both cells resulted in diameters reminiscent of RBE4 monocultures (15.40 μm), indicating inhibition of both astrocyte and pericyte effects. Thus, coculturing blunts the pericytic proangiogenic effect seemingly tipping the balance in favor of astrocytes.
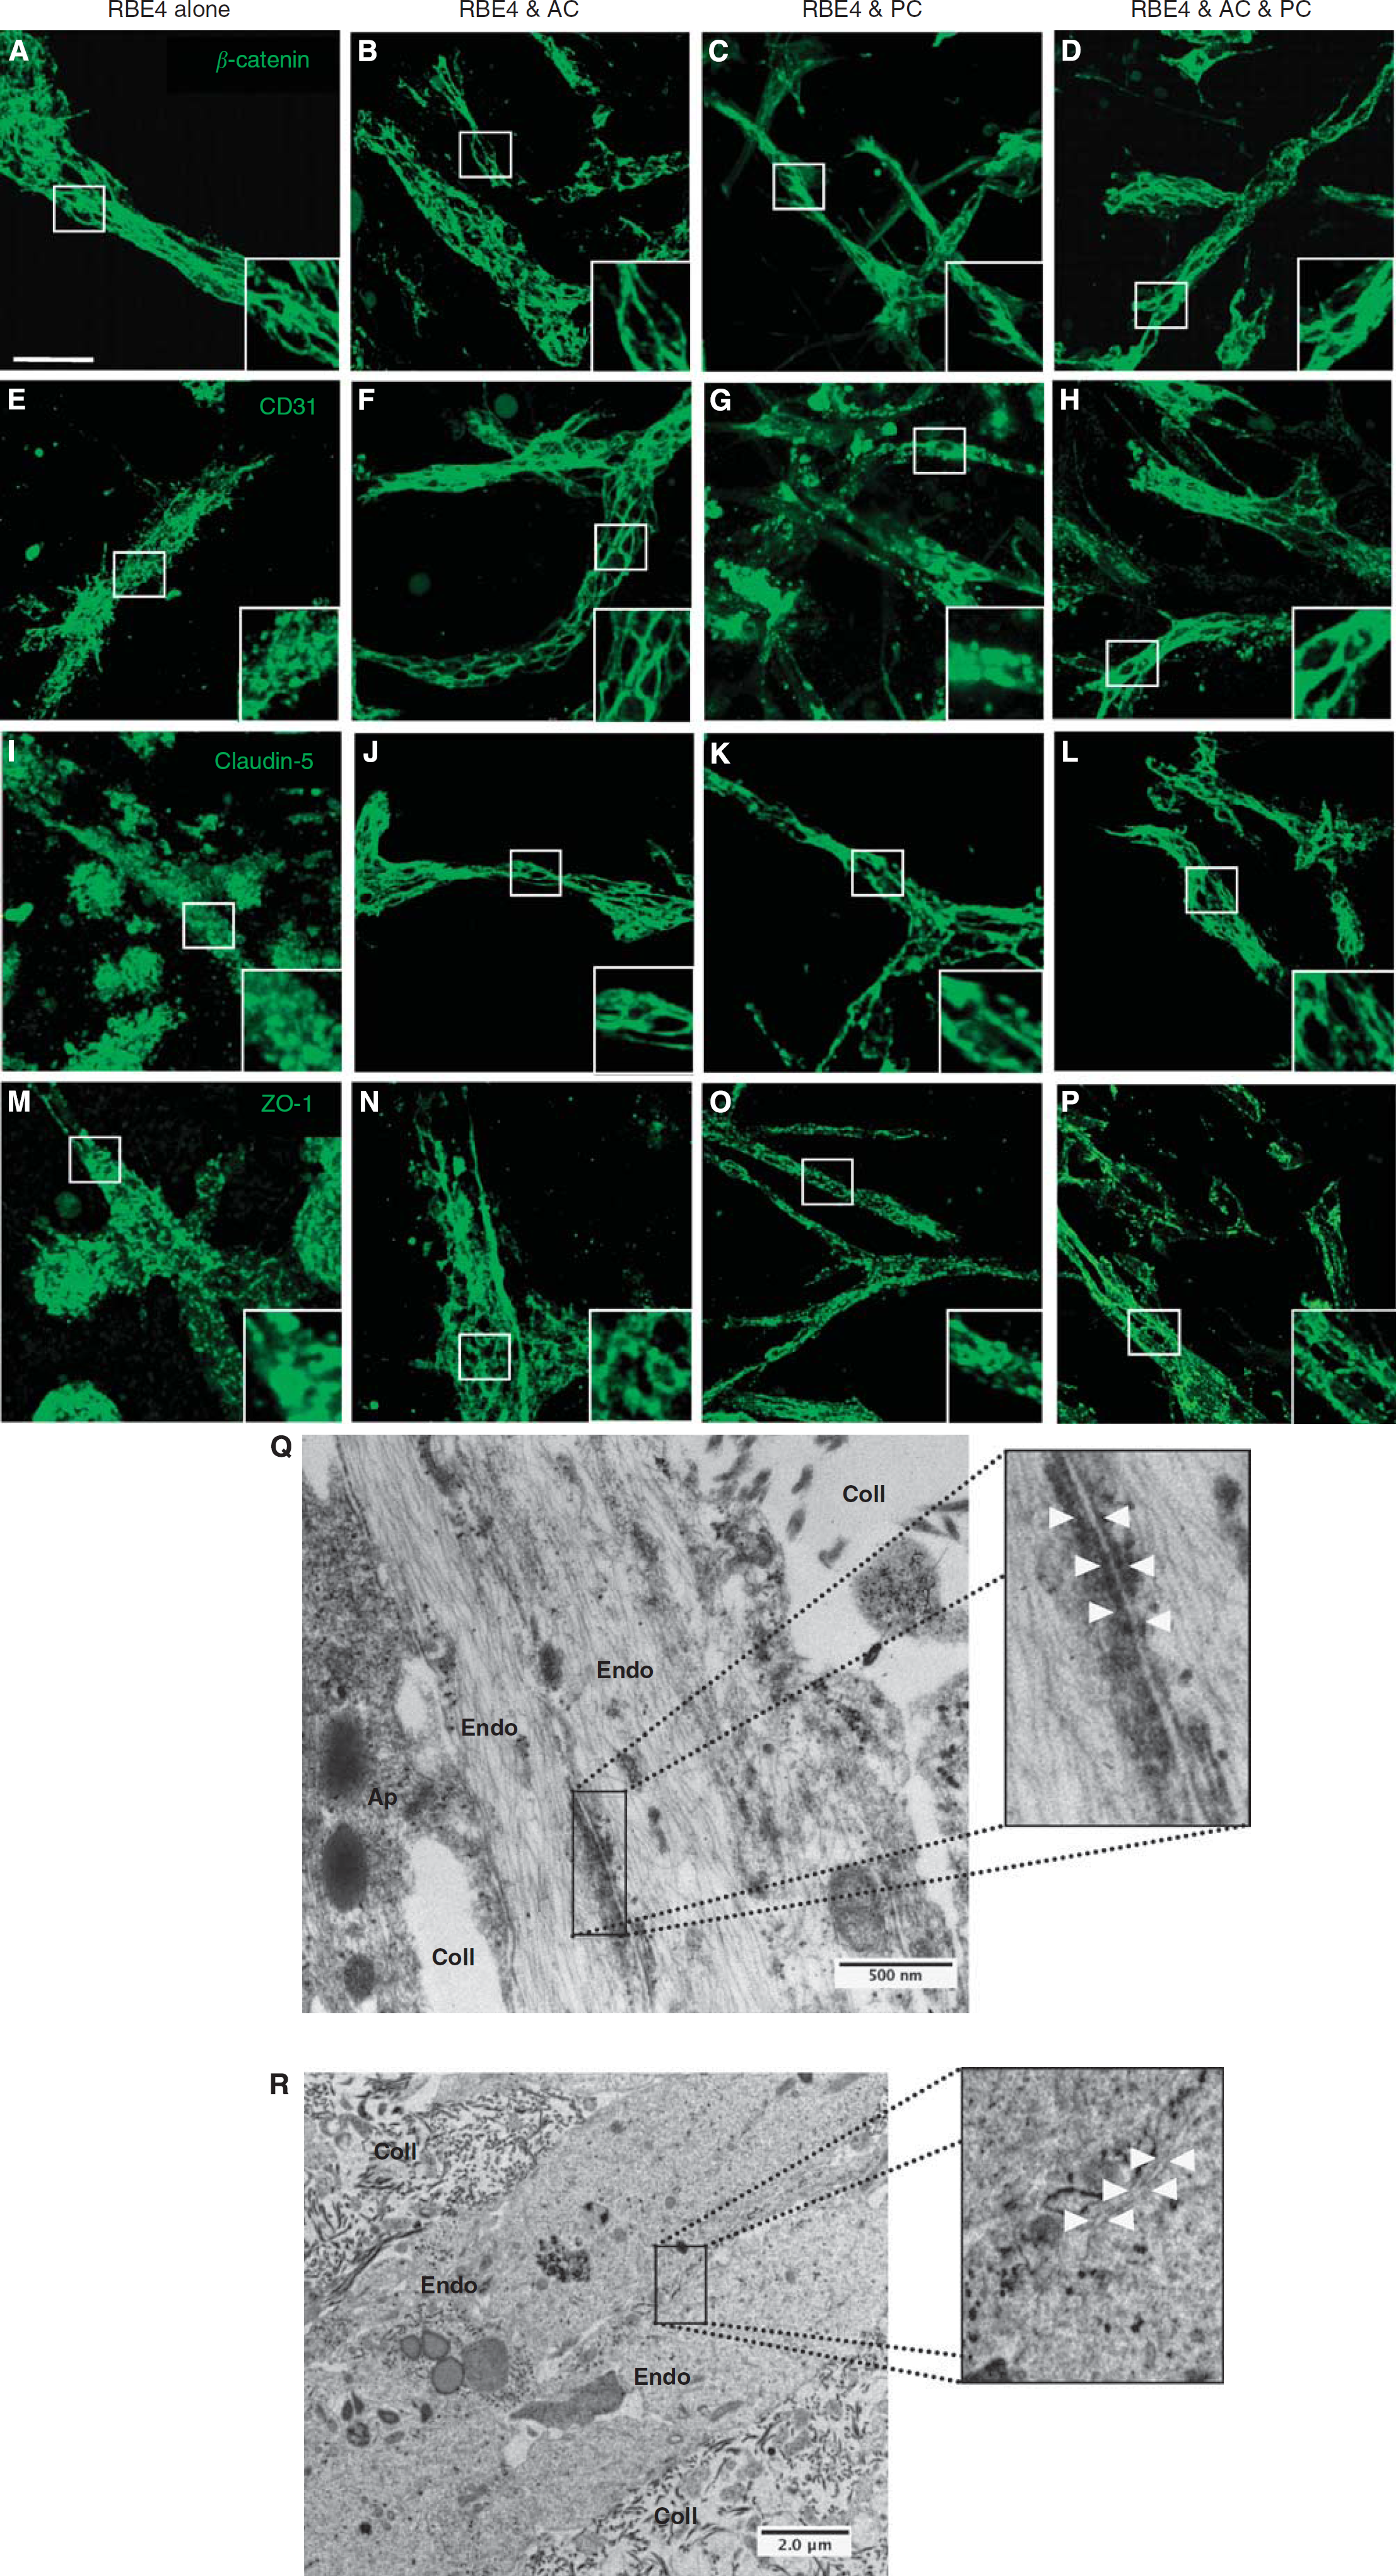
Astrocytes (AC) and pericytes (PC) induce barrier maturation phenotype. β-Catenin (
Coculture Is Necessary to Induce a Proper Blood–Brain Barrier Phenotype
Formation of appropriate adherens and tight junction complexes (AJ and TJ) constitute two important features of a mature BBB. We investigated whether these junctional proteins localize to cell borders in both monocultures and cocultures (Figure 3), as such observations are classically associated with TJ formation (Al Ahmad et al, 2009; Nakagawa et al, 2009). Analysis of tube-like structures from RBE4 monocultures showed β-catenin (Figure 3A) expression at cell borders, suggesting AJ complex formation. However, staining for the adhesion molecule CD31 (Figure 3E), as well as TJ proteins claudin-5 (Figure 3I) and ZO-1 (Figure 3M), appeared diffuse, indicating an inefficient BBB phenotype. In contrast, culture with astrocytes caused localization of all junctional proteins studied as well as CD31 to cell–cell borders (Figures 3B, 3F, 3J, and 3N) as expected, suggesting proper junctional complex formation and thus underlining the important role played by astrocytes during tube maturation. Although CD31 and ZO-1 localization in pericyte cocultures (Figures 3G and 3O, respectively) was similar to RBE4 monocultures, incidence of restricted claudin-5 staining at cell borders (Figure 3K) suggested partial TJ formation. As expected, the presence of both cells promoted formation of both AJ (Figures 3D and 3H) and TJ (Figures 3L and 3P) complexes, as observed by the strong positive staining delimiting the cell borders.
To further confirm these observations, we carried out additional analysis of 3D culture electron microscopy samples. Notably, in three-cell cocultures, we observed the presence of electron-dense particles at specific regions of endothelial cell–cell interactions, indicating the formation of TJs (Figure 3Q;). In comparison, these junctional structures were absent in endothelial monocultures (Figure 3R). Taken together, our data suggest that interactions with astrocytes and pericytes are required to induce formation of BBB-specific TJ complexes in 3D cultures.
Endothelial cell Lumen Polarization Requires the Presence of Astrocytes and Pericytes
To further establish the contribution of astrocytes and pericytes to formation of a BBB phenotype, tube polarity was investigated. We performed double immunocytochemistry for multidrug resistance proteins and the EC-specific markers Tie-2 and CD31 (notably the distribution of CD31 and Tie-2 is not polarized) followed by confocal microscopy and
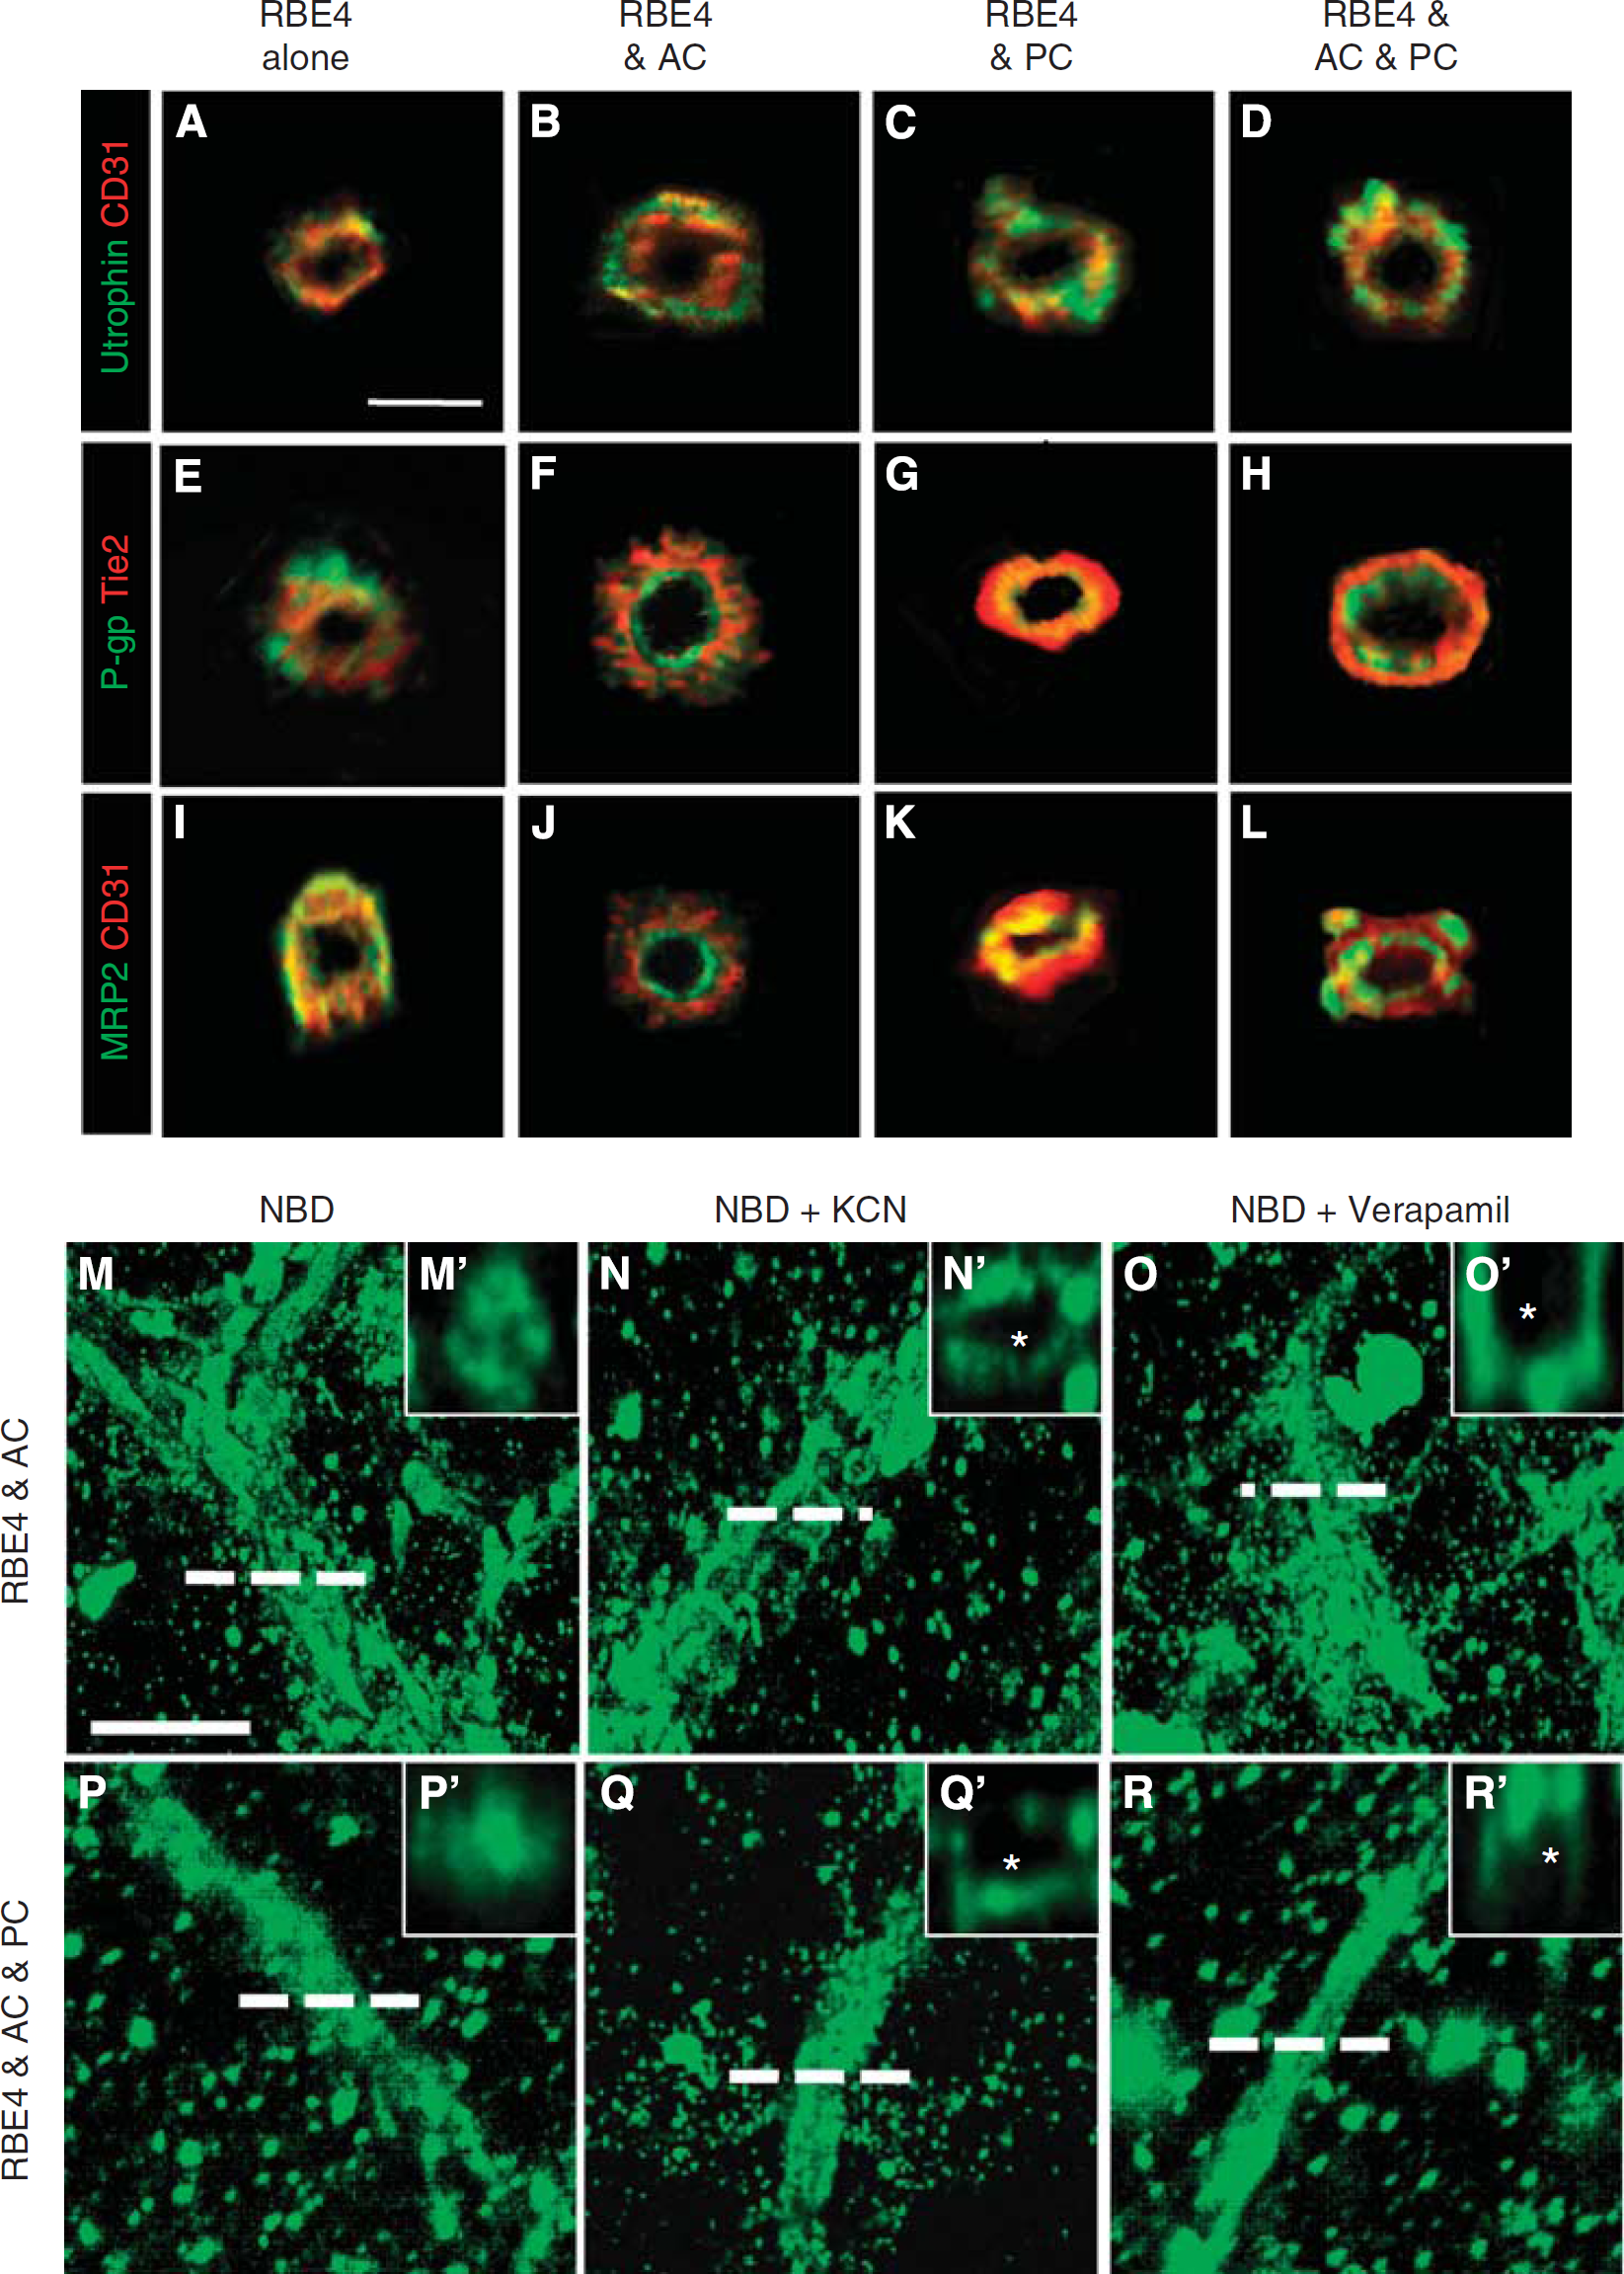
Astrocytes and pericytes induce tube polarity and P-glycoprotein (P-gp) activity. (
We first investigated lumen polarization using utrophin, a cytoskeleton protein localized at the abluminal face in EC cells. Tube cross-sections from RBE4 monocultures (Figure 4A) and cocultures (Figures 4B–4D) revealed utrophin localization (green) at the abluminal face of tube structures (red), indicating that ECs alone as well as in cocultures properly localize utrophin. We next investigated luminal polarization by observing P-gp (Figures 4E–4H) and multidrug resistant protein-2 (Figures 4I–4L), two important ABC proteins localized to the luminal face of vessels. The EC monoculture tubes were unable to localize either P-gp (Figure 4E) or multidrug resistant protein-2 (Figure 4I) inside the lumen as the staining appears predominantly on the outer side of the tubes or in a random distribution pattern. Astrocyte cocultures, however, showed proper localization of both proteins (Figures 4F–4J) to the luminal face as indicated by the central green staining that is facing the lumen, and red peripheral EC-specific marker. Similar observations were obtained for pericyte (Figures 4G–4K) and three-cell cocultures (Figures 4H–4L). Thus, luminal tube polarization requires the presence of astrocytes and pericytes.
Functional Validity: P-Glycoprotein Activity of the Three-Dimensional Model
Although astrocytes and pericytes induced many characteristic features of a proper BBB phenotype, the integrity and functionality of the vessels within the model remained unclear. To simultaneously address these points, activity of the P-gp transporter was examined RBE4 monocultures as well as astrocyte and three-cell cocultures using an NBD-CsA assay (Figures 4M–4Q), a functional method used to assess P-gp activity in isolated brain microvessels (Miller et al, 2000). Notably, P-gp activity was undetectable in RBE4 monocultures (data not shown), suggesting that functional transporter activity does not occur in tube-like structures formed solely by endothelial cells. In complete contrast, the tubes of cocultures showed high affinity for NBD-CsA (Figures 4M–4R), as observed by homogenous localization to all structures. Cross-sections of astrocyte cocultures generated by image reconstruction (Figure 4M') showed that NBD-CsA accumulates in the luminal compartment of the tubes. Such observation was also present in the three-cell cocultures (Figures 4P and 4P'), suggesting efficient efflux of NBD-CsA toward the lumen by active transport. In agreement, inhibition of such active transport by addition of either KCN (Figures 4N and 4Q) or verapamil (Figures 4O and 4R), potent inhibitors of P-gp activity, completely abrogated luminal accumulation of NBD-CsA. Cross-sectional views (Figures 4N', 4Q', 4O', and 4R') clearly show the dye still localizes to the tubes but is absent from the luminal space (asterisk). These data provide strong evidence that the ABC transporters located at the luminal side of the tubes are functionally active. Furthermore, luminal accumulation of the dye suggests vascular integrity.
Astrocytes and Pericytes Differentially Regulate the Vascular Responses to Hypoxic Insult
To observe whether our model is dynamic and responsive to external stimuli, and how astrocytes and pericytes modulate vascular characteristics during injury, we exposed our cultures to prolonged O2 deprivation (48 hours at 1% O2). Unsurprisingly, EC monocultures exhibited significantly disrupted TJ protein expression (claudin-5 and ZO-1, Figure 5E) at EC borders of vascular structures. Both astrocytes (Figures 5B and 5F) and pericytes (Figures 5C and 5G) significantly improved tube morphology and localization of TJ proteins, although some disruption was still evident. Notably, astrocytes seemed to maintain localization of claudin-5 better than pericyte cocultures. Coculture with both cells was a prerequisite for optimal localization of both claudin-5 and ZO-1 staining to cell borders and good preservation of tube morphology (Figures 5D and 5H).
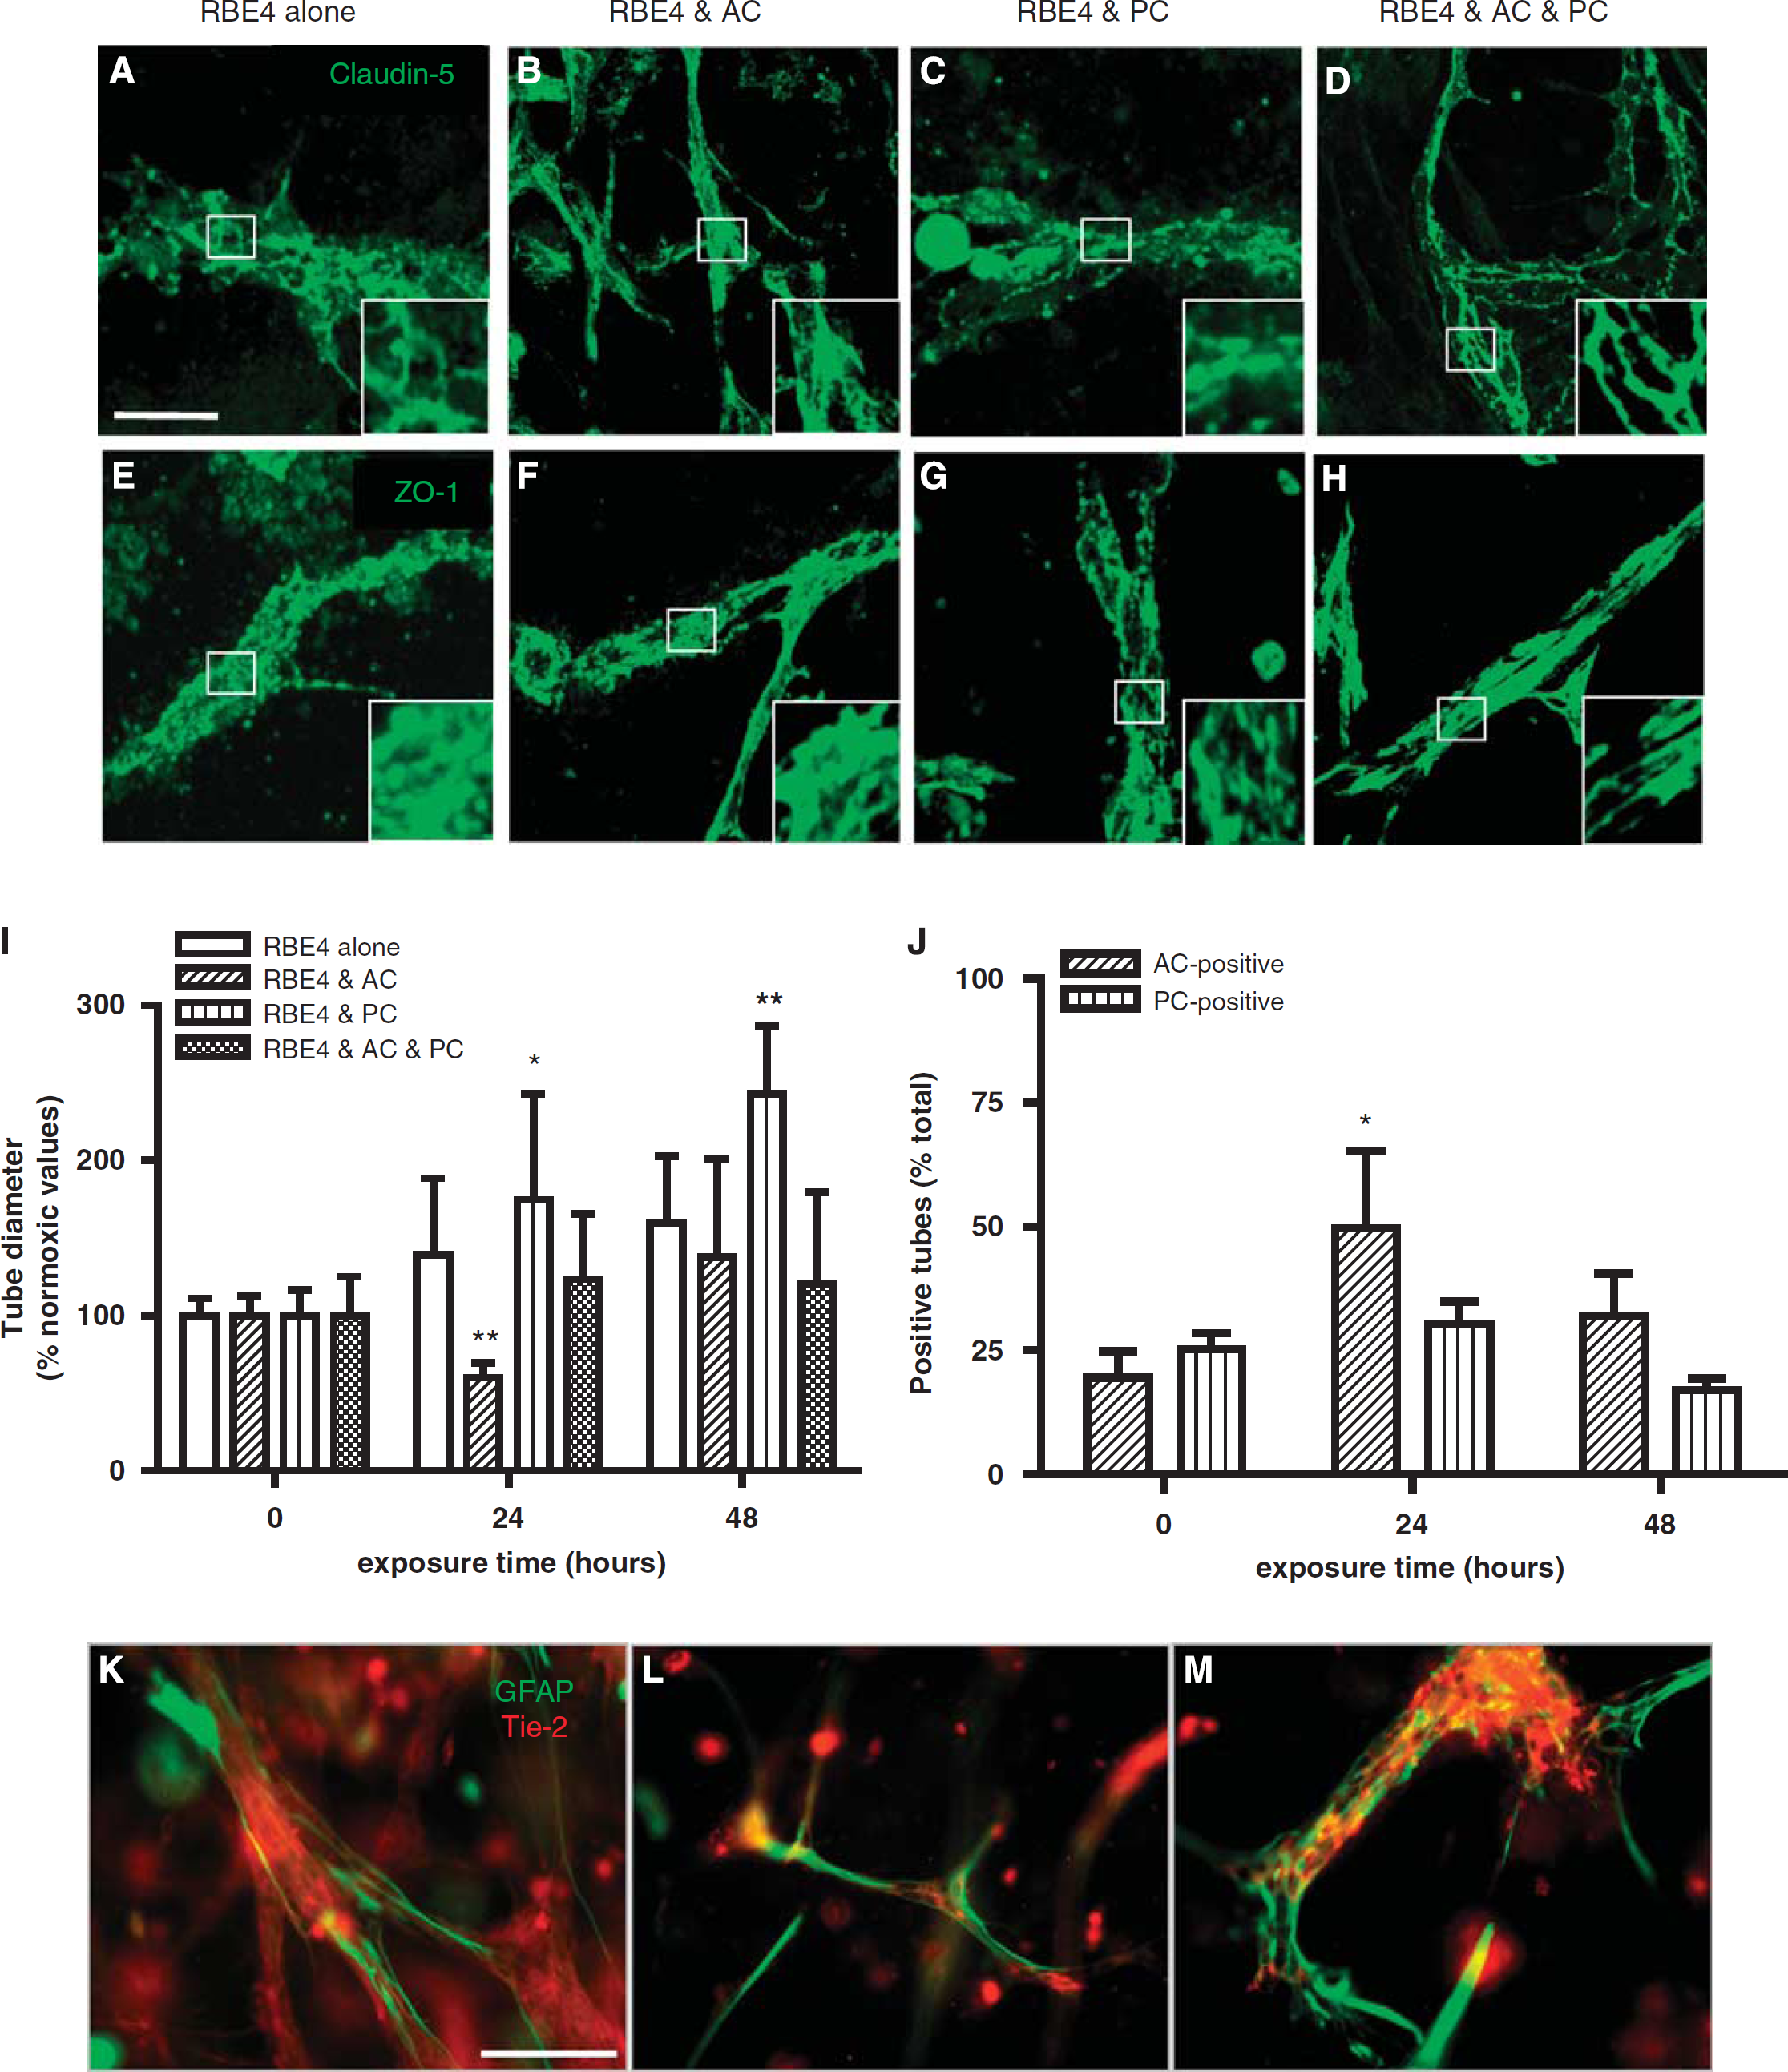
Astrocytes (AC) and pericytes (PC) differentially modulate RBE4 tube responses to hypoxic stimulus. (
Next, we investigated how O2 deprivation stress compromises astrocyte and pericyte interactions. We firstly monitored changes in tube diameter during hypoxic exposure in our different culturing conditions (Figure 5I). In RBE4 monocultures, tube diameter showed a modest increase reaching a maximal value of 159.93% ± 42.65% after 48 hours of exposure. Interestingly, astrocyte cocultures displayed a biphasic response, with a significant diameter decrease at 24 hours (59.76% ± 9.93%) followed by a reestablishment to values slightly over the baseline (137.55% ± 62.89%). Pericytes induced significantly high and sustained increases, with values of 174.85% ± 68.24% and 242.55% ± 43.87% at 24 and 48 hours of hypoxia, respectively. In three-cell cocultures, astrocyte responses again seemed to dominate as only small increases were observed at 24 and 48 hours (123.87% ± 42.23% and 120.37% ± 59.19%, respectively). Next, we investigated whether hypoxic stress acts as a positive or negative stimulus for astrocyte and pericyte recruitment to the tubes in three-cell cocultures (Figure 5J). Under normoxia, the number of tubes contacted by astrocytes or pericytes appeared modest (19.64% ± 5.31% and 25.33% ± 7.18%, respectively). Surprisingly, during hypoxia, the number of tubes contacted by astrocytes rapidly increased at 24 hours (49.76% ± 15.69%) before decreasing again at 48 hours (32.01% ± 8.53%). Notably, pericyte contact was not significantly altered showing values of 30.84% ± 10.02% and 17.06% ± 4.75% at 24 and 48 hours, respectively. These results clearly suggest that hypoxia differentially affects astrocyte–endothelial and pericyte–endothelial interactions.
We additionally used immunocytochemistry to monitor the changes in astrocyte–endothelial interactions by observing the density of coverage of EC tubes in astrocyte cocultures (Figures 5K–5M). Under normoxic conditions (Figure 5K), the astrocyte processes contacted EC tube-like structures. As observed previously, hypoxic exposure (24 hours at 1% O2; Figure 5J) decreased tube diameters and surprisingly increased process coverage. Extended hypoxic exposure (48 hours at 1% O2; Figure 5M) significantly increased tube diameter, disrupted astrocyte process morphology, and reduced tube coverage. Thus, oxygen deprivation constitutes an important modulator of TJ proteins and cellular contacts.
Discussion
Coordinated complex signaling mechanisms and pathways that exist between ECs, astrocytes, and pericytes are important for ontogeny and maintenance of the BBB
Our culture displayed classic EC morphogenesis such as formation of cysts, intercystal connections, and tube-like structures that appear analogous to those observed during vascular development in vertebrates such as blood islands, primary vascular plexus, and angiogenic blood vessels (Baldessari and Mione, 2008). These features reflect an innate ability of ECs, but the absence of proper ABC transporter and junctional protein localization in tube-like structures indicates an important limitation of the monocultures. Notably, astrocyte and pericyte interactions were required to induce adequate AJ and TJ complex localization and EC tube polarization in 3D, an observation correlating well with establishment of improved barrier phenotype in 2D
Our model also provides fundamental information on the modulation of tubulogenesis by astrocytes and pericytes. Pericytes increased the number of tubes thereby mediating a pro-angiogenic phenotype on ECs agreeing with previous studies (Murata et al, 1994; Watanabe et al, 1997). The presence of astrocytes on the other hand seemed to alter vasculogenic and angiogenic-like processes in favor of vessel maturation. Intriguing differential effects were also observed on tube diameters. Interestingly, consistent abolishment of the pericyte pro-angiogenic stimulus in the presence of astrocytes suggests that astrocytes may compete with or suppress the action of pericytes.
Contact of both astrocytes and pericytes with the vascular structures improved barrier protein localization, although astrocytes seemed to perform better than pericytes. Despite this, both cells effectively induced luminal efflux and accumulation of a P-gp substrate demonstrating not only the presence and activation of an efficient transport mechanism but also vascular integrity (Bauer et al, 2004; Miller et al, 2000; Soontornmalai et al, 2006). This and our previous study highlight that pericytes alone can maintain barrier characteristics and thus enable vascular structures devoid of astrocytes to function efficiency.
Hypoxia, a characteristic state that disrupts the BBB in many pathologies (Brown and Davis, 2005; Hopfl et al, 2003), modulates both protein localization and cellular interactions within the model system. Surprisingly, acute hypoxia initially increased astrocyte coverage of tube structures, whereas prolonged hypoxia triggered loss of astrocyte contacts and vascular swelling as occurs during injury
In conclusion, our results emphasize an important role of pericytes, in addition to astrocytes, in BBB development and maintenance. It is clear that pericytes contribute significantly to vasculogenic/angiogenic processes and have functions distinct from astrocytes that define BBB characteristics. Overall, our model represents an exciting tool to investigate different aspects of BBB function that include, but are not limited to developmental processes, temporal-spatial effects of different cell types (such as neurons, inflammatory cells, etc.) and the impact of various external factors and stimuli on cellular interactions. We are confident that this innovative tool will provide a new dimension to our understanding of the cellular interactions at the BBB during physiological and pathological states, and bring us significantly forward in many fields of research.
Footnotes
Acknowledgements
The authors thank Dr B Bauer for the NBD-CsA, Dr JM Fritschy for the ABC transporter antibodies, G Barmettler (Zurich Microscopy Center, ZMB) for the preparation of transmitted electron microscopy samples, Drs A Hehl (Institute of Parasitology, University of Zurich) and U Ziegler (ZMB) for providing access to both confocal microscope and Imaris software, and Dr J Badaut for fruitful discussions.
The authors declare no conflict of interest.