
Abstract
The brain's energy supply determines its information processing power, and generates functional imaging signals, which are often assumed to reflect principal neuron spiking. Using measured cellular properties, we analysed how energy expenditure relates to neural computation in the cerebellar cortex. Most energy is used on information processing by non-principal neurons: Purkinje cells use only 18% of the signalling energy. Excitatory neurons use 73% and inhibitory neurons 27% of the energy. Despite markedly different computational architectures, the granular and molecular layers consume approximately the same energy. The blood vessel area supplying glucose and O2 is spatially matched to energy consumption. The energy cost of storing motor information in the cerebellum was also estimated.
Introduction
The processing power of computational devices is limited by their energy supply (Sarpeshkar, 1998; Laughlin and Sejnowski, 2003), but how the brain's energetic resources are allotted to different parts of a neural computation is unknown. Fundamental questions, which will determine how the neural and vascular architecture are structured, include: for a particular neural algorithm, what is the ratio of energy needed for excitatory and inhibitory neurons; is it energetically more economical to use small or large neurons; how much energy is used on information processing in dendritic trees, compared with distributing the computed results along axons; and how is the blood supply matched to the energy used by different neurons or subcellular compartments of neurons? Understanding the cellular and subcellular distribution of energy use, and its relationship to the vascular architecture, is also relevant to understanding how functional imaging signals are generated (Attwell and Iadecola, 2002). To address these issues, we analysed the energy used by the rat cerebellar cortex: a brain area for which the cellular properties and computations performed have been well studied.
The cerebellar cortex receives information on the environment and body position from sensory receptors, and on the desired motor output from the cerebral cortex, and modulates the motor output to make movements smoother and more accurate (reviewed by Tyrell and Willshaw, 1992). Information arrives in the granular layer along mossy fibres (Figure 1A). The granule cells are small neurons that recode the information they receive on approximately four small dendrites (each with a mossy fibre input) into action potentials which pass along their axons, the parallel fibres, into the molecular layer to excite the output cells of the cerebellar cortex, the Purkinje cells. These large cells, with extensive dendritic trees, send axons to inhibit neurons in the deep cerebellar nuclei. Information arriving on approximately 13,000 mossy fibres (Ito, 1984) is thus recoded into action potentials on a much larger number (∼ 174,000; Harvey and Napper, 1988) of parallel fibres, which synapse onto the output Purkinje cells. Purkinje cells also receive a single powerful excitatory synapse from a climbing fibre from the inferior olive: this input may decrease the strength of active parallel fibre synapses during learning of motor patterns (reviewed by Tyrell and Willshaw, 1992). Inhibitory interneurons, the Golgi, basket and stellate cells (Figure 1A), moderate the activity of the whole network.
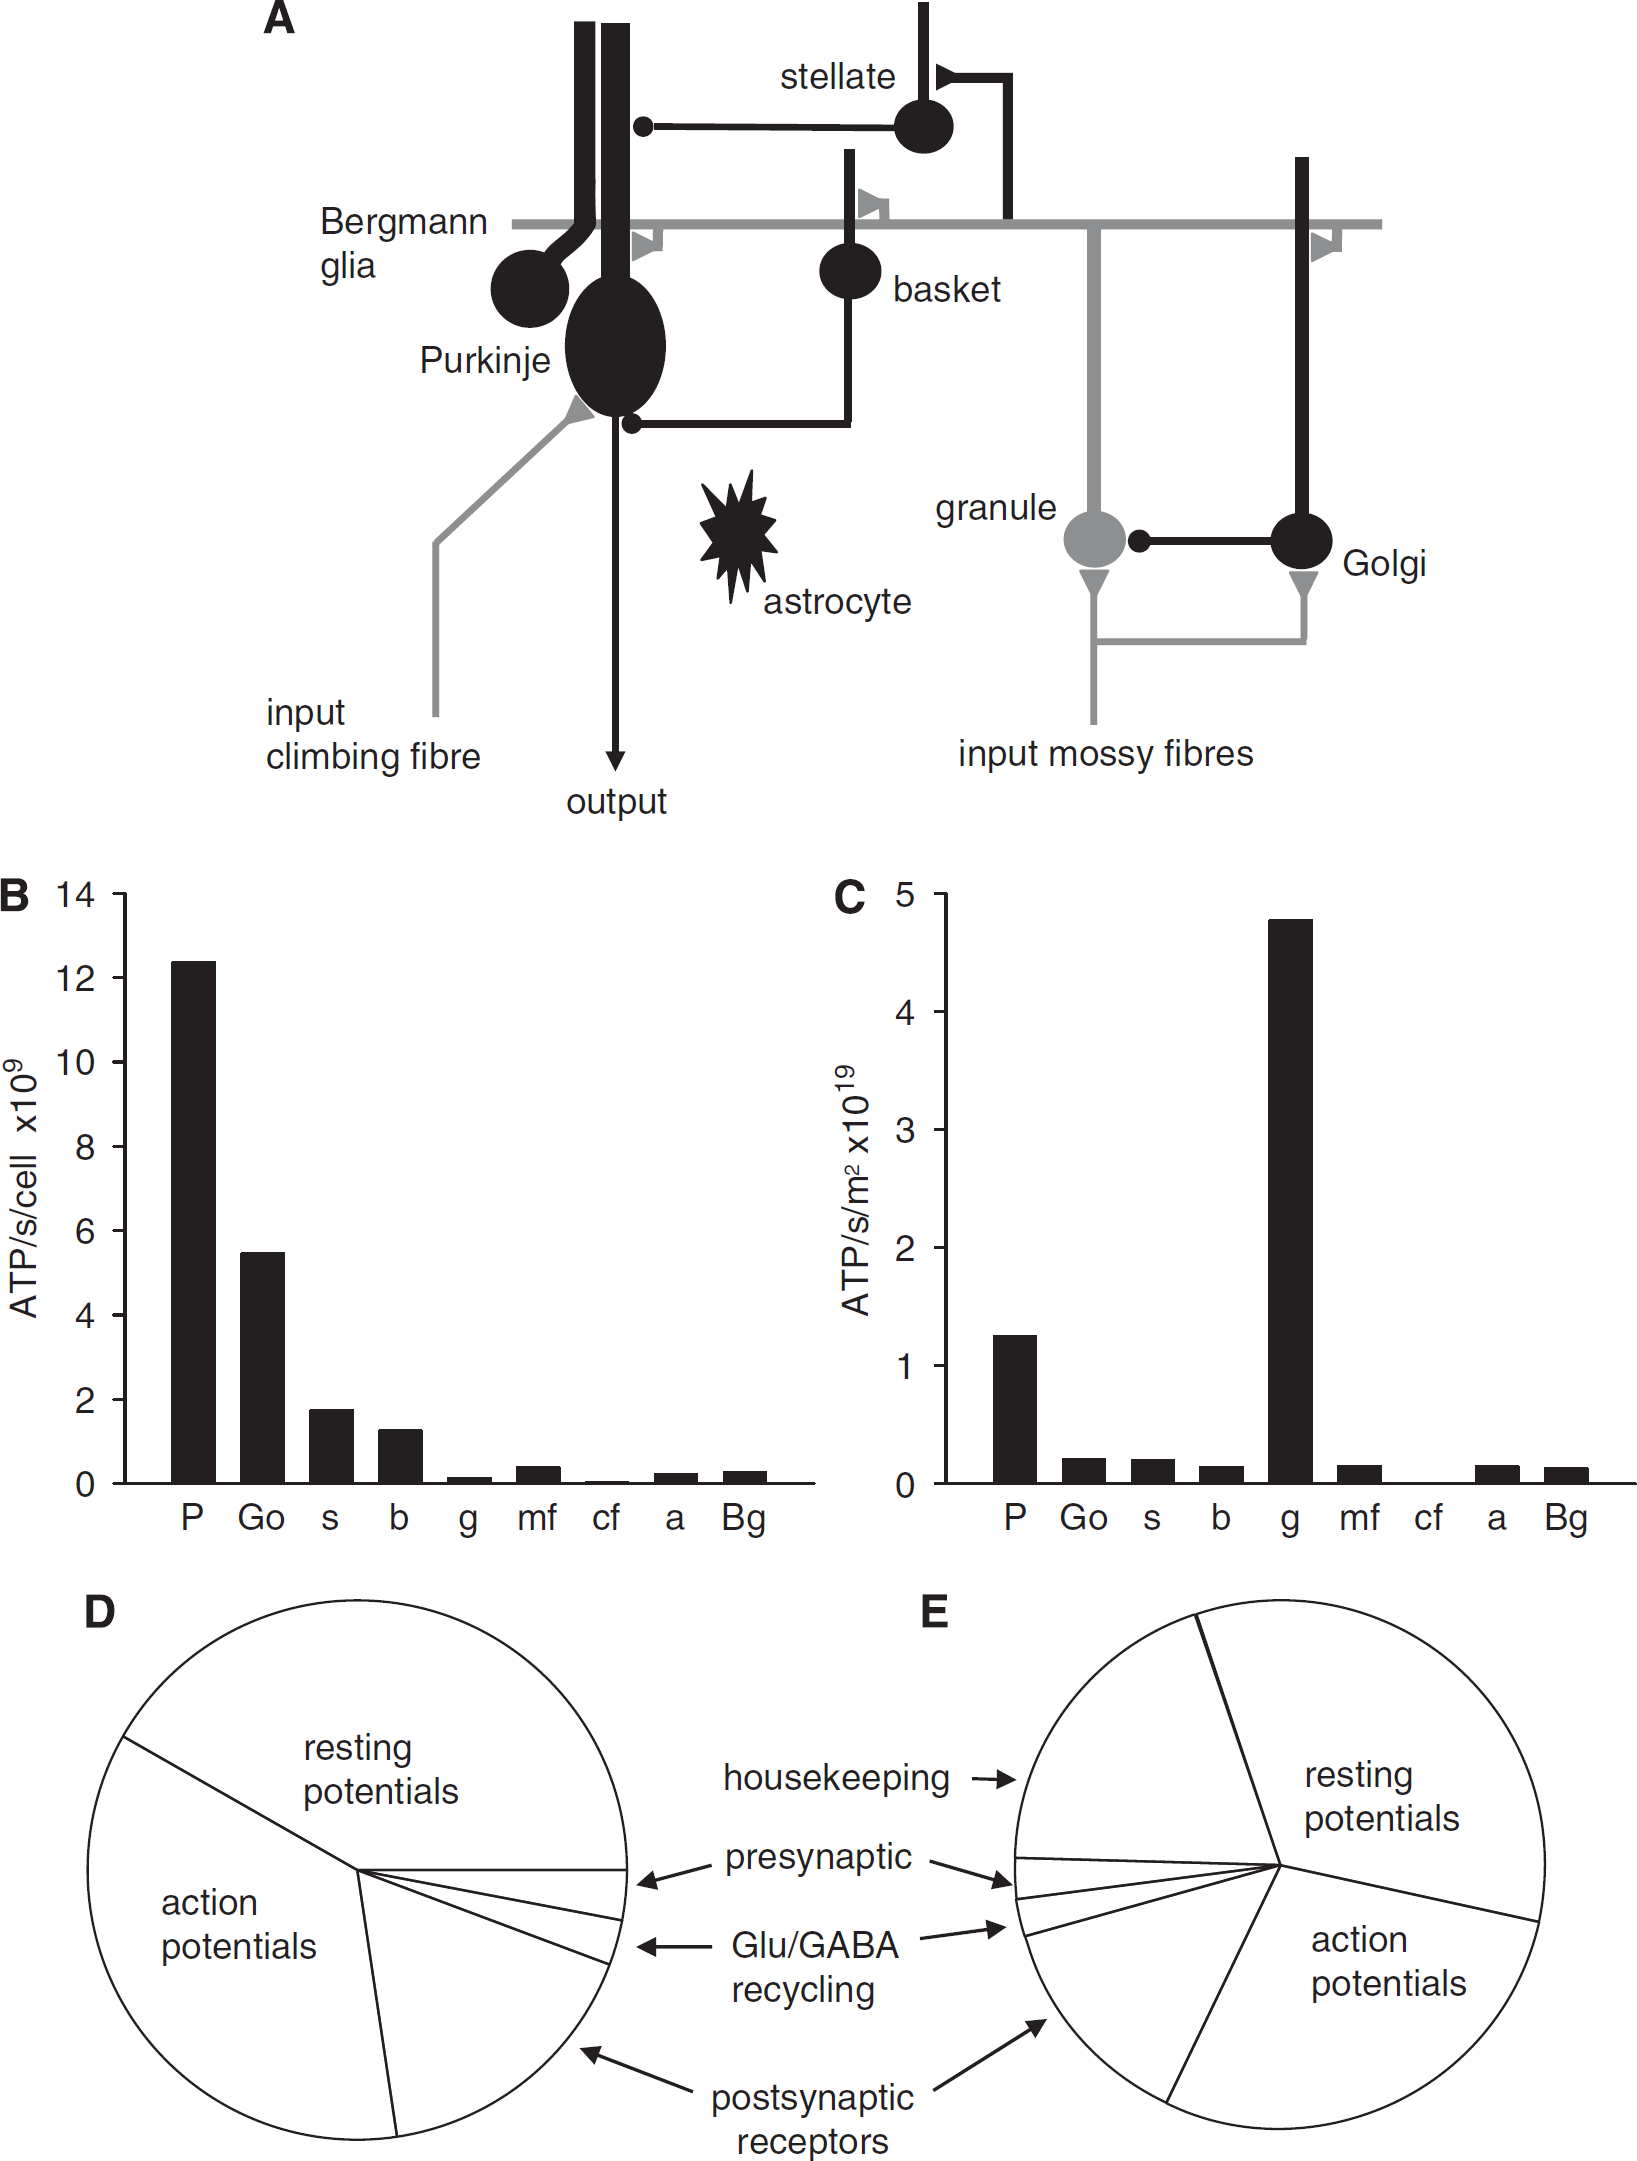
Predicted energy use for cerebellar cortex with all cell types firing at their physiological rate. (
The cerebellar circuitry results in a very different organization to the information processing in the granular and molecular layers, raising the question of whether these different styles of neural computation expend energy differently, and require a different vascular density. Using the measured electrical and anatomical properties of each cerebellar cell type, we calculate the energy expended on signalling during the retrieval of stored patterns of motor behaviour.
Materials and methods
Calculation of ATP Usage
Most signalling-related energy in the brain is expended on pumping of Na+ ions out of cells (Siesjo, 1978; Attwell and Laughlin, 2001). We estimated the signalling energy expended on different cellular processes in the rat cerebellar cortical grey matter as follows. Published anatomical and electrophysiological data on the different cerebellar cells were used to calculate the ATP used to reverse the Na+ influx producing excitatory synaptic currents and action potentials, the Na+ influx occurring at the resting potential, the Ca2+ entry driving neurotransmitter release, and the ATP expended on other less energy consuming processes inherent in cerebellar information processing described in Supplementary Information. Our analysis differs from previous energy budgets for the cerebral neocortex (Attwell and Laughlin, 2001) and olfactory glomerulus (Nawroth et al, 2007) in that, as far as possible, it uses experimentally measured parameters for each cell type being considered, rather than average values from a range of cell types (e.g., Attwell and Laughlin (2001) used an average charge entry through non-NMDA receptors, which varies greatly between cell types). This is possible because the cerebellum has been far more intensively studied electrophysiologically and anatomically than other brain areas. Thus, we gathered ∼300 parameters from the literature (on cell action potential firing rates, the number of vesicles released by each synapse, the conductances activated postsynaptically, etc.) to define the energy consumption by the nine different cell classes in the cerebellar cortex. Only one important parameter needed for our analysis was not directly available from the literature, the mean firing rate of granule cells (see below).
Measured ion fluxes were converted into values for ATP consumption using the fact that the Na+/K+-ATPase consumes one ATP per 3Na+ extruded, whereas the Ca2+-ATPase (or 3Na+/Ca2+ exchange followed by Na+ extrusion) uses 1 ATP per Ca2+ extruded. Similarly, the ATP needed to restore Ca2+ to intracellular stores, and expended on transmitter and vesicle recycling, were estimated (Attwell and Laughlin, 2001). The energy expended on restoring Cl− gradients after inhibitory transmission was estimated to be < 1% of that needed to restore an equivalent change of the Na+ gradient (see Supplementary Information), and was ignored. Full details of the calculations are given in the Supplementary Information. We initially consider only the energy used on signalling (including the resting potential), and ignore smaller non-signalling energy use on mitochondrial proton leak and housekeeping tasks (Attwell and Laughlin, 2001) which is discussed below.
Estimation of Mean Granule Cell Firing Rate
The exact value of this parameter is uncertain for several reasons. First, most studies are on anaesthetized animals and anaesthesia lowers firing rates (ketamine/xylazine reduces by 75% the parallel fibre response to stimulation; Bengtsson and Jorntell, 2007). Second, their small size means that few papers report the firing rate of individual granule cells. Finally, most studies report only peristimulus firing changes and not the mean frequency including the baseline spontaneous rate, which can be significant and varies from one cerebellar area to another.
To constrain this parameter, we used two different approaches. First, we assessed a likely range for the mean firing rate of granule cells
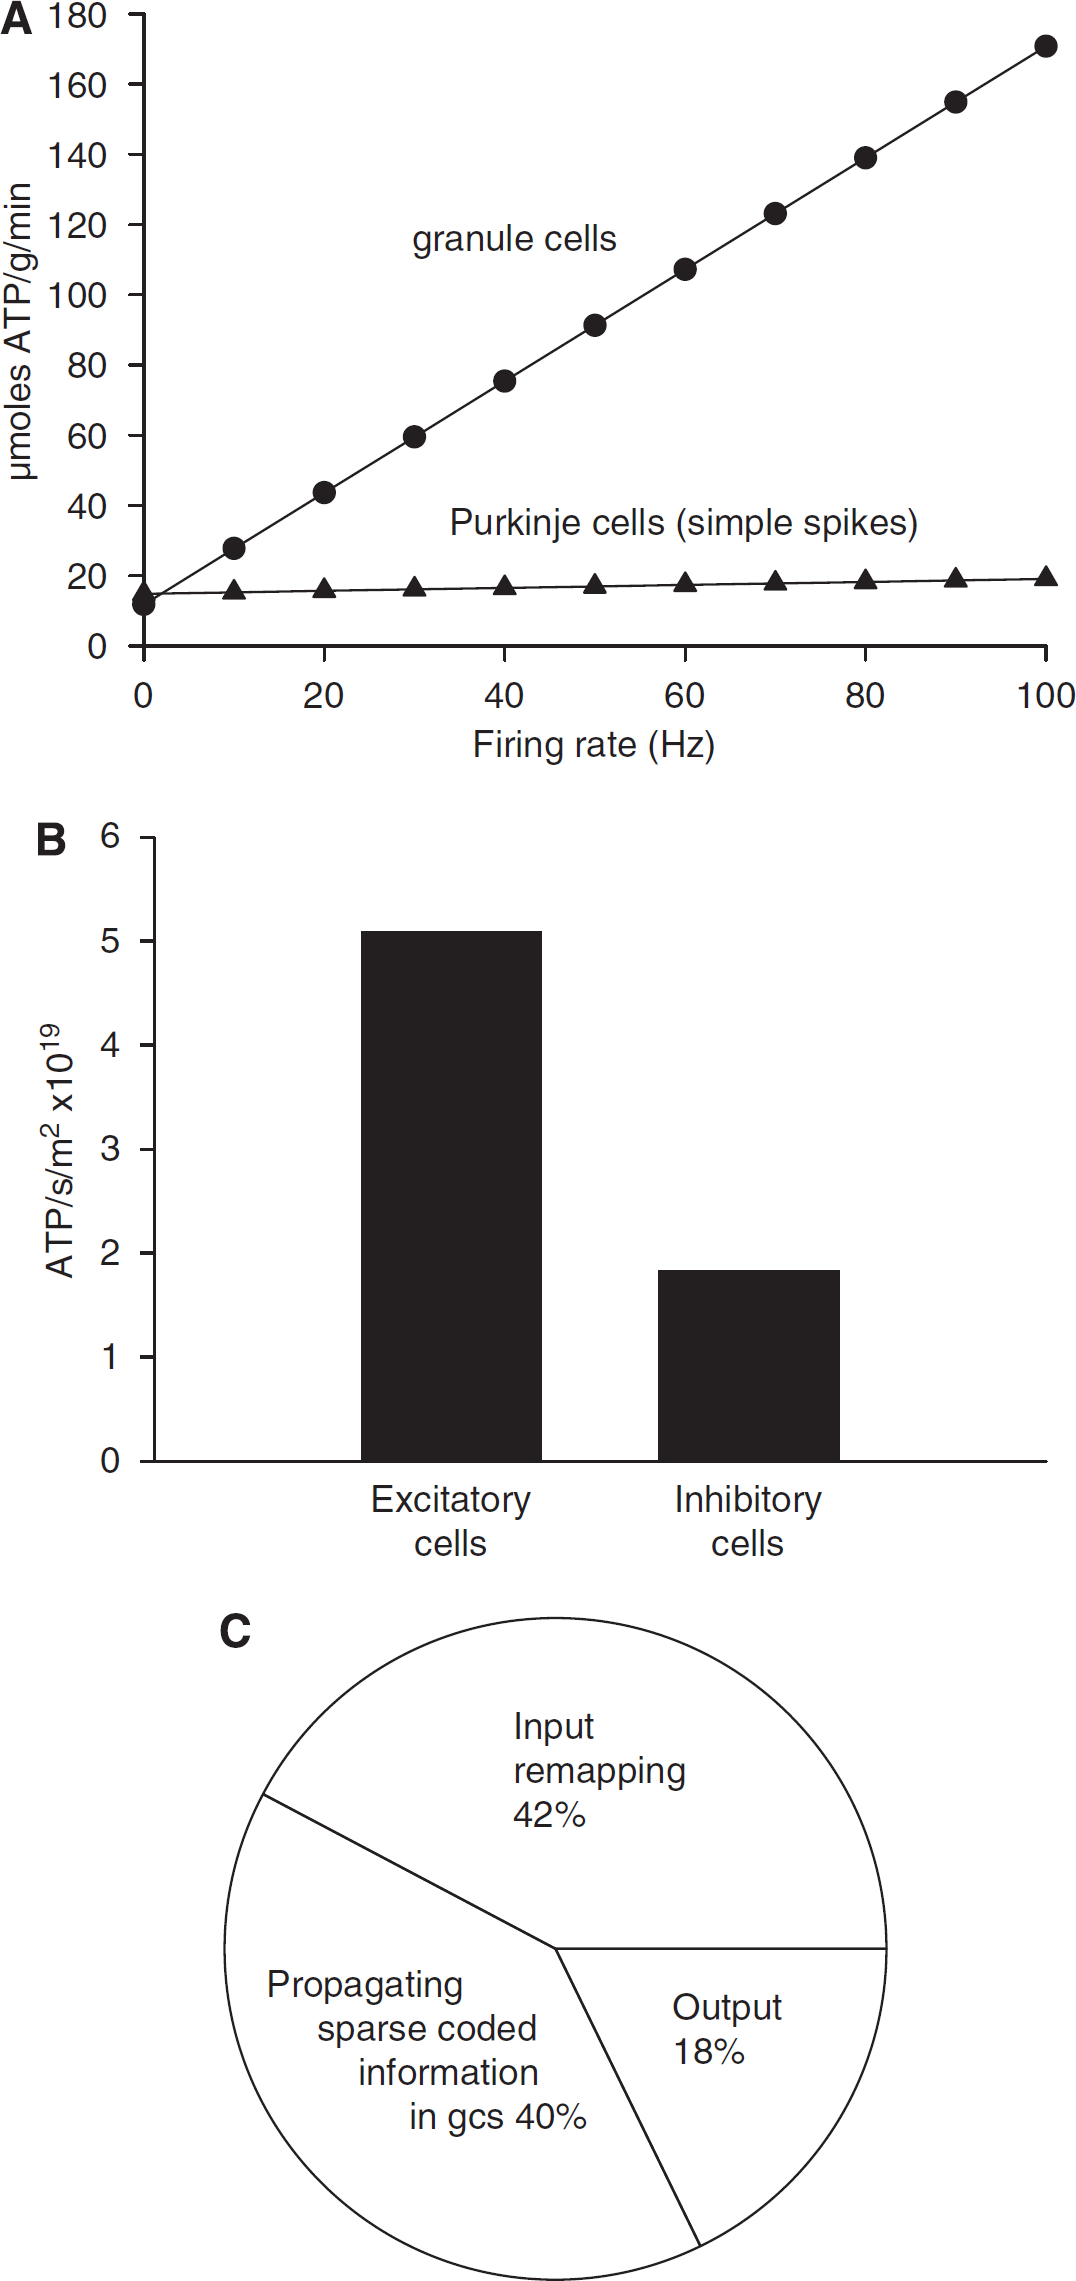
Second, we estimated the mean firing rate of granule cells using the charge transfer produced into Purkinje cell dendrites when action potentials occur in the parallel fibres, and the contribution this excitatory input makes to the cell's input resistance. Purkinje cells in awake mice have a resistance of 22.6 ± 2.8 MΩ (
where
The independent estimates described above suggest a mean granule cell firing rate between 1.5 and 2.9 Hz (based on the Purkinje cell input resistance) or 3 and 5.5 Hz (based on
Quantifying the Blood Vessel Distribution in Cerebellum
Postnatal day 21 rats (killed by cervical dislocation) were used as most parameters in this work are from studies on juvenile rats. To label blood vessels, we incubated 200 μm sagittal cerebellar slices for 45 mins in artificial cerebrospinal fluid (aCSF) containing fluorescein isothiocyanate (FITC)-conjugated isolectin-B4 (50 μg/ml). Slices were washed in aCSF for 30 mins, then fixed in 4% paraformaldehyde in phosphate-buffered saline for 40 mins at ∼25°C. Fluorescence was excited at 488 nm and emission was collected at 535 nm, as confocal stack images were taken with image planes separated by 5.5 to 6.67 μm or 2.76 to 3.03 μm (at × 10 or × 20 magnification).
Isolectin-B4 labels endothelial cells on the outside of blood vessels, and so delineates the vessel surface area available for O2 and glucose exchange, that is, a measure of the potential O2 and glucose supply to the tissue (e.g., Valabregue
Results
Cellular Distribution of Energy Consumption
We analysed the signalling energy used on each cell type in the cerebellar cortex, with all the cells firing action potentials at their measured physiological rates, that is, the mossy fibre input firing at 40 Hz (Maex and De Schutter, 1998), granule cells at 3 Hz (see above), Purkinje cells at 41 Hz (simple spikes, LeDoux and Lorden, 2002) and 1 Hz (complex spikes, Lang et al, 1999), Golgi cells at 10 Hz (Vos et al, 1999), stellate and basket cells at 12 Hz (Hausser and Clark, 1997), and the climbing fibre input at 1 Hz (Ito, 1984). These firing rates need not be produced by synaptic input but could partly reflect the intrinsic voltage-gated currents in the cells. Different lobules perform different tasks, so the fractions of energy used per cell class in a particular lobule may vary; here we present an average view taken over the cerebellum as a whole, using the available data in the literature.
Larger cells were found to use significantly more ATP per sec per cell than small cells (Figure 1B). This reflects the fact that larger areas of membrane mediate larger ion fluxes that require more ATP to be pumped back. Thus, each of the largest cerebellar neurons, the Purkinje cells, uses 1.24 × 10¹⁰ molecules of ATP per sec, which is far greater than the 1.72 × 10⁸ molecules of ATP per sec used by each of the smallest, granule, neurons, and the intermediate size inhibitory interneurons are in between (Figure 1B; cf Niven et al (2007) who found that large photoreceptors consumed more energy than smaller photoreceptors). Nevertheless, when multiplied by the number of neurons present, the 274-fold higher density of granule cells results in them dominating the energy use of the whole cerebellar cortex (Figure 1C), consuming 67% of the total signalling energy, whereas the principal Purkinje neurons use only 18% of the total.
Our predicted total signalling energy consumption for the cerebellar cortex is 16.5 μmol ATP per g per min, which is similar to the value measured in conscious rats of 20.5 μmol ATP per g per min (Sokoloff et al, 1977). Housekeeping energy use on non-signalling tasks, such as turnover of macromolecules, axoplasmic transport, and mitochondrial proton leak (Attwell and Laughlin, 2001; Nawroth et al, 2007), which are not included in our calculation, may account for the ∼20% difference between the predicted and measured energy use. This agreement shows that it is possible to generate an energy budget from the bottom up, based on the measured properties of the ion channels generating synaptic and action potentials, which estimates fairly accurately the total energy used on signalling in the cerebellar cortex.
Subcellular Distribution of Energy Consumption
The subcellular distribution of energy use varies dramatically between different neuron types in the cerebellar cortex (Figure 2). Purkinje cells, which receive approximately 174,000 excitatory synaptic inputs (of which ∼26,000 are active as 85% of these synapses have zero weight after learning (Isope and Barbour, 2002), see below), and fire action potentials at a high rate, use the majority (94%) of their signalling energy on action potentials (68%) and postsynaptic receptors (26%), and only 6% on the resting potential. By contrast, for the much smaller granule cells, which receive only four excitatory synaptic inputs, but have to propagate their action potential along, and maintain the resting potential of, a very long (∼4.5 mm) axon, most of the signalling energy goes on the resting potential (55%) and action potentials (31%). Of the inhibitory interneurons, basket and stellate cells use similar amounts of energy on the resting potential, action potentials, and postsynaptic currents, whereas Golgi cells use most of their energy on postsynaptic currents (Figure 2).

The subcellular distribution of energy use varies according to cell type. (
The predicted distribution of signalling energy expenditure on subcellular tasks in the whole cerebellar cortex was calculated by summing the energy used on action potentials, synaptic currents, the resting potential, and so on, over all cells, weighted by their area density (Figure 1D). This differs from that predicted for the cerebral cortex (Attwell and Laughlin, 2001). Although in both areas ∼40% of signalling energy goes on action potentials (36% in cerebellum and 47% in cortex), and only a small fraction goes on transmitter release and recycling, much more energy is used on resting potentials in the cerebellum (mainly in granule cells) than in the cerebral cortex (42% versus 13%), and much less on postsynaptic currents (17% versus 34%). The distribution in cerebellum also differs from that predicted for an olfactory glomerulus in response to a single sniff (Nawroth et al, 2007) in that a greater fraction of energy is used on action potentials in the cerebellum (36% versus 23% in olfactory glomerulus) and on resting potentials (42% versus 17%), whereas less is used on postsynaptic currents (17% versus 32%).
Figure 1E shows the predicted distribution of total energy expenditure if we assume that housekeeping tasks are responsible for the difference between our predicted energy use on signalling (16.5 μmol ATP per g per min), and the total energy use measured in conscious rats (20.5 μmol ATP per g per min; Sokoloff et al, 1977).
Energy Use by Different Stages of Cerebellar Computation
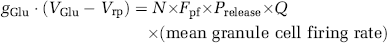
Because a quarter of cerebellar signalling energy is predicted to be expended on granule cell action potentials and the postsynaptic currents they evoke in Purkinje cells, if the firing frequency of granule cells alone is varied in the model then the total cerebellar energy expenditure is predicted to vary dramatically (Figure 3A). In contrast, varying the assumed simple spike firing rate of Purkinje cells alone has little effect on energy consumption. Similarly, varying the complex spike rate of Purkinje cells has little effect on predicted energy consumption (a 2-fold change for a change of complex spike rate from 0 to 100 Hz (data not shown), compared with a 15-fold change for the same change of granule cell spike rate; Figure 3A). Thus, the total signalling energy use need not correlate well with the firing rate of the principal neurons in this part of the brain.
Energy use on different aspects of cerebellar computation. (
Little is known of the contribution of inhibitory neurons to the energy use of the brain (Buzsaki et al, 2007). To examine the allocation of energy use to excitatory and inhibitory neurons in the cerebellar cortex, we summed the energy used on mossy fibres, climbing fibres, and granule cells, and on Purkinje, stellate, basket, and Golgi neurons, respectively (we included as an excitatory cost the much smaller ATP consumption on recycling glutamate in glia; the small ATP use on glial resting potentials was ignored, solely for this calculation). Excitatory neurons were found to consume 5.1 × 10¹⁹ molecules ATP per sec per m2 of cerebellar cortex, whereas inhibitory neurons consumed only 1.9 × 10¹⁹ molecules ATP per sec per m2 (Figure 3B).
We can conceptualize the retrieval of motor patterns from the cerebellar cortex as occurring in three stages (Tyrell and Willshaw, 1992): re-mapping from mossy fibre input action potentials to action potentials in the granule cell somata (using energy in mossy fibres, granule cell dendrites and somata, Golgi cells, and granular layer astrocytes); propagation of remapped information to Purkinje cells as a sparse code (using energy in the granule cell axons, molecular layer interneurons and Bergmann glia); and computation by Purkinje cells of an output signal (using energy in the Purkinje cells). By summing the energy used in the different cell types participating in these different stages of cerebellar computation, the relative amounts of ATP used on these processes were predicted to be 42%:40%:18% (Figure 3C). Thus, most cerebellar cortical signalling energy is used on intracerebellar processing of the incoming information, rather than on computation of the output signal by the principal Purkinje neurons.
Sensitivity of the Predictions to the Parameters Assumed
As detailed in the Supplementary Information, the great majority of the parameters needed to make these energy use predictions have been measured for each of the cerebellar cortical cell types and synapses. We assessed the sensitivity of our predicted energy budget to the values assumed for the parameters used, by increasing each parameter by 10% and examining the effect on the total predicted energy consumption. As shown in Table 1, the predicted energy use is most sensitive to changes in the following parameters: number of granule cells per Purkinje cell (a 10% increase gives a 7% increase in energy use), granule cell resting potential (10% more negative gives a 4.2% decrease in energy use), granule cell firing rate (a 10% increase gives a 2.9% increase in energy use), the percentage of parallel fibre synapses that have zero weight (2.9% decrease in energy use), granule cell axon diameter (2.8% increase in energy use), parallel fibre length (2.7% increase in energy use), granule cell soma input resistance (2.5% decrease in energy use), granule cell capacitance per unit area (2.1% increase in energy use), and the voltage change throughout the cell during a granule cell action potential (2.1% increase in energy use).
Sensitivity of the predicted energy use to changes in parameter values
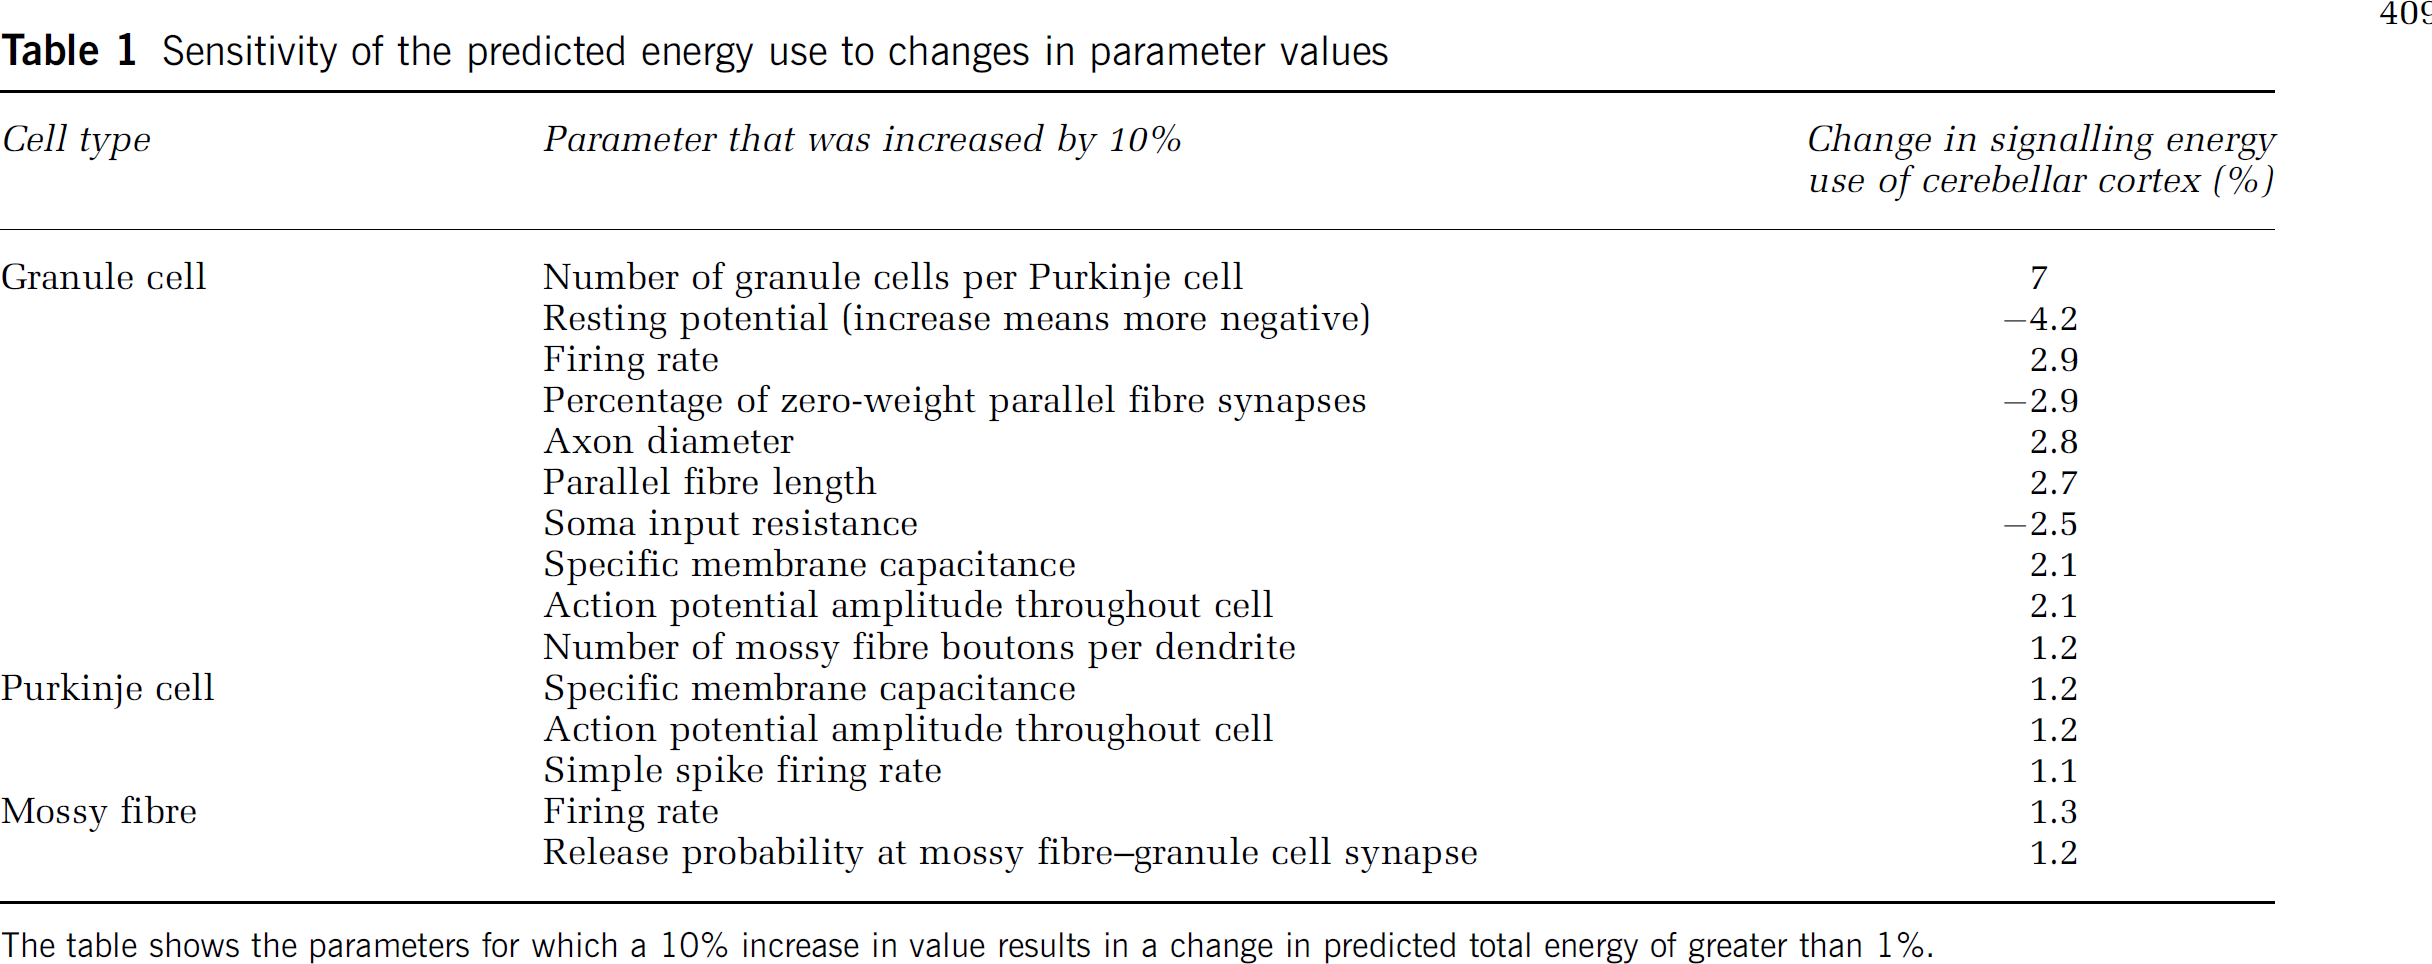
The table shows the parameters for which a 10% increase in value results in a change in predicted total energy of greater than 1%.
Our predictions are most sensitive to uncertainties in the values of four parameters, as summarized in Table 2. First, a detailed analysis of parallel fibre to Purkinje cell connectivity concluded that, in the adult, after learning of motor programmes has occurred, 85% of the weights of parallel fibre to Purkinje cell synapses have been reduced to zero (Isope and Barbour, 2002). The fact that only a small fraction (0.15) of these synapses is active has been suggested to reflect either optimizing the information storage in the cerebellum (Brunel et al, 2004) or optimizing cerebellar noise processing (Porrill and Dean, 2008), and has a major effect on the predicted total signalling energy consumption, lowering it from 21.4 to 16.5 μmol ATP per g per min. The idea that a large majority of silent synapses exist is supported by
Effect of significant parameter uncertainties on the predicted total signalling energy use
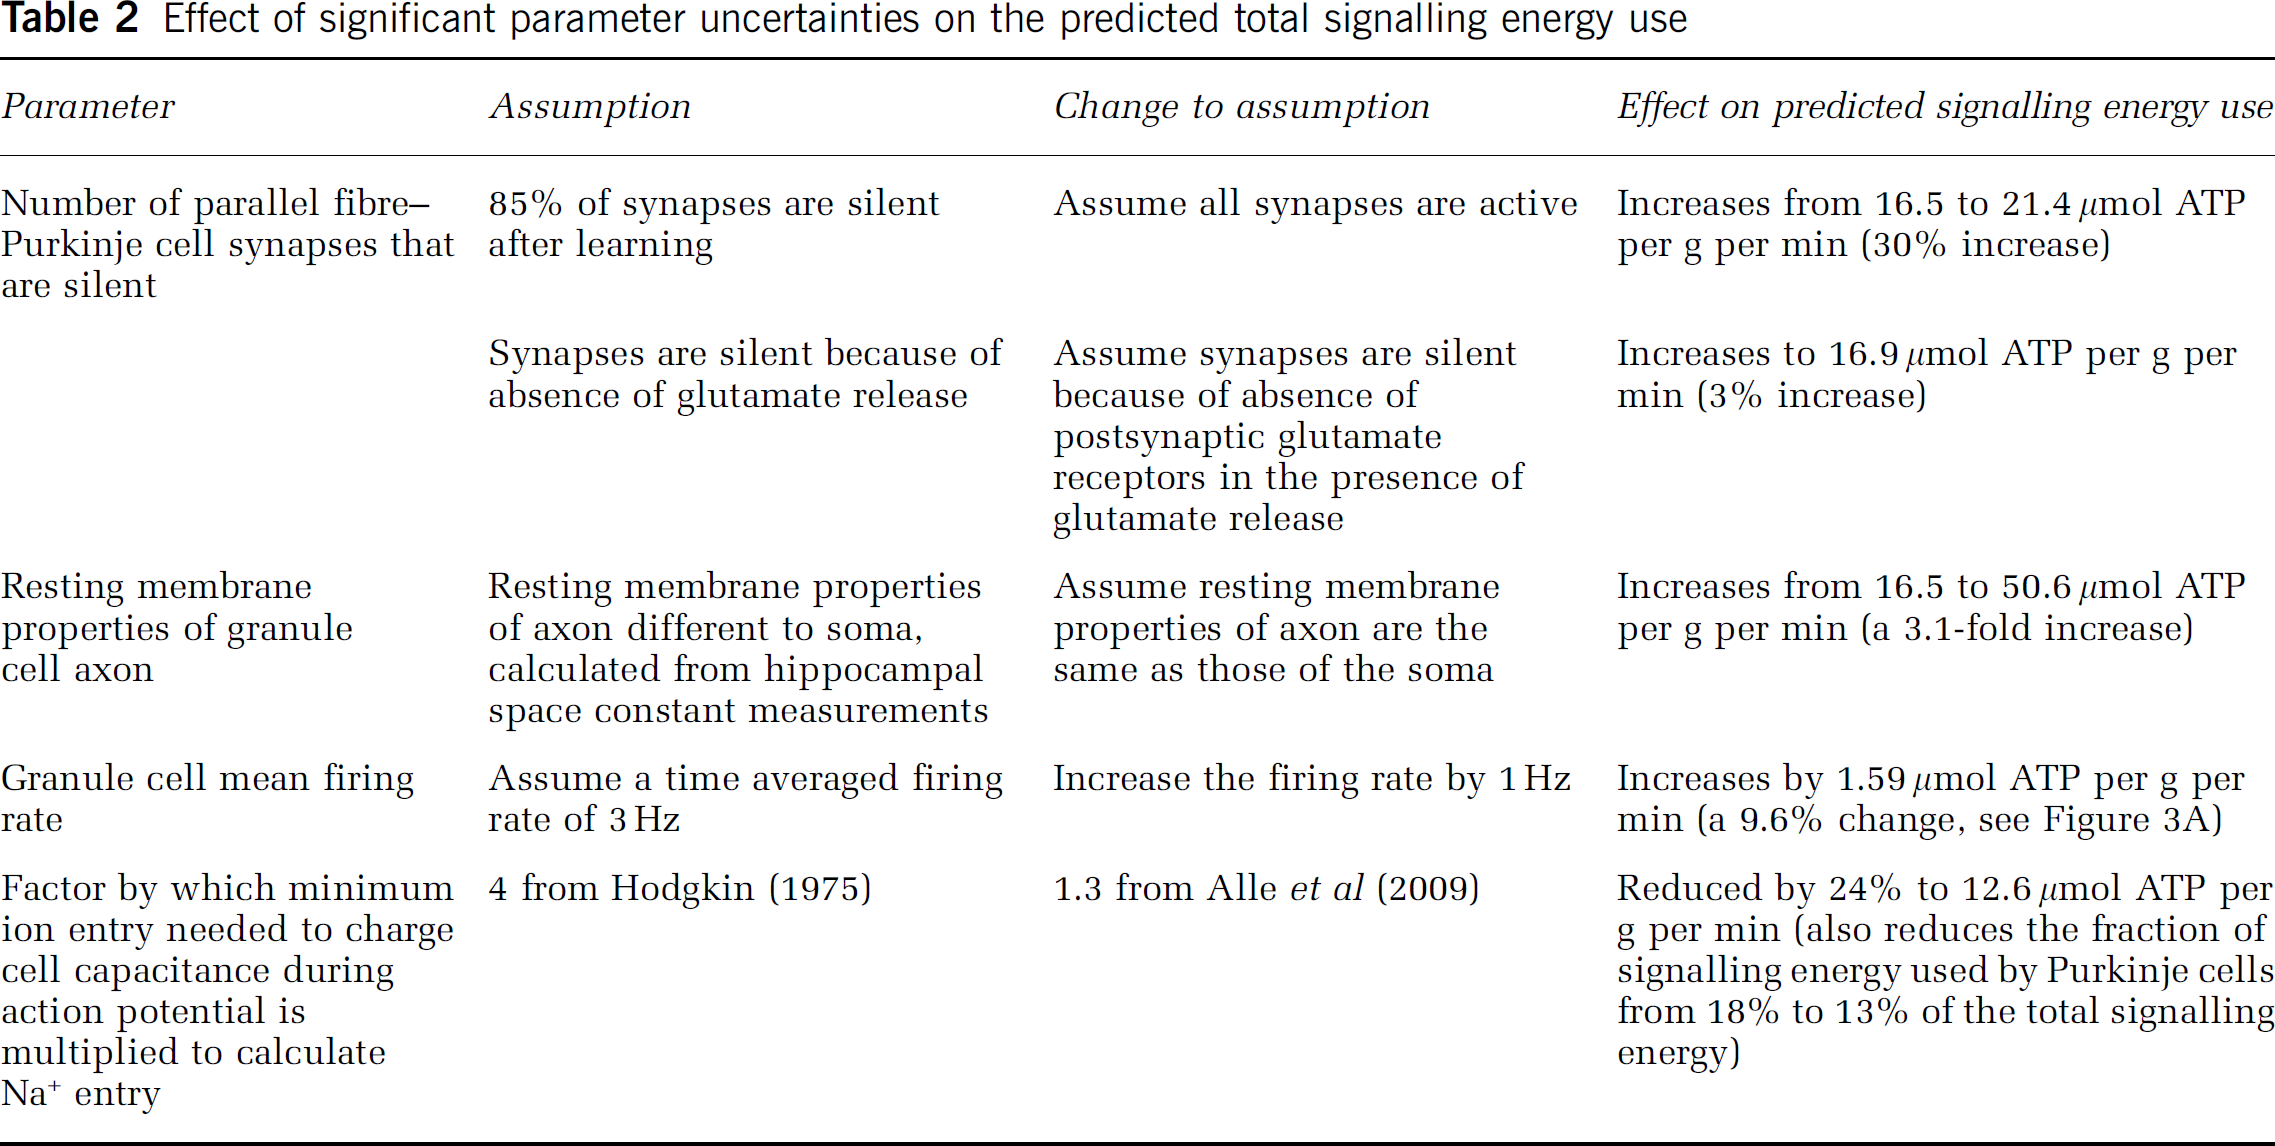
Second, the resting membrane properties of the 4.5 mm long granule cell axon are unknown, because measuring the input resistance at the soma probably only determines the conductance of the soma, the short dendrites, and the part of the axon near the soma: much of the axon is too electrotonically distant to contribute. We therefore calculated the axon membrane conductance from measurements of the space constant of hippocampal axons (Alle and Geiger, 2006) (scaled to the dimensions of the parallel fibres: see Supplementary Information). This gave a specific resistance for the axon membrane that was 20.7-fold higher than that of the soma and dendrites. If we assumed the axon membrane had the same specific resistance as the membrane around the soma, then this would increase the ATP consumption on the axonal resting potential by a factor of 20.7 over the value we actually use in the model, increasing the total signalling energy expenditure in the cerebellar cortex to 51 μmol ATP per g per min, 2.5-fold larger than the experimentally measured cerebellar cortical energy expenditure (Sokoloff et al, 1977).
The third uncertain parameter in our analysis is the mean firing rate of granule cells. Using two independent approaches, we estimated this to be ∼3 Hz (see Materials and methods), and explored the effect of varying this parameter (Figure 3A). If this parameter were chosen wrongly it would have a large effect on the predicted energy use of the cerebellar cortex. Although an
Finally, Alle et al (2009) suggested that the Na+ and K+ currents producing action potentials in hippocampal axons overlap in time less than originally thought (Hodgkin, 1975). If this is true for cerebellar axons, the Na+ entry underlying action potentials should be calculated by multiplying the minimum charge needed to charge the cell capacitance by a factor of 1.3 (Alle et al, 2009), rather than by 4 (Hodgkin, 1975) as used in the Supplemental Information. This would reduce threefold the calculated action potential costs (allowing housekeeping energy to be higher than suggested above as the total measured energy use (Sokoloff et al, 1977) is unchanged). The distribution of ATP use on subcellular processes would also alter, with a higher percentage of ATP use being on other processes, predominantly synaptic currents (and the resting potential for granule cells). Importantly, the idea that energy use is mainly on principal cell firing would be further undermined if action potential costs are lower than we predict (Table 2).
Relationship of Energy Use to Energy Supply
The organization of the cortex is often matched by the distribution of the microvasculature: brain areas with a higher metabolic demand show a higher vascular density (see Weber et al, 2008, and references therein). We tested whether the energy use predicted in this paper was correlated with the energy supply available to the cerebellar layers.
The predicted laminar distribution of energy use across the cerebellar cortex was calculated by summing energy consumed in the parts of the neurons and glial cells in the molecular layer and the granular layer (Figure 4A, including half of the Purkinje cell somata in each layer). The large amount of ATP consumed by the granule cell action and resting potentials, and by postsynaptic currents and action potentials in Purkinje cells, results in the molecular layer being predicted to use 54% of the total ATP consumption, and the granular layer 46% (Figure 4B), a ratio of 1.15.
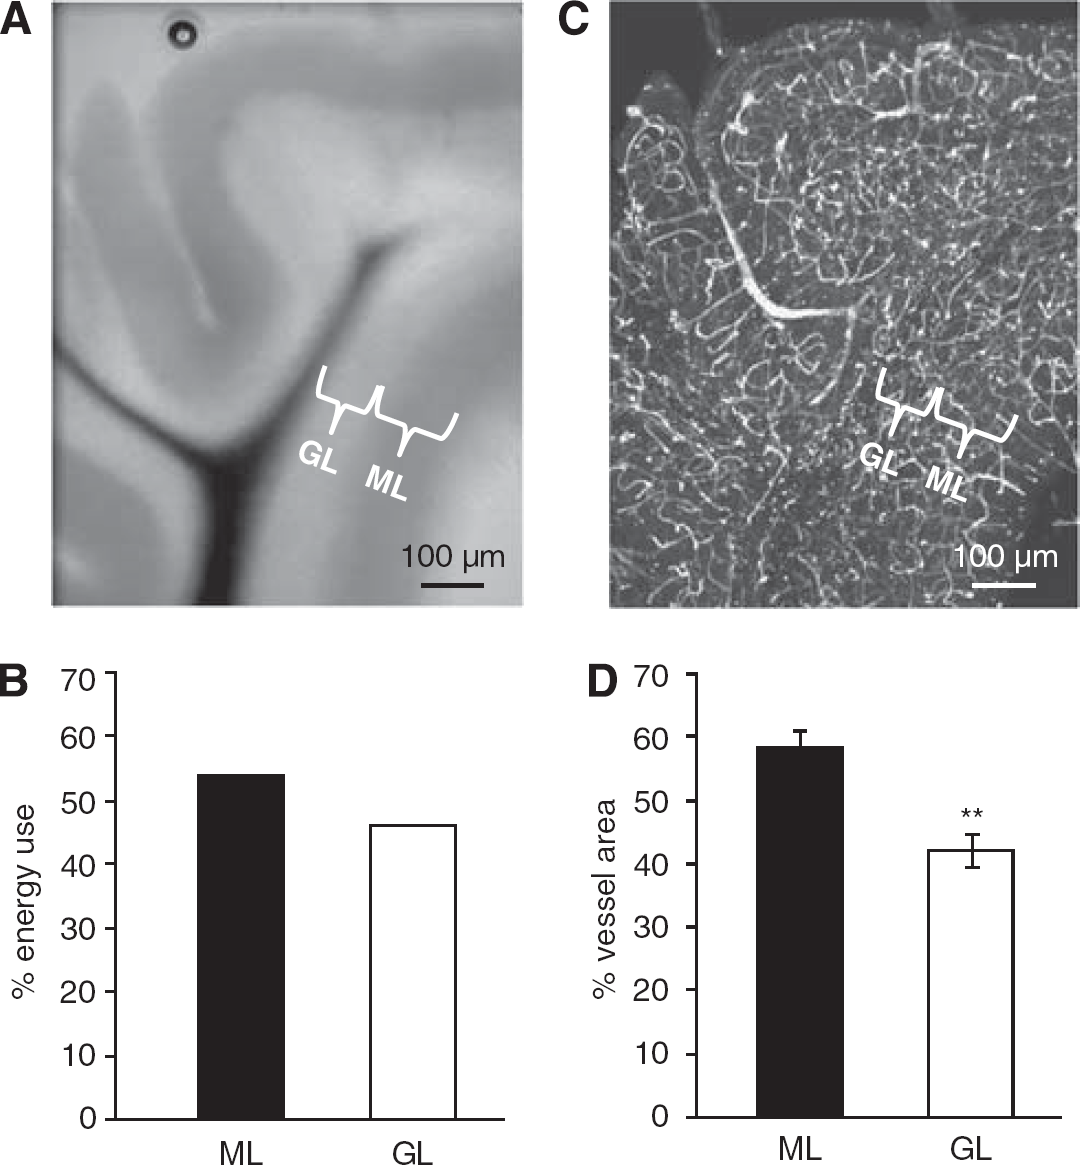
Comparing the predicted laminar distribution of energy use with the observed distribution of blood vessels. (
To test how the laminar distribution of energy use was served by the energy supply provided by blood vessels, we used confocal imaging of the blood vessels to measure the surface area available for oxygen diffusion and glucose transport in each lamina (Figure 4C). The vessel surface area was divided between the layers with 58% ± 3% and 42% ± 3% (
Discussion
We have constructed an energy budget for the cerebellar cortex from the bottom up, calculating the energy use on synaptic, action, and resting potentials of the different cerebellar cortical cells from their measured anatomical and physiological properties, defined by ∼300 parameters. Our analysis reveals interesting features of how energy use relates to neural computation, and how the cerebellum has been ‘designed’ by evolution. The following discussion addresses six major unresolved questions about the use of energy by the brain.
Which Cells Consume the Most Energy in Neural Circuits?
Although it has been widely assumed that the energy use of a brain area, and functional imaging signals based on this, mainly reflect the spiking activity in the principal neurons of that area, recent reports have questioned this (Logothetis et al, 2001). We predict that the principal Purkinje neurons in the cerebellum use only a small fraction of the energy consumed by the cerebellar cortex. Energy consumption by the much larger number of granule cells dominates that of the Purkinje cells (Figure 1C). Consequently, altering the firing rate of the Purkinje cells alone has little effect on the total energy consumption of the cerebellar cortex, whereas altering the mean firing rate of granule cells alone has a profound effect (Figure 3A).
How do Inhibitory Neurons Contribute to Energy Use and Functional Imaging Signals?
Although it is commonly accepted that signals generated by glutamate signalling, rather than energy use, drive blood flow (Attwell and Iadecola, 2002), we have limited information on how inhibitory neurons contribute to energy use or functional imaging signals (Buzsaki et al, 2007). For the cerebellar cortex we predict that energy use is split between excitatory and inhibitory cells in a roughly 2.8:1 ratio (Figure 3B). This reflects the relative numbers of excitatory and inhibitory cells present, but also their size. Each Purkinje cell consumes 72 times more energy than each granule cell (Figure 1B), because of the larger ion fluxes across its much larger membrane. Although each inhibitory neuron is metabolically costly compared with each granule cell, when the number of cells is taken into account, inhibitory cells use far less energy than excitatory cells. Furthermore, although reversal of the ion movements generating synaptic currents consumes a significant fraction of the cerebellar cortical energy use (Figure 1D), essentially all of this energy is used on excitatory synaptic currents: reversal of the Cl− movements underlying IPSCs costs much less ATP than reversal of the Na+ entry generating EPSCs (see Supplementary Information). Despite reports that GABA and neuropeptides released from interneurons modulate blood vessel diameter (Fergus and Lee, 1997; Cauli et al, 2004), the ability of glutamate (but not GABA) receptor antagonists (Li and Iadecola, 1994; Mathiesen et al, 1998) to suppress the neural activity-induced increases of blood flow that underlie positive BOLD fMRI signals suggests that the main contribution of inhibitory neurons to functional imaging signals may be to modulate the activity of excitatory neurons, thus altering the glutamate release which generates blood flow increases (Attwell and Iadecola, 2002).
How is Energy Use Associated with Different Stages of a Computational Algorithm?
If we divide cerebellar computation into re-mapping from mossy fibre input action potentials to action potentials in the granule cell somata, propagation of the remapped information to Purkinje cells, and computation by Purkinje cells of an output signal (Tyrell and Willshaw, 1992), the relative ATP use on these processes is 42%:40%:18% (Figure 3C). Thus, most ATP is consumed by the granule cells, and not by the principal output neurons. If this were true in other brain areas it would undermine the notion that most energy use, and functional imaging signals, reflect activity in the principal output neurons of an area (see also Logothetis et al, 2001; Niessing et al, 2005; Kocharyan et al, 2008). The high ATP usage in granule cells suggests that the ability to store a large number of motor patterns, which is conferred by their re-mapping of information (Tyrell and Willshaw, 1992), provided a sufficient advance in motor performance for evolution to allocate blood vessels to supply the associated large energy expenditure in these cells.
What ‘Design Features’ Reduce the Energy Expended on Neural Computations?
Cerebellar energy consumption would be much higher were it not for two key properties of the granule cells. First, once the cerebellum has stored patterns of motor information, 85% of the granule cell parallel fibre synapses generate no synaptic current (Isope and Barbour, 2002). This is predicted for optimal information storage by Purkinje cells (Brunel et al, 2004) or for optimizing cerebellar noise processing (Porrill and Dean, 2008), but also reduces the signalling energy consumption of the cerebellar cortex by 23% (see Results). Second, we predict, based on measurements of the electrical space constant of hippocampal axons (Alle and Geiger, 2006), that at the resting potential the axon of granule cells has a much higher specific resistance than the soma and dendrites, which reduces 21-fold the energy expended on maintaining the axonal resting potential (see Results). Consequently, the energy consumption of the molecular layer is reduced by 79%. A lower resting Na+ influx per membrane area of the axon, compared with the soma and dendrites, may reflect a design principle setting the specific conductance in the two subcellular areas. The time scale of processing of subthreshold signals in dendrites is partly limited by the membrane time constant, the product of cell resistance and capacitance. In the dendrites and soma the membrane resistance cannot be too high as this will increase the time constant and limit the speed with which synaptic currents can change the membrane potential (Attwell and Gibb, 2005), but this is not a constraint in the axon, where the conductance will increase dramatically as the action potential approaches. Indeed, previous work has shown that the space constant in hippocampal axons (700 μm, Alle and Geiger, 2006) is much longer than that in neocortical dendrites (400 μm, Ulrich and Stricker, 2000), despite the axon having a smaller diameter, implying a specific membrane resistivity that is approximately 20-fold higher.
How Does Energy Use Vary with Different Computational Architectures?
The neuronal size and synaptic connectivity differ dramatically between the granular layer, with many tiny granule cells each receiving very few input synapses, and the molecular layer, where the much smaller number of much larger Purkinje cells each receive a very large number of inputs. Indeed, from the dimensions of the cells (Supplementary Information), neural computation is based on 8.6-fold more neuronal (mainly parallel fibre) membrane area per volume of tissue in the molecular layer than in the granular layer.
We predicted the energy expenditure to be 1.15-fold larger in the molecular layer than in the granular layer. The relative thickness of the molecular and granular layers (with half of the Purkinje cell layer allotted to each) is 1.50 (Harvey and Napper, 1988), implying a ratio of energy usage/volume of 0.77:1 for the molecular/granular layers. Thus, despite their extremely different neuronal architecture, the cerebellum has evolved to have a similar density of energy usage in the molecular and granular layers, possibly because energy usage is limited by the density of blood vessels supplying energy.
To compare neural energy use with energy supply, we tested whether the vascular surface area in the different cerebellar layers was matched to the local energy expenditure. Comparing the 1.15-fold ratio of predicted energy usage, with the ratio of the blood vessel surface area in the two layers available for the supply of oxygen and glucose, revealed an approximate match (Figure 4). Thus, although a more detailed analysis of vessel area, or of direct indices of energy use such as glucose uptake or mitochondrion number, is beyond the scope of this study, the distribution of blood vessels to the cerebellar layers roughly matches the ATP consumption needed for the neural computations performed in the different layers.
How Energetically Expensive is it to Store Information to Guide Future Behaviour?
We calculate that ∼1011 ATP molecules per sec are used on signalling for each Purkinje cell (and associated neurons and glia). The information storage capacity of each Purkinje cell is disputed; Brunel et al (2004) suggest that each Purkinje cell stores ∼40,000 input–output associations, or ∼5 kB of information, whereas Steuber et al (2007) suggest ∼100 patterns stored for 1,000 active parallel fibre inputs, or 12.5 B of information. Using an energy production for ATP hydrolysis of 31kJ/mol, this implies a resting energy consumption of between 1 and 400 mW/GB of stored motor patterns, respectively.
Footnotes
Acknowledgements
We thank K Kitamura and M Kano for providing data on Purkinje cell input resistance
The authors declare no conflict of interest.
References
Supplementary Material
Please find the following supplemental material available below.
For Open Access articles published under a Creative Commons License, all supplemental material carries the same license as the article it is associated with.
For non-Open Access articles published, all supplemental material carries a non-exclusive license, and permission requests for re-use of supplemental material or any part of supplemental material shall be sent directly to the copyright owner as specified in the copyright notice associated with the article.