P values and confidence intervals (CIs) are the most widely used
statistical indices in scientific literature. Several surveys have revealed that
these two indices are generally misunderstood. However, existing surveys on this
subject fall under psychology and biomedical research, and data from other
disciplines are rare. Moreover, the confidence of researchers when constructing
judgments remains unclear. To fill this research gap, we surveyed 1,479
researchers and students from different fields in China. Results reveal that for
significant (i.e., p < .05, CI does not include zero) and
non-significant (i.e., p > .05, CI includes zero)
conditions, most respondents, regardless of academic degrees, research fields
and stages of career, could not interpret p values and CIs
accurately. Moreover, the majority were confident about their (inaccurate)
judgements (see osf.io/mcu9q/ for
raw data, materials, and supplementary analyses). Therefore, as
misinterpretations of p values and CIs prevail in the whole
scientific community, there is a need for better statistical training in
science.
Statistical inference has played a crucial role in scientific research since the latter
half of the 20th century by bridging data and hypothesis testing (Gigerenzer, Swijtink,
Porter, & Daston, 1990). Currently, the most
common statistical index in scientific literature is the p value,
despite repeated criticism of its thoughtless use (Benjamin et al., 2018; Cumming, 2013;
Cumming et al., 2007; McCloskey & Ziliak,
2008). In the last 20 years, items (e.g.,
figures and tables) displayed in the top three multidisciplinary journals
(Nature, Science, and PNAS)
progressively relied on p values (Cristea & Ioannidis, 2018).
However, the widely used p value is also generally misunderstood.
Several surveys in psychology show that most researchers and students misinterpret
p values (Badenes-Ribera, Frias-Navarro, Iotti, Bonilla-Campos,
& Longobardi, 2016; Badenes-Ribera,
Frías-Navarro, Monterde-i-Bort, & Pascual-Soler, 2015; Haller & Krauss, 2002; Lyu,
Peng, & Hu, 2018; Oakes, 1986). This misinterpretation may result in the misuse and
abuse of p values, such as the cult of statistical significance
(McCloskey & Ziliak, 2008) and
p-hacking (Head, Holman, Lanfear, Kahn, & Jennions, 2015; Nuijten, Hartgerink, van Assen, Epskamp,
& Wicherts, 2016), which might be the main
reason behind the replication crisis in psychology (Hu et al., 2016; John, Loewenstein, & Prelec, 2012; Simmons, Nelson, & Simonsohn, 2011).
An alternative to p values is effect sizes and their confidence
intervals (CIs). In particular, CIs represent the variations of the effect size and help
researchers produce improved statistical inference (Coulson, Healey, Fidler, &
Cumming, 2010). However, CIs are also difficult
to understand. For example, Hoekstra, Morey, Rouder, and Wagenmakers (2014) surveyed researchers’ understanding of CIs in a similar
approach to surveys on the p value and found that most researchers
misunderstood CIs. This phenomenon is confirmed by surveys from multiple countries
(Greenland et al., 2016; Lyu et al., 2018; Morey, Hoekstra, Rouder, & Wagenmakers,
2016).
Even with the availability of multiple surveys, several questions remain unanswered.
First, all available data are from psychological researchers or researchers in
biomedical science. Only a few studies surveyed researchers in other disciplines. Given
that p values and CIs are frequently used in other fields as much as in
psychology (Colquhoun, 2014; Vidgen &
Yasseri, 2016), the extent of the understanding
of researchers’ and students’ in other fields of these statistical indices is an open
question. Second, the majority of previous surveys failed to identify how confident the
respondents were of their own judgment. Third, most previous surveys only focused on the
statistically significant statement, though non-significant results are equally
important and often miscomprehended (Aczel et al., 2018). To address these issues, a survey is conducted to investigate the
following aspects related to the misinterpretation of p values and CIs:
(1) whether the misinterpretation prevails across different fields of science; (2)
whether researchers interpret significant and nonsignificant results differently; and
(3) whether researchers are aware of their own misinterpretations, such as how confident
they are when they endorse a statement toward p values or CIs.
In this survey, we adopt four questions from previous studies (Gigerenzer, 2004; Haller & Krauss, 2002; Hoekstra et al., 2014) for p values and CIs. These questions were used in
Germany (Haller & Krauss, 2002), UK (Oakes,
1986), Spain (Badenes-Ribera et al., 2015), Italy (Badenes-Ribera et al., 2015), Chile (Badenes-Ribera et al., 2015) and China (Hu et al., 2016; Lyu et al., 2018). We selected
four items to minimize the length of the questionnaire. We opted for these particular
items because they are widely used and they enable a comparison between the results of
the present and previous surveys. These items have several limitations. For example,
certain items (e.g., “The probability that the true mean is greater than 0 is at least
95%”; “The probability that the true mean equals 0 is smaller than 5%.”) in the study of
Hoekstra et al. (2014) could not be considered
“incorrect” due to varied understanding of the conception “probability” (Miller &
Ulrich, 2015).
Materials and methods
Participants
All participants were recruited through online advertisements on
WeChat-Public-Accounts; the subscribed accounts enable users to obtain
information and interact with them (Montag, Becker, & Gan, 2018). Specifically, our advertisements were spread
via The Intellectuals (知识份子), Guoke Scientists (果壳科学人), Capital for Statistics
(统计之都), Research Circle (科研圈), 52brain (我爱脑科学网), and Quantitative Sociology
(定量群学). Advertisements posted among the WeChat-Public-Accounts are identical,
emphasizing the importance of statistics and encouraging readers to devote their
time for scientific purposes by clicking the Qualtrics link at the end of the
post and participating in our survey. A total of 4,206 respondents from
different backgrounds (respondents’ academic background was based on the degree
they awarded in China) voluntarily participated in the survey. However, 2,727 of
them withdrew before completing the survey, leaving a sample size of 1,479. All
participants read and signed the informed consent form prior to their
participation. Data were collected from September 2017 to November 2018. The
response rate (35%) was relatively higher than previous studies in psychology;
specifically, 10% and 7% higher response rates in comparison with Badenes-Ribera
et al. (2015) and Badenes-Ribera et al.
(2016) respectively.
Materials
The questions on the interpretation of p values and CIs were
adopted from Lyu et al. (2018). These
questions were first translated by C-P Hu and then reviewed by other bilingual
psychological researchers (X-K Lyu and Dr Fei Wang at Tsinghua University) to
ensure accuracy. Our survey included scenarios on p values and
CIs. To investigate the understandings of non-significant results, we created
two versions of the survey: one used a significant scenario (p
< .05 and CIs did not include zero) and the other used a non-significant
scenario (i.e., p > .05 and CIs included zero). Participants
were randomly assigned to the significant and non-significant version by
Qualtrics.
Questions for p values
This scenario was adopted from previous studies (Gigerenzer, 2004; Haller & Krauss, 2002; Lyu et al., 2018). Respondents first read a research context and were then
asked to judge whether the four statements could be logically inferred from
the p values of the results. To explore the effect of
significant and non-significant results, the p value was
either smaller than .05 or greater than .05. Respondents first read the
following scenario: Suppose you have a treatment that you suspect may alter
performance on a certain task. You compare the means of your control and
experimental groups (50 subjects in each sample). Your hypotheses are as
follows. H0: No significant difference exists between the experimental and
the control groups. H1: Significant difference exists between the
experimental and the control groups. Further, suppose you use a simple
independent means t test, and your result is
t = 2.7, df = 98, p =
.008 (in the significant version) or t = 1.26,
df = 98, p = .21 (in the
non-significant version).
Participants were asked to judge the following statements (note that the
italicized phrases are different from two versions of our survey; the
non-significant version is inside a bracket): (a) You have absolutely
disproved (proved) the null hypothesis; (b) You have found the probability
of the null (alternative) hypothesis true; (c) You are aware, if you decide
to (not to) reject the null hypothesis of the probability that you are
making the wrong decision; (d) You have a reliable
(unreliable) experimental finding in the sense that you
would obtain a significant result on 99% (21%) of occasions if,
hypothetically, the experiment was repeated multiple times.
Questions for CIs
This scenario was also adopted from previous studies (Hoekstra et al., 2014; Lyu et al., 2018). As in the p-value
situation, respondents first read one of the two versions of the context in
which the CIs did (significant) or did not (non-significant) include zero: A
researcher conducts an experiment, analyzes the data, and reports: “The 95%
(bilateral) confidence interval of the mean difference between the
experimental group and the control group ranges from .1 to .4 (or from –.1
to .4 in the non-significant version).”
They were then required to make a judgment about the accuracy of each
statement (note that the italicized phrases are different in the two
versions of our survey; the non-significant version is in brackets): (a) A
95% probability exists that the true mean lies between .1 (–.1) and .4 (.4);
(b) If we were to repeat the experiment over and over, then 95% of the time
the true mean falls between .1 (–.1) to .4 (.4); (c) If the null hypothesis
is that no difference exists between the mean of experimental group and
control group, then the experiment has disproved (proved) the null
hypothesis; (d) The null hypothesis is that no difference exists between the
means of the experimental and the control groups. If you decide to (not to)
reject the null hypothesis, then the probability that you are making the
wrong decision is 5%. The English-translated questionnaires are available
at: osf.io/mcu9q/.
After generating a judgment for each statement, respondents were immediately
asked to indicate their confidence about the judgment from 1 (not
confident at all) to 5 (very confident). All
statements cannot be logically inferred from the results. Hence, any
statement in which the “True” option was chosen would be coded as
misinterpreting p value or CIs.
Data analysis
R 3.5.3 was used to analyze the data. The error rates of different groups of
participants were compared with a chi-square test under the NHST framework.
In addition, we reported Bayes factor (BF) as complementary indices for
statistical inference. Bayes factors are calculated using JASP 8.6.0, with
the default prior (Hu, Kong, Wagenmakers, Ly, & Peng, 2018; Love et al., 2019). The following criteria for Bayesian
inference are used: 1 < BF10 < 3 indicates anecdote evidence for H1, 3
< BF10 < 6 represent weak evidence for H1, 6 < BF10 < 10 means
moderate evidence for H1, 10 < BF10 < 100 means strong evidence for
H1, 100 < BF10 means overwhelming evidence for H1 (Jeffreys, 1961). All analysis codes are available
at osf.io/mcu9q/.
Results
A total of 1,479 participants possess valid data in the p value or
CI items. Sample sizes for the significant and the non-significant versions were
n = 759 and n = 720 respectively. All the
statements about p values and CIs cannot logically be inferred from
the given context. Hence, refer to the supplementary materials where we calculated
the error rate on each item to identify why these statements are wrong.
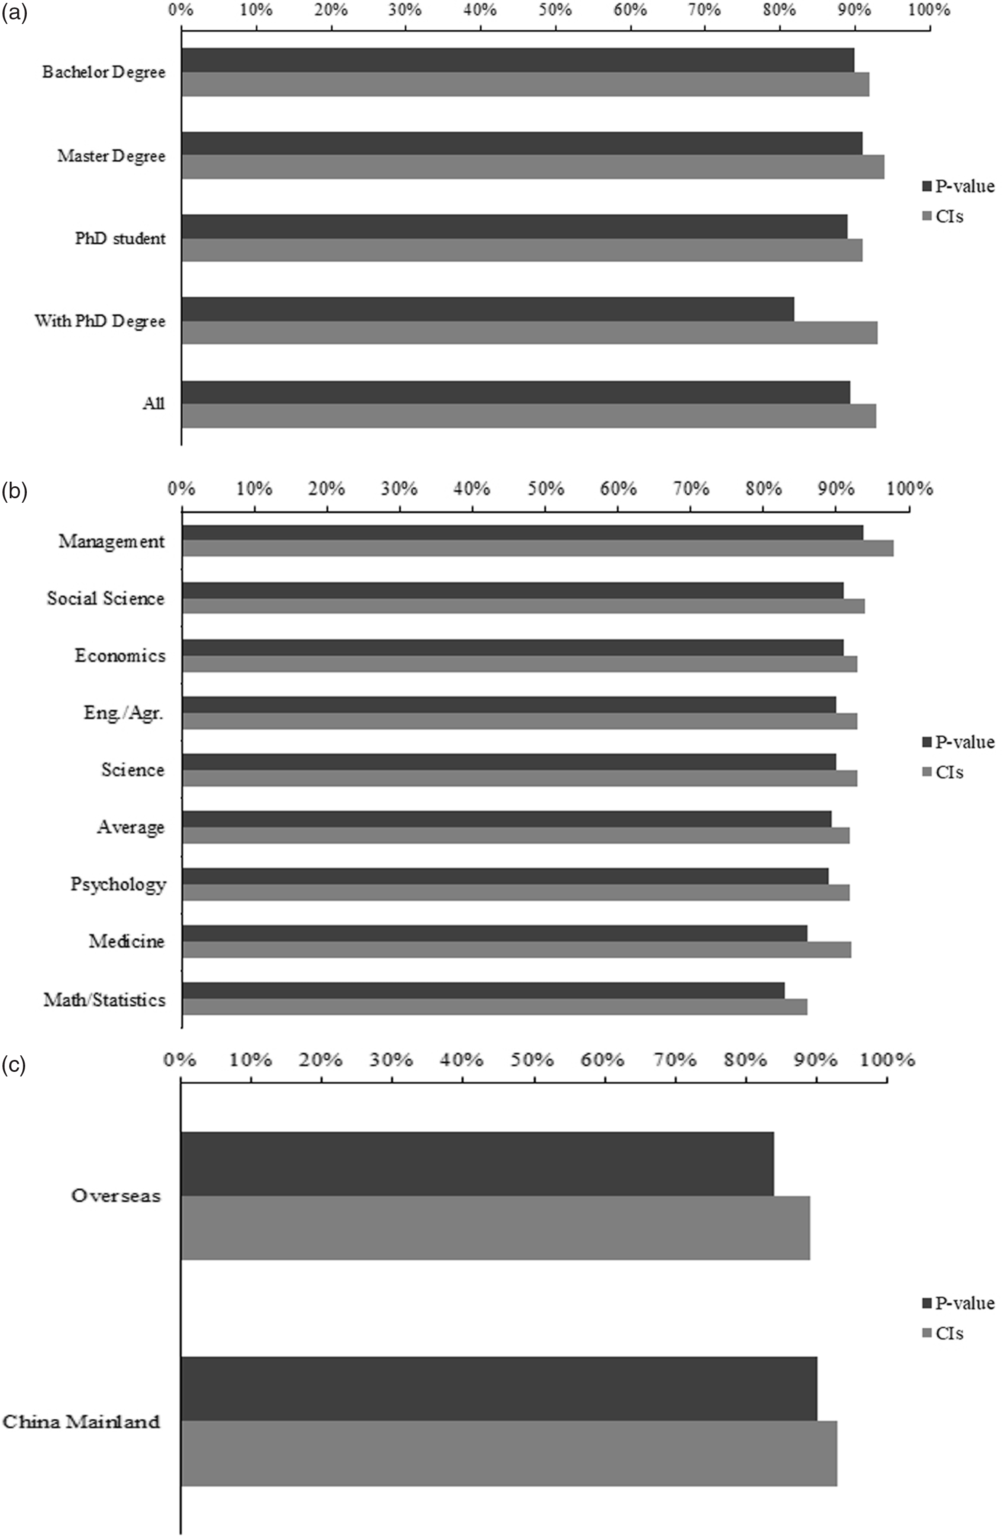
In general, the results (all the raw data are available at osf.io/mcu9q/) show that 89% of
respondents had at least one error when interpreting a p value, and
93% of respondents committed at least one error when interpreting CIs. The
percentage of misinterpretation failed to show differences across educational
attainment (Figure 1a) or academic background
(Figure 1b and Table 1). This pattern remains when we limited our analysis to
postgraduates and researchers (excluding respondents with bachelor as highest
degree, see Supplementary result 1, Figure S1).
Percentage of misinterpretation of p values and CIs. (a)
Percentage of misinterpretation by education attainment: Bachelor degree
= undergraduates or their highest degree was bachelors, Master’s degree
= masters students or their highest degree was a master’s; (b)
Percentage of misinterpretation by disciplines: Discipline division was
based on the degree of the respondents awarded in China. Science =
disciplines awarded a degree of natural science, excluded Math and
statistics. Engr/Agr. = engineering/agronomy, Social Science = sociology
or other social sciences; (c) Percentage of misinterpretation by the
location where the respondents received their highest degree.
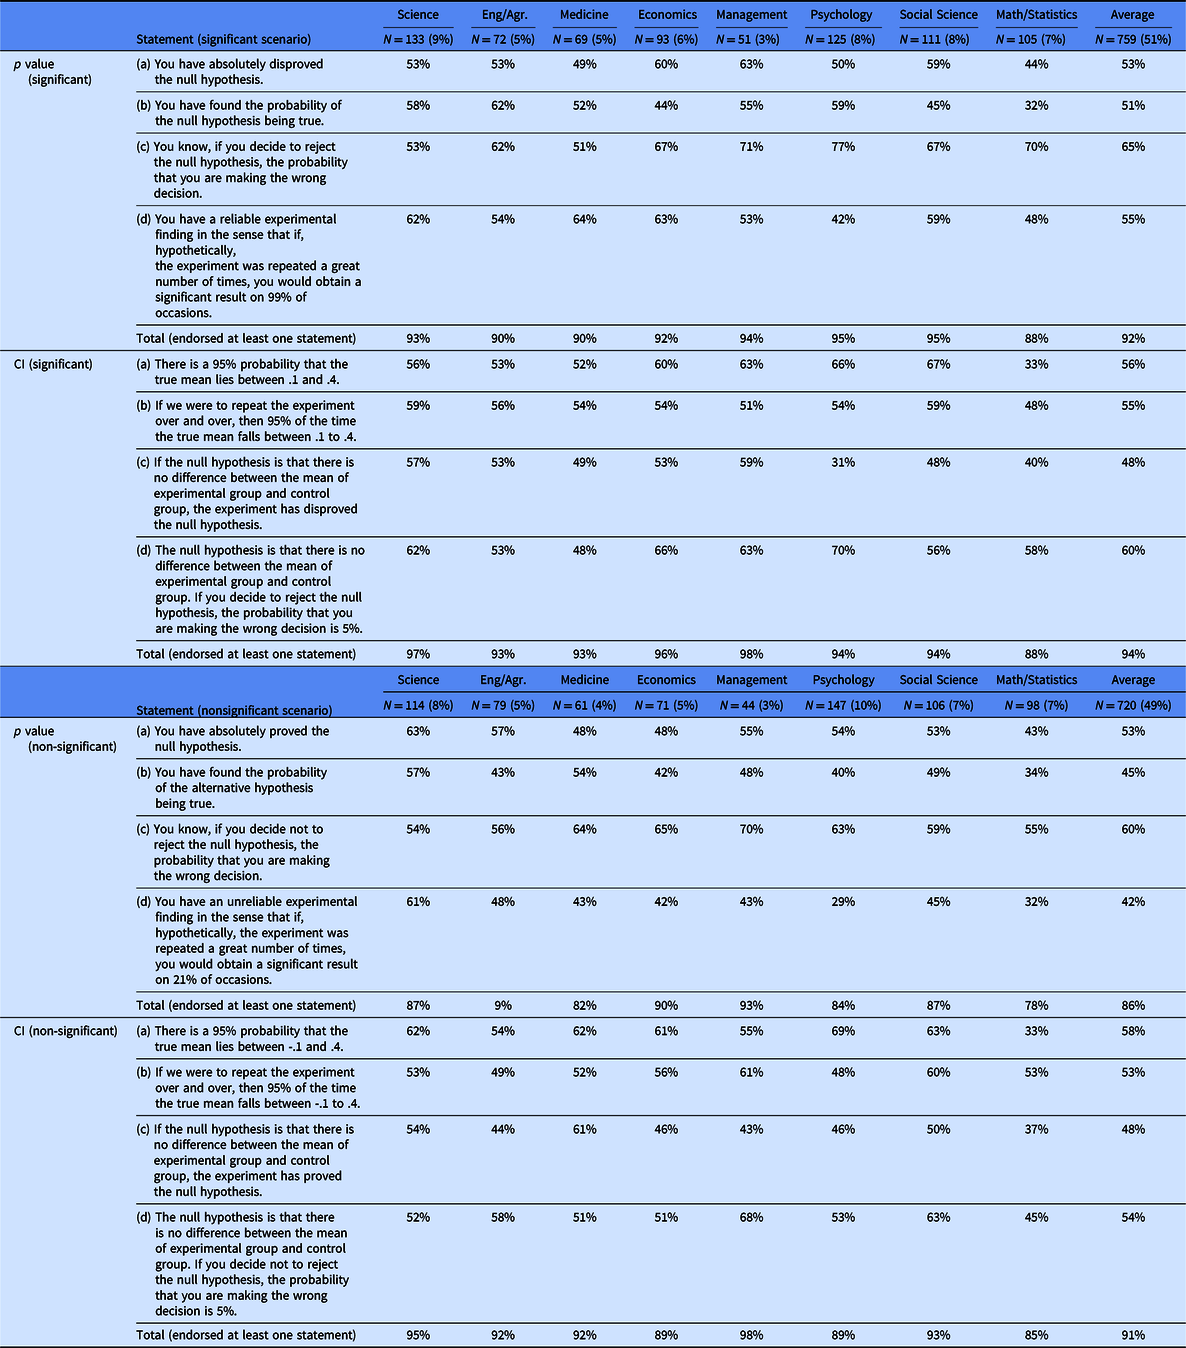
Percentage of misinterpretation of p values and CIs for
each statement
Statement (significant
scenario)
Science
Eng/Agr.
Medicine
Economics
Management
Psychology
Social Science
Math/Statistics
Average
N = 133 (9%)
N = 72 (5%)
N = 69 (5%)
N = 93 (6%)
N = 51 (3%)
N = 125 (8%)
N = 111 (8%)
N = 105 (7%)
N = 759 (51%)
p value
(significant)
(a) You have
absolutely disproved the null hypothesis.
53%
53%
49%
60%
63%
50%
59%
44%
53%
(b) You have found
the probability of the null hypothesis being true.
58%
62%
52%
44%
55%
59%
45%
32%
51%
(c) You know, if you
decide to reject the null hypothesis, the probability that
you are making the wrong decision.
53%
62%
51%
67%
71%
77%
67%
70%
65%
(d) You have a
reliable experimental finding in the sense that if,
hypothetically, the experiment was repeated a great number
of times, you would obtain a significant result on 99% of
occasions.
62%
54%
64%
63%
53%
42%
59%
48%
55%
Total (endorsed at
least one statement)
93%
90%
90%
92%
94%
95%
95%
88%
92%
CI (significant)
(a) There is a 95%
probability that the true mean lies between .1 and .4.
56%
53%
52%
60%
63%
66%
67%
33%
56%
(b) If we were to
repeat the experiment over and over, then 95% of the time
the true mean falls between .1 to .4.
59%
56%
54%
54%
51%
54%
59%
48%
55%
(c) If the null
hypothesis is that there is no difference between the mean
of experimental group and control group, the experiment has
disproved the null hypothesis.
57%
53%
49%
53%
59%
31%
48%
40%
48%
(d) The null
hypothesis is that there is no difference between the mean
of experimental group and control group. If you decide to
reject the null hypothesis, the probability that you are
making the wrong decision is 5%.
62%
53%
48%
66%
63%
70%
56%
58%
60%
Total (endorsed at
least one statement)
97%
93%
93%
96%
98%
94%
94%
88%
94%
Statement
(nonsignificant scenario)
Science
Eng/Agr.
Medicine
Economics
Management
Psychology
Social Science
Math/Statistics
Average
N =
114 (8%)
N =
79 (5%)
N =
61 (4%)
N =
71 (5%)
N =
44 (3%)
N =
147 (10%)
N =
106 (7%)
N =
98 (7%)
N =
720 (49%)
p value
(non-significant)
(a) You have
absolutely proved the null hypothesis.
63%
57%
48%
48%
55%
54%
53%
43%
53%
(b) You have found
the probability of the alternative hypothesis being
true.
57%
43%
54%
42%
48%
40%
49%
34%
45%
(c) You know, if you
decide not to reject the null hypothesis, the probability
that you are making the wrong decision.
54%
56%
64%
65%
70%
63%
59%
55%
60%
(d) You have an
unreliable experimental finding in the sense that if,
hypothetically, the experiment was repeated a great number
of times, you would obtain a significant result on 21% of
occasions.
61%
48%
43%
42%
43%
29%
45%
32%
42%
Total (endorsed at
least one statement)
87%
9%
82%
90%
93%
84%
87%
78%
86%
CI (non-significant)
(a) There is a 95%
probability that the true mean lies between -.1 and .4.
62%
54%
62%
61%
55%
69%
63%
33%
58%
(b) If we were to
repeat the experiment over and over, then 95% of the time
the true mean falls between -.1 to .4.
53%
49%
52%
56%
61%
48%
60%
53%
53%
(c) If the null
hypothesis is that there is no difference between the mean
of experimental group and control group, the experiment has
proved the null hypothesis.
54%
44%
61%
46%
43%
46%
50%
37%
48%
(d) The null
hypothesis is that there is no difference between the mean
of experimental group and control group. If you decide not
to reject the null hypothesis, the probability that you are
making the wrong decision is 5%.
52%
58%
51%
51%
68%
53%
63%
45%
54%
Total (endorsed at
least one statement)
95%
92%
92%
89%
98%
89%
93%
85%
91%
Note: Discipline division was based on the degree of the respondents
awarded in China. Science = disciplines awarded a degree of natural
science, excluded Math and statistics, Eng/Agr. = engineering/agronomy,
Social Science = sociology or other social sciences.
For the difference between the significant and the non-significant versions, the
error rate for p values was lower in the latter (86%) than in the
former (92%), χ2(1) = 16.841, p < .001,
BF10 = 543.871. This study failed to find strong evidence for the
difference between significant CIs (94%) and non-significant CIs (91%),
χ2(1) = 2.892, p =.049, BF10 = 0.580. For detailed
analysis and figures, see the supplementary materials.
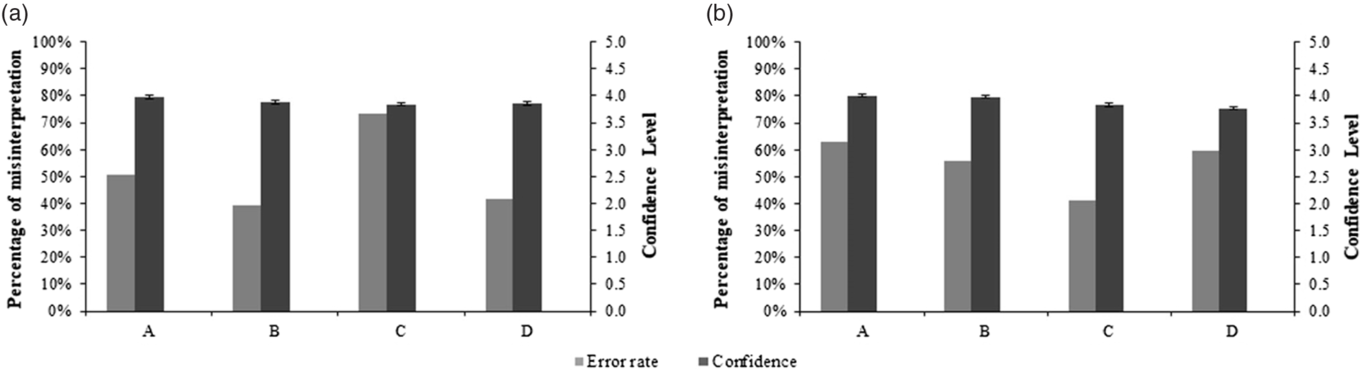
This study discovered that most respondents were confident with the following. In all
four statements for p values and CIs, the averaged confidence was
over 3.8 out of 5 (see Figure 2a and 2b). We also compared the difference in
confidence levels between correct answers and wrong answers by t
test and found that high confidence level for accurate answers exist for certain
items (see Supplementary results 3, Table S1).
Percentage of misinterpretation of p values (a) and CIs
(b) as compared with the average confidence level (error bars present ±1
standard error) for each statement. Horizontal labels (A-D) represent
four incorrect statements about p values or CIs.
Detailed statements can be found in the Materials section; shortly, four
statements of p values are about (A) disprove/prove the
H0, (B) obtain the probability of a true
H0/H1, (C) obtain the probability of type I
error, (D) replication delusion; four statements of CI are about (A) get
the probability to have the true mean, (B) replication delusion, (C)
disprove/prove the H0, (D) get the probability of an
error.
Our exploratory analysis uncovered that respondents who get their highest degree
overseas or in Hong Kong, Macao and Taiwan might have a lower error rate on the
interpretation of p values than those who obtained their highest
degree in Mainland China (See Figure 1c). For
p values, 90% respondents who acquired their highest degree in
Mainland China (n = 1231) had at least one wrong answer, whereas
84% respondents who attained their highest degree overseas (n =
248) had at least one wrong answer, χ2(1) = 6.38, p =
.012, BF10 = 1.654. For CIs, 93% respondents who obtained their highest degree in
Mainland China had at least one wrong answer, whereas 89% respondents who secured
their highest degree overseas had at least one wrong answer, χ2(1) =
4.57, p = .033, BF10 = 0.602. For further analysis of the
difference between Mainland China and Overseas, see Supplementary materials Figure
S1c and S1d.
Discussion
The current survey found that the misinterpretation of p values and
CI was prevalent in the Chinese scientific community, even in certain methodological
fields. The rates of misinterpretation were high for significant or non-significant
p values, and CIs that did or did not include zero. Moreover,
researchers and students were generally confident about their (incorrect)
judgements. These results suggest that researchers generally do not have a good
understanding of these common statistical indices.
The possible reasons for these misconceptions have been discussed in the literature.
For example, Gigerenzer (2004, 2018) suggested that researchers used
p values as a “null ritual”, which has the following steps
(Gigerenzer, 2004):
Set up a null hypothesis of “no mean
difference” or “zero correlation”. Do not specify the predictions of
your own research
hypothesis.
Use 5% as a
convention for rejecting the null hypothesis. If the test is
significant, then accept your research hypothesis. Report the test
result as p < .05, p < .01, or
p < .001, whichever level is met by the obtained
p
value.
Always perform this
procedure.
This “ritual” was “inherited” in psychology by generations of researchers, as
demonstrated by the inaccurate interpretation of statistical significance in the
introductory textbooks of psychology (Cassidy, Dimova, Giguère, Spence, &
Stanley, 2019). Our results confirmed and
extended this view. First, similar to many previous surveys in psychology (Haller
& Krauss, 2002), our results found that
respondents who were teaching statistics had a high error rate (>80%). Thus,
students may have a wrong understanding of p value at the very
beginning. Second, our results extended the scope of previous surveys and suggest
that the “ritual” is not limited to psychology or social science but also to the
entire scientific community. In our survey, the four items represent different
“illusions” that are necessary for justifying the null ritual (Gigerenzer, 2004, 2018).
First, over half of respondents considered p values as evidence to
disprove or prove a null hypothesis (statement A in p value and
statement C in CIs). This “illusion of certainty” (Gigerenzer, 2004, 2018)
justifies the use of null ritual. It may even motivate researchers to interrogate
data to obtain a value smaller than .05 as evidence toward the existence of effects.
This motivation was further enforced by the current publishing system in which
p < .05 is a premise of publication.
Our results also revealed that respondents across different fields share the
“replication delusion” and false Bayesian thinking. Over 50% respondents believe
that 1-p or 1-α can represent the probability of successful
replication (statement D in p-value section and statement B in CI
section). However, p values convey nothing about the replication
rate. As for Statement C in the p-value section, respondents
thought the p value was equal to the type I error rate or type II
error, which confused the probability of data, given the hypothesis, namely P(D|M).
The probability of the hypothesis gives the data, such as P(M|D). This confusion
represents Bayesian wishful thinking.
Methodologists have long discussed the lack of statistical thinking, but its
potential consequences (Cohen, 1962, 1994; Gigerenzer, 2004; Goodman, 2008; Meehl, 1978) were never
heard. Only recently did researchers rediscover these problems with
p values after the “replication crisis”. The “p-war” became one
of the highlights in the field (Amrhein & Greenland, 2017; Amrhein, Greenland, & McShane, 2019; Benjamin et al., 2018; Lakens et al., 2018). The
rationale behind this debate is straightforward, that is, the p
value is the most widely used statistic index, and many problems that have plagued
psychology and social science are related to the misunderstanding of
p values and statistics in general. For example, statistical
power (Bakker, Hartgerink, Wicherts, & van der Maas, 2016) was promoted by Cohen in the 1960s (1962, 1994).
However, the low power problem persisted in psychology (Button et al., 2013; Maxwell, 2004), probably because statistical power is not part of the “null
ritual” (Gigerenzer, 2018). Other similar
issues are questionable research practice (John et al., 2012) and publication bias (Franco, Malhotra, &
Simonovits, 2014), which are probably due to
the “illusion of certainty” among researchers. By revealing that researchers outside
psychology share the same inaccurate understanding of p values and
CIs, our results suggested that other fields might also be threatened by those
problems.
Another important addition to information about the misunderstanding of
p values and CIs is the confidence ratings from respondents.
Most respondents were relatively confident about their own responses. This fact
provides additional evidence that people have a false certainty about their own
understanding, and this inaccurate certainty justifies their use of
p values. Similar to the researcher’s understanding of power
(Bakker et al., 2016), this result revealed
that researchers across different fields may rely on intuition more than statistical
thinking when making research decisions.
In our survey, respondents who received their highest degree abroad performed on the
p-value items better than their peers who acquired their
highest degree in Mainland China. However, this finding did not apply to CI-related
items. The only available explanation for this scenario might be that the
replication crisis was discussed more in the English media than in the Chinese
media. Therefore, students who had studied overseas were more familiar with this
topic than their local counterparts.
Limitations
Several limitations in this survey should be pointed out. First, although we used
a multidisciplinary and relatively large sample, the data were from a convenient
sample, which might not be representative of the entire population. However, our
results may underestimate the rate of misunderstanding of p
values and CIs because our survey did not provide any compensation. Most
respondents might be interested in p values and related issues.
Typically, people who are interested in statistical issues may perform better
than those who are not. Second, as mentioned before, we used four items for
p values and four items for CIs, and the validity of
certain items remain controversial. Ultimately, we found that respondents have
great confidence in their interpretation of p values and CI,
but we did not examine why they are confident and how they make their
decisions.
Conclusion
The current survey showed that researchers from various fields of science may not be
able to correctly interpret p values and CIs. They are unaware of
their own misinterpretation. These results call for deep and accurate statistical
training in all scientific fields.
Supplemental Material
Lyu et al. supplementary material
Lyu et al. supplementary material
Supplementary Materials
Footnotes
Supplementary material
To view supplementary material for this article, please visit https://doi.org/10.1017/prp.2019.28
Acknowledgments
We appreciate the following new online media/websites for circulating our recruitment
information: The Intellectuals (知识份子); Guoke Scientists (果壳科学人); Capital for
Statistics (统计之者); Research Circle (科研圈); 52brain (我爱脑科学网); Quantitative Sociology
(定量群学).
Financial Support
None.
Funding
This study was supported by Social Sciences and Humanities Youth Foundation of
Ministry of Education of China (19YJC840030) and Philosophy and Social Science
Foundation of Tianjin (TJJX18-001).
References
1.
AczelB.PalfiB.SzollosiA.KovacsM.SzasziB.SzecsiP.WagenmakersE.-J. (2018). Quantifying support for the null hypothesis in psychology: An
empirical investigation. Advances in Methods and
Practices in Psychological Science, 1, 357-366.
2.
AmrheinV.GreenlandS. (2017). Remove, rather than redefine,
statistical significance. Nature Human
Behaviour, 2, 4
Badenes-RiberaL.Frias-NavarroD.IottiB.Bonilla-CamposA.LongobardiC. (2016). Misconceptions of the p-value among
Chilean and Italian academic psychologists. Frontiers in Psychology, 7, 1247
5.
Badenes-RiberaL.Frías-NavarroD.Monterde-i-BortH.Pascual-SolerM. (2015). Interpretation of the p
value: A national survey study in academic psychologists from
Spain. Psicothema, 27, 290-295.
6.
BakkerM.HartgerinkC.H.J.WichertsJ.M.van der
MaasH.L.J. (2016). Researchers’ Intuitions About Power in
Psychological Research. Psychological
Science, 27, 1069-1077.
7.
BenjaminD.J.BergerJ.O.JohannessonM.NosekB.A.WagenmakersE.J.BerkR.JohnsonV.E. (2018). Redefine statistical
significance. Nature Human Behaviour, 2, 6-10.
8.
ButtonK.S.IoannidisJ.P.A.MokryszC.NosekB.A.FlintJ.RobinsonE.S.J.MunafoM.R. (2013). Power failure: Why small sample size
undermines the reliability of neuroscience. Nature
Reviews Neuroscience, 14, 365-376.
9.
CassidyS.A.DimovaR.GiguèreB.SpenceJ.R.StanleyD.J. (2019). Failing grade: 89% of
Introduction-to-Psychology textbooks that define or explain statistical
significance do so incorrectly. Advances in Methods
and Practices in Psychological Science, 2, 233-239.
10.
CohenJ. (1962). The statistical power of abnormal-social
psychological research: A review. The Journal of
Abnormal and Social Psychology, 65, 145-153.
11.
CohenJ. (1994). The earth is round (p <.
05). American Psychologist, 49, 997-1003.
12.
ColquhounD. (2014). An investigation of the false discovery
rate and the misinterpretation of p-values. Royal
Society Open Science, 1, 140216
13.
CoulsonM.HealeyM.FidlerF.CummingG. (2010). Confidence intervals permit, but do not
guarantee, better inference than statistical significance
testing. Frontiers in Psychology, 1, 26
14.
CristeaI.A.IoannidisJ.P.A. (2018). P values in display items are ubiquitous
and almost invariably significant: A survey of top science
journals. PLoS One, 13, e0197440
15.
CummingG. (2013). The New Statistics: Why and
How. Psychological Science, 25, 7-29.
16.
CummingG.FidlerF.LeonardM.KalinowskiP.ChristiansenA.KleinigA.WilsonS. (2007). Statistical reform in psychology: Is
anything changing?. Psychological Science, 18, 230-232.
17.
FrancoA.MalhotraN.SimonovitsG. (2014). Publication bias in the social sciences:
Unlocking the file drawer. Science, 345, 1502-1505.
18.
GigerenzerG. (2004). Mindless statistics. The Journal of Socio-Economics, 33, 587-606.
19.
GigerenzerG. (2018). Statistical rituals: The replication
delusion and how we got there. Advances in Methods
and Practices in Psychological Science, 1, 198-218.
20.
GigerenzerG.SwijtinkZ.PorterT.DastonL. (1990). The empire of chance: How probability changed
science and everyday life. 12), Cambridge University
Press.
21.
GoodmanS. (2008). A dirty dozen: Twelve p-value
misconceptions (Vol. 45). Seminars in
Hematology, 45, 135-140.
22.
GreenlandS.SennS.J.RothmanK.J.CarlinJ.B.PooleC.GoodmanS.N.AltmanD.G. (2016). Statistical tests, P values, confidence
intervals, and power: A guide to misinterpretations. European Journal of Epidemiology, 31, 337-350.
23.
HallerH.KraussS. (2002). Misinterpretations of significance: A
problem students share with their teachers?. Methods
of Psychological Research, 7, 1-20.
24.
HeadM.L.HolmanL.LanfearR.KahnA.T.JennionsM.D. (2015). The extent and consequences of p-hacking
in science. PLOS Biology, 13, e1002106
HuC.-P.KongX.-Z.WagenmakersE.-J.LyA.PengK. (2018). Bayes factor and Its implementation in
JASP: A practical primer [in Chinese]. Advances in
Psychology Science, 26, 951-965.
27.
HuC.-P.WangF.GuoJ.SongM.SuiJ.PengK. (2016). The replication crisis in psychological
research [in Chinese]. Advances in Psychology
Science, 24, 1504-1518.
28.
JeffreysH. (1961). Theory of Probability. 3rd
edOxford, UK: Oxford University Press.
29.
JohnL.K.LoewensteinG.PrelecD. (2012). Measuring the prevalence of questionable
research practices with incentives for truth telling. Psychological Science, 23, 524-532.
30.
LakensD.AdolfiF.G.AlbersC.J.AnvariF.AppsM.A.J.ArgamonS.E.ZwaanR.A. (2018). Justify your alpha. Nature Human Behaviour, 2, 168-171.
31.
LoveJ.SelkerR.MarsmanM.JamilT.DropmannD.VerhagenJ.WagenmakersE.-J. (2019). JASP: Graphical statistical software for
common statistical designs. Journal of Statistical
Software, 1, 1-17.
32.
LyuZ.PengK.HuC.-P. (2018). P-value, confidence intervals, and
statistical inference: A new dataset of misinterpretation. Frontiers in Psychology, 9, 868
33.
MaxwellS.E. (2004). The persistence of underpowered studies
in psychological research: Causes, consequences, and
remedies. Psychological Methods, 9, 147-163.
34.
McCloskeyD.N.ZiliakS. (2008). The Cult of Statistical Significance. Ann Arbor, MI: University of
Michigan Press.
35.
MeehlP.E. (1978). Theoretical risks and tabular asterisks:
Sir Karl, Sir Ronald, and the slow progress of soft
psychology. Journal of Consulting and Clinical
Psychology, 46, 806-834.
36.
MillerJ.UlrichR. (2015). Interpreting confidence intervals: A
comment on Hoekstra, Morey, Rouder, and Wagenmakers (2014). Psychonomic Bulletin & Review, 23, 124-130.
37.
MontagC.BeckerB.GanC. (2018). The multipurpose application WeChat: A
review on recent research. Frontiers in
Psychology, 9, 2247
38.
MoreyR.D.HoekstraR.RouderJ.N.WagenmakersE.-J. (2016). Continued misinterpretation of
confidence intervals: Response to Miller and Ulrich. Psychonomic Bulletin & Review, 23, 131-140.
39.
NuijtenM.B.HartgerinkC.H.J.van
AssenM.A.L.M.EpskampS.WichertsJ.M. (2016). The prevalence of statistical reporting
errors in psychology (1985–2013). Behavior Research
Methods, 48, 1205-1226.
40.
OakesM. (1986). Statistical Inference: A Commentary for the
Social and Behavioural Sciences. Wiley.
41.
SimmonsJ.P.NelsonL.D.SimonsohnU. (2011). False-positive psychology: Undisclosed
flexibility in data collection and analysis allows presenting anything as
significant. Psychological Science, 22, 1359-1366.
42.
VidgenB.YasseriT. (2016). P-values: Misunderstood and
misused. Frontiers in Physics, 4, 6
Supplementary Material
Please find the following supplemental material available below.
For Open Access articles published under a Creative Commons License, all supplemental material carries the same license as the article it is associated with.
For non-Open Access articles published, all supplemental material carries a non-exclusive license, and permission requests for re-use of supplemental material or any part of supplemental material shall be sent directly to the copyright owner as specified in the copyright notice associated with the article.