
Abstract
Introduction
The number of children with asthma has increased significantly in China. In recent years, there has been a steady increase in outpatient visits of children with asthma, attributed to poor air quality and environmental pollution reported regionally and at our institution. This study aimed to assess the association between air pollution and the number of outpatient visits of children with asthma in Xi’an, the largest city in northwest China.
Methods
We searched the database of the largest children’s hospital in Xi’an for related information from 2014 to 2018 and then acquired data on air pollution, including the daily average concentrations of fine particles (PM2.5), inhalable particles (PM10), nitrogen dioxide (NO2), and sulfur dioxide (SO2) of that same time period. Time-series generalized additive models were used to analyze the relationships.
Results
Our results revealed that air pollution was very serious in Xi’an, with elevated average concentrations of PM2.5, PM10, and NO2 from 2015 to 2018. The relative risk of outpatient visits due to asthma associated with PM2.5, PM10, and SO2 pollution rose significantly and reached 1.11 (1.02–1.21), 1.25 (1.01–1.55), and 1.71 (1.31–2.25), respectively, when there was a 10 ug·m-3 increase in concentration, during a lag of 21 d.
Conclusions
A high concentration of particulate matter (PM2.5 and PM10) was the prominent feature of air pollution in Xi’an. Exposure to air pollutant (PM2.5, PM10, SO2) was positively associated with an increased risk of children’s outpatient visits for asthma in Xi’an.
Introduction
Asthma is a leading form of airway disease worldwide. The prevalence of asthma is estimated to be 4% in Chinese adults, according to a national cross-sectional study from 2019. 1 Data published in 2013 showed a prevalence of 3% for asthma in children aged 0 to 14 y in China. The prevalence of pediatric asthma is increasing as China changes from a traditional agricultural society into an industrialized country with dense populations and the accompanying challenges of air pollution. 2 Reducing the incidence of asthma could help decrease pediatric mortality rates and bring about significant public health benefits. 3 Exposure to air pollution is recognized to increase the risk of developing asthma. That risk is even higher in children, who are more vulnerable to polluted air. 4 However, the evidence supporting an association between air pollution exposure and incident childhood asthma is inconsistent, and there is a lack of relevant Chinese data.
The problem of air pollution is very serious in Xi’an, the largest city in northwest China. The city has a resident population of over 10 million, according to the public data of the government. It lies in the middle of the Guan-zhong basin, which has a funnel-shaped topography that leads to serious accumulation of air pollutants. According to a report released by the Ministry of Ecology and Environment of China in 2016, Xi’an ranked 10th in severity of air pollution among 74 key monitoring cities.
The Affiliated Children’s Hospital of Xi’an Jiaotong University is a representative pediatric hospital in this city. It has 9 branch clinics throughout the city, with 2 of them also providing inpatient services in addition to the main medical center. The pediatric patient volume of the hospital was far ahead of others in Xi’an, and there were over 2.3 million outpatient visits at this hospital in 2018, according to the government work report of the Xi’an Health Bureau. In the winter of recent years, the air of Xi’an was seriously polluted, and doctors at this hospital have seen the number of outpatients with asthma rising dramatically. It was therefore hypothesized that there might be a relationship between these factors. The objective of this study was to determine the association between air pollution and outpatient visits of children with asthma in Xi’an from 2014 to 2018.
Methods
The study protocol for this research was accepted and approved by the ethics committee of the Affiliated Children’s Hospital of Xi’an Jiaotong University. Written informed consent was not necessary or required because aggregated data were used rather than individualized data. Patient information was anonymized before analysis.
We searched the database of the Affiliated Children’s Hospital of Xi’an Jiaotong University to obtain patient information, including age, sex, home and habitation, date of hospital visit, diagnosis, and the name of the physician who gave the diagnosis. Patients who met the following criteria were included: 1) <14 y of age; 2) residence was Xi’an; 3) the term “asthma” was in the first diagnosis; and 4) not a subsequent visit. Data reflecting the daily average concentrations of PM2.5, PM10, NO2, and SO2 from 2014 to 2018 were acquired from the Xi’an Ecology and Environment Bureau, which had 13 fixed-site monitoring stations in urban areas of Xi’an.
A generalized additive model with natural splines was constructed to link data by date and to analyze the associations between concentrations of each air pollutant and the number of outpatient visits for asthma at the hospital. The single-pollutant models were established to estimate the relative risk of outpatient visits for asthma associated with 10 ug·m-3 increase in air pollutant concentration. A lag analysis was conducted because the impact of air pollutants might be delayed. Lag structures from lag 0 d to lag 21 d were defined as lag 0 to lag 21. The time lag and cumulative time lag effects of major ambient pollutants were included in the model. Statistical analyses were conducted using R software version 3.6.0, and the “mgcv” package was introduced. Statistical significance in all analyses was defined as P<0.05.
Results
Distribution of Ambient Pollutants and Daily Outpatient Visits for Asthma
We found that the average concentrations of PM2.5, PM10, SO2, and NO2, were 69.4, 134.9, 23.6, and 50.7 ug·m-3, respectively, during the period of 2014 through 2017; this was 2.0-, 1.9-, 0.4-, and 1.2-fold greater than the annual secondary national ambient air quality standards issued by the Ministry of Ecology and Environment of China (GB3095-2012), as shown in Table 1. However, if we refer to the international guidelines issued by the World Health Organization in 2005, the measures would be 6.9-, 6.7-, 1.2-, and 1.3-fold greater, respectively. We understand the difference between the 2 guidelines, considering China is still a developing country with a large population and worrisome air quality. Generally, high concentrations of PM2.5 and PM10 were the particularly prominent feature of the pollution in Xi’an; the mean and the median concentration of both were very high. However, most days, the concentration of SO2 was below the national standard: Its mean concentration was below the national standard, and its median concentration was even lower. We also found that the concentration of NO2 was mildly high most days. On average, 48 children (age <14 y) with asthma as the first diagnosis visited our hospital every day during that time. There was no significant difference in sex (P>0.05). Patient age was 4.4±0.5 y.
Distribution of daily data on air pollutants in Xi’an and daily outpatient visits for asthma at targeted hospital, 2014 to 2017
P25; P75, percentiles.
Cases of Outpatient Visits for Asthma and Concentrations of Air Pollutant
Figure 1 shows the number of cases of outpatient visits FOR asthma in the hospital. The number of cases in 2014 was at a high point, and there was an increasing trend from 2015 to 2018, with the lowest number of cases occurring in 2015. Figure 2 shows the change in daily average concentrations of air pollutants (PM2.5, PM10, SO2, and NO2) from 2014 to 2018. The daily average concentration of each pollutant reached its annual peak in winter. The concentrations of PM2.5, PM10, and NO2 showed the same tendency during that period; a high point was in 2014, and a gradual increase occurred from 2015 to 2018, similar to the trend of cases of outpatient visits. We might posit positive associations between the concentrations of PM2.5, PM10, NO2, and the cases of outpatient visits. The concentration of SO2 tended to decline gradually from 2014 to 2018, implying that China had had some success in controlling SO2 pollution.
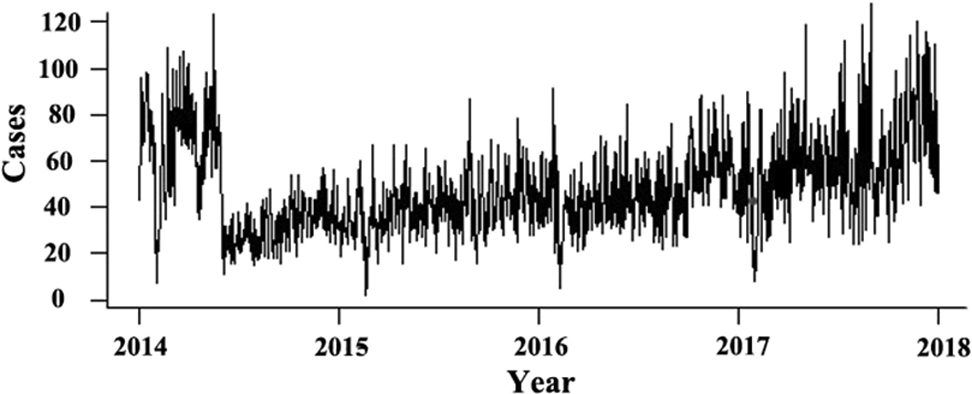
The number of outpatient visits for asthma from 2014 to 2018. The number showed a tendency to increase from 2015 to 2018, with a minimum value of 2 in 2015 and a maximum value of 128 in 2018.
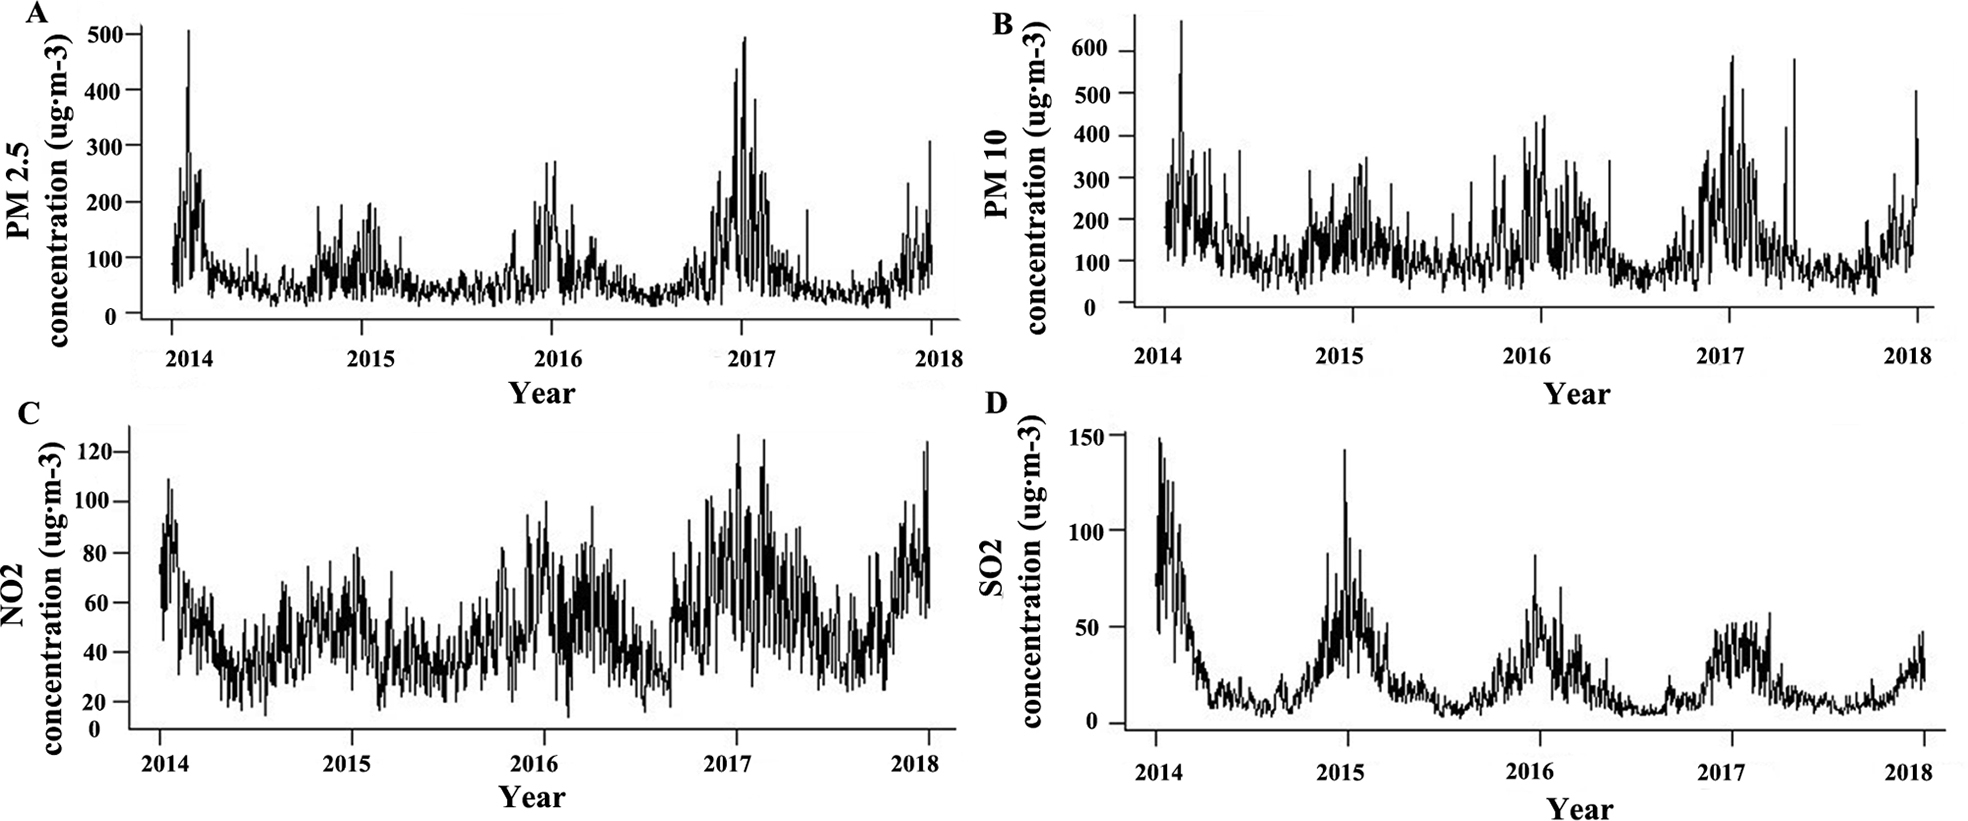
(A) The daily average concentrations of PM2.5 from 2014 to 2018, which tended to increase. (B, C, and D) The daily average concentrations of PM10, NO2, and SO2, respectively. (A, B, and C) The same increasing tendency. (D) A decreasing tendency.
Daily Average Concentration of Each Air Pollutant and The Relative Risk of Outpatient Visits for Asthma During Different Lags
Generally, we found that the relationship between air pollutant levels and outpatient visits was not linear. PM2.5 daily concentration and the relative risk for outpatient visits showed a lag effect of 9 d, as shown in Figure 3A. The relative risk was highest when the PM2.5 daily average concentration was the highest (506 ug·m-3). When the PM2.5 concentration was below 400 ug·m-3, the change in relative risk showed a calm wave during different lags. This indicates 400 ug·m-3 as a threshold that opened the lag effect. When the concentration of PM2.5 was above 400 ug·m-3, the relative risk increased markedly with the concentration increase before the best lag day.
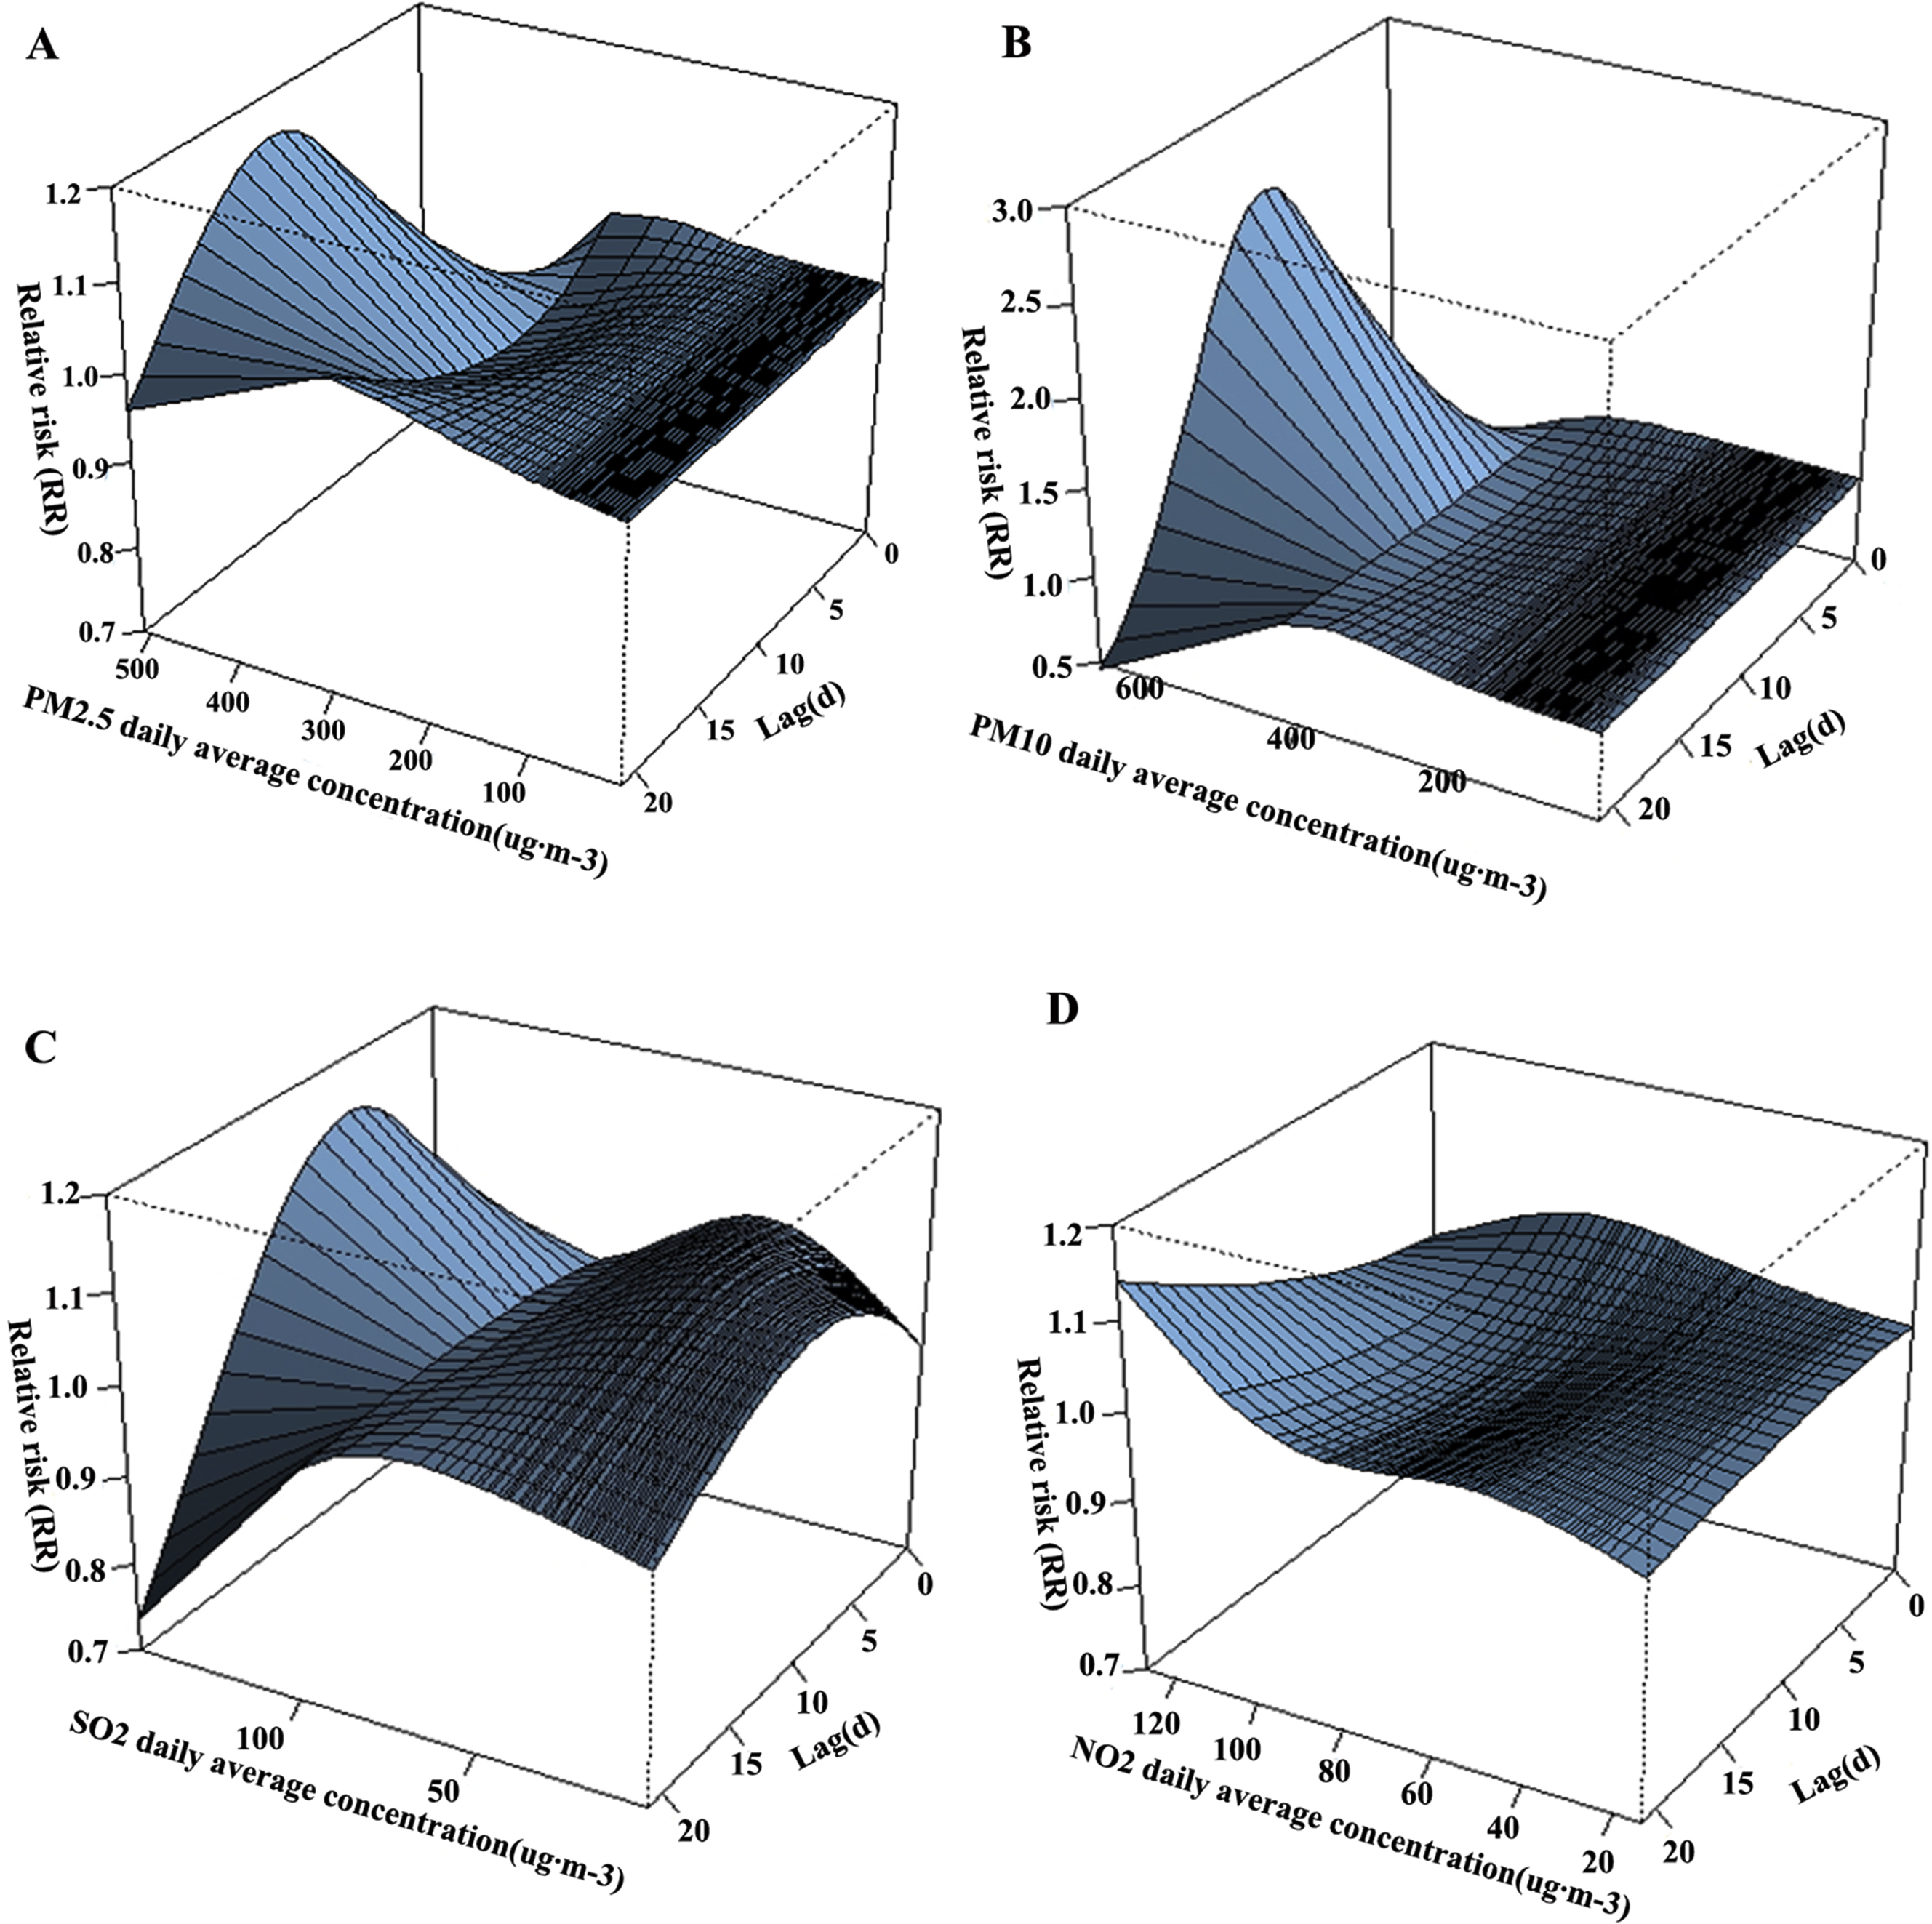
(A, B, C, and D) The relevance between the daily average concentration of air pollutant (PM2.5, PM10, SO2, NO2) and the relative risk of outpatient visits for asthma during different lags. (A and B) Many similarities are found, although (B) showed the biggest relative risk and the biggest difference in relative risk. (D) A flat curve of relative risks. (C) A significant change in relative risk when the daily average concentrations were not very high.
As shown in Figure 3B, which is similar to Figure 3A in some respects, we see that the relationship between PM10 concentration and the relative risk also showed a lag effect. The risk was highest when the concentration was highest (674 ug·m-3), and the lag effect here was 7 d. We also found a threshold here (estimated as 450 ug·m-3). When the PM10 concentration was below that threshold, the relative risk did not change much during different lags. When the concentration was above 450 ug·m-3, the risk increased markedly with the increase in concentration before the lag day. We also found that the difference of the relative risk between the maximum and the minimum appeared to be the greatest (among all pollutants).
The relationship between SO2 daily concentration and the relative risk seemed to be different from that of the particulate matter, as shown in Figure 3C. The relative risk was highest when the concentration was the highest recorded (148 ug·m-3), and the time lag here was 5 d (much shorter than we found in particulate matter). We did not find a typical threshold here as was found for particulate matter. We also found that the risk was above 1.0 when the concentration was low, indicating a sensitive relationship.
Figure 3D shows the relationship between SO2 daily concentration and the relative risk, which was highest when the concentration was highest (127 ug·m-3). We could not find a typical lag effect here within 21 d because there was inconsistency among different concentrations. Finally, the difference of the relative risk appeared to be the smallest among all pollutants.
Relative Risk of Outpatient Visits for Asthma During Different Lags
The relative risk of outpatient visits for asthma associated with PM2.5, PM10, and SO2 pollution rose significantly and reached 1.11 (1.02–1.21), 1.25 (1.01–1.55), and 1.71 (1.31–2.25), respectively, when there was a 10 ug·m-3 increase in concentration, during a lag of 21 d (Table 2). The risk associated with PM2.5, PM10, and SO2 changed in a similar way during different lags, with a continuous increase from lag 0 to 7 to lag 0 to 21. On the contrary, the risk associated with NO2 decreased from lag 0 to 7 to lag 0 to 21.
Relative risk of outpatient visits for asthma associated with 10 ug·m-3 increase in air pollutant concentration during different lag structures, 2014 to 2017 (P<0.05)
Data in parentheses are the lower and upper limits of the confidence interval at 95%.
Discussion
With urban development in China, we have observed an increase in the number of pediatric asthma cases, similar to that documented investigations in other countries. Although researchers have reported that reasons were linked to changing environmental factors, acting through gene–environmental interactions, the exact reason for this phenomenon is not yet fully described. 5
We identified a peak in outpatient visits of children with asthma at the hospital in 2014. Our data also showed that the air pollution in 2014 was very severe, with the concentration of major pollutants (PM2.5, PM10, and SO2) being highest during the period from 2014 through 2018. These two phenomena were likely related. Many studies have shown that exposure to air pollutants is consistently linked with poor asthma control in children, and studies have also shown reduced lung function and increased rates of rescue medication use and emergency department visits.6,7-10 Professionals have pointed out that there is a connection between pollutants and negative asthma outcomes. Ethnicity, socioeconomic status, and presence of certain gene polymorphisms affects susceptibility to the negative health effects of air pollution. 6 Scientists have also identified gene-environment interaction effects on childhood asthma and revealed that gene-environment interactions were important for asthma development. They also provided supportive evidence for interaction with air pollution for ADCY2, B4GALT5, and DLG2. 7
Our data reveal that air pollution in winter is very serious in Xi’an and that concentrations of PM2.5, PM10, and NO2 increased during the period from 2015 to 2018, whereas the concentration of SO2 continued to decrease. The annual average concentration of SO2 had even gone far below the national standard, confirming success in controlling SO2 emissions. We also found a high concentration of particulate matter (PM2.5 and PM10), which is the prominent feature of pollution in Xi’an. Air pollutants are generally separated into 2 main categories: particulate matter and gaseous pollutants (SO2, NO2, CO, and ozone). Researchers have pointed out that air pollution in China is complex, characterized by high PM2.5 and ozone concentrations. 11 Regardless of the lack of ozone data, our conclusions were consistent.
The Chinese national pollution census indicated that the domestic burning of solid fuels is an important contributor to NO2 and SO2 emissions in China. In particular, bulk coal, which usually contains high sulfide contents, could significantly increase the concentration of SO2 in the air when combusted during winter. 12 Coal consumption in China had declined since 2014 and bulk coal consumption had declined even more, according to the communique of the Chinese government in 2018. This explained why the concentration of SO2 declined continuously since 2014 and the SO2/NO2 pollution was better controlled.
Researchers found that PM2.5 pollution in wintertime was worsening, especially in northern China. They concluded that NO2 controls were more beneficial than SO2 controls for improvement of annual PM air quality. 11 Their finding was in agreement with what we found here, suggesting that China had great success in reducing SO2 emissions but needs to do more to deal with rising PM pollution.
Our result indicated that higher concentration of air pollutants (PM2.5, PM10, SO2) was positively associated with a higher rate of outpatient visits involving asthma in children. However, there were some differences. The association between particulate matter (PM2.5 and PM10) and risk showed both a threshold effect and an obvious time lag effect. We could estimate the timing of an eruption of pediatric outpatient visits for asthma during serious particulate matter pollution by considering the time lag patterns. For example, we suggest that there might be an eruption in outpatient visits for asthma in children in this city when the PM2.5 concentration exceeds 400 ug·m-3, and the eruption might come in 9 days. The priority is to keep the PM2.5 concentration at a low level, preferably below 400 ug·m-3, to avoid too many outpatient visits for asthma. For PM10 concentration, that level is better below 450 ug·m-3.
Researchers have reported a strong association between concentrations of PM2.5 and pediatric asthma hospital visits from 2009 through 2010 in Shanghai, China. Their paper revealed that the greatest relative risk of PM2.5 on pediatric asthma hospital visits was 1.06 (at a lag of 5 d), 1.07 (at a lag of 4 d), and 1.05 (at a lag of 2 d), for children <2 y old, 3 to 5 y old, and 6 to 18 y old, respectively. 13 It is our consensus that higher concentrations of PM2.5 have a positive effect on pediatric asthma hospital visits. Our data showed a lack of age stratification but included a longer period of time, and the average annual concentration and maximum concentration of PM2.5 in Xi’an were higher than those in Shanghai. Xi’an is a typical inland city, and its conditions of air pollution and industrial development are quite different from Shanghai, which is the most developed coastal city. This might explain why we obtained a higher risk and a longer lag.
Previous investigators reported that a 10-ug·m-3 increase in same-day PM2.5 concentrations was associated with emergency visits for asthma or wheeze (OR=1.013; 95% confidence interval 1.003–1.023) in children from 0 to 18 y of age. 8 Others reported that ambient PM2.5 had an adverse impact on emergency department visits for asthma after short-term exposure and that children were a high-risk population when PM2.5 concentrations were high. 9 Our result was in agreement with this finding.
We found that the relative risk of PM2.5 showed a longer lag effect to reach the peak compared to that of PM10. We also found a significantly bigger difference (2.01) between the maximum and minimum risk in PM10 compared to that of PM2.5 (0.31). Thus, we concluded that higher concentrations of PM10 might play a more important role in the association between airborne pollutant concentrations and outpatient visits for asthma.
Previous researchers reported risk ratios for asthma-related emergency department visits and hospital admissions for PM10 (relative risk [95% confidence interval] 1.010 [1.008–1.013]). 10 We agree that PM10 did have a positive effect. However, others reported that PM10 showed no significant association with asthma exacerbations. 14 There was no doubt that exposure to PM10 was associated with increases in respiratory disease,15,16 but there is still some controversy regarding the association of the risk ratio for asthma and exposure to PM10. We could not obtain sufficient evidence about this from precisely designed control experiments so far, and this controversy remains to be resolved.
Researchers have reported that acute exposure to PM2.5 can synergize with allergens in a subsequent challenge to exacerbate the severity of asthma in sensitized mice by promoting a Th2-biased immune response. 17 That helped us to understand some of the mechanisms potentially involved.
The association between gaseous pollutant (SO2, NO2) exposure and relative risk for asthma was different from that of the particulate matter, showing no threshold effect. Alternatively, there was a lag effect in the association for SO2. The time lag was 5 d, shorter than that of PM2.5 or PM10, according to our study. We also found that the relative risk for asthma with SO2 was above 1.0 when the concentration was low, indicating a sensitive relationship. We conclude that the risk for asthma is more sensitive to SO2 than particulate matter.
SO2 is a widely known, problematic inhalable air pollutant that can be a potential trigger factor for asthma exacerbation. Researchers reported that SO2 can promote airway responses in a concentration-dependent manner through its ability to induce local oxidative stress. Their paper suggested that individuals with asthma showed a greater sensitivity to SO2. 18 A cohort study reported that exposure to industrial air pollutant emissions was associated with childhood-onset asthma, except the distance to the nearest major emitter of SO2. 19 Some found the evidence for the role of SO2 exposure in asthma to be less consistent due to regional difference, based on data from North America. 20 Researchers in China found that childhood asthma was strongly linked with SO2 exposure. 21 Other researchers proposed that there was no significant association between SO2 exposure and asthma-related mortality. 22 SO2 was representative of industrial air pollution, and it posed many serious threats, such as acid rain and toxic fog. Most countries have paid good attention to the issue of SO2 pollution and tried to reduce SO2 emissions. The SO2 concentrations in the aforementioned literature, except for the cohort study, were all below the control concentration set by the environmental supervision department in that region. The impact of serious SO2 pollution was obvious, but when SO2 pollution was less serious, some impacts might become not so obvious or clear. Thus, we understand the differences among the papers.
We failed to find a clear association between NO2 exposure and the relative risk for asthma in children based on our results. The risk was 1.08 (1.00–1.16) at lag 0 to 2; it unexpectedly kept falling for longer lags. A possible explanation for this was that NO2 exposures increased hospital visits among asthmatic children over periods shorter than 2 d, and this effect then diminished and NO2 exposures became a protective factor. However, studies have shown that NO2 exposure elicits lipid peroxidation of the cell membranes and the generation of various free radicals and promotes the release of inflammatory mediators.10,14 One study revealed that the overall risk estimates showed a significant association between NO2 exposure and the risk of asthma development. 23 Another study mentioned that early-life exposure to NO₂ was positively associated with a subsequent childhood asthma diagnosis. 24 Thus, we thought that NO2 exposure could not be a protective factor, and our result here was a biased one. The probable reasons for this might lie in the limitations of this study.
There were some limitations in our study. Because of the incomplete data, we failed to make an adjustment of the relative risk according to temperature or humidity, which had a relationship with the onset of asthma. We also missed the important air pollutants ozone and carbon monoxide because of a lack of data. Moreover, the relative risks of each air pollutant on the number of outpatient visits were considered separately in our study. The probable interactions were ignored. Obviously, the actual situation might be different and much more complicated. In addition, our regional study means that the results might be less universal, and the probability of misdiagnosis in outpatients being higher than that among inpatients exists. We could not confirm the biological mechanisms of the impact of air pollutants on asthma in children.
Conclusions
Our data revealed that a high concentration of particulate matter (PM2.5 and PM10) was the prominent feature of air pollution in Xi’an. Exposure to air pollutants (PM2.5, PM10, SO2) was positively associated with an increased risk for outpatient visits for asthma among children in Xi’an. To reduce avoidable loss of life and the burden of asthma in children, we should focus on controlling the concentration of particulate matter in the air.
Footnotes
Acknowledgements
Acknowledgments: We are grateful for the guidance of the School of Statistics of our university and express sincere gratitude to Ross Ihaka and Robert Gentleman, who created the R software. We pay tribute to all the medical workers and epidemiological researchers who have brought hope to the world suffering from a serious epidemic.
Author Contributions: Research concept and design (JW); data collection (KG, RW); data analysis and first draft (YZ, ZW); critical revision (JW). All authors approved the final manuscript.
Financial/Material Support: This study was supported by Shaanxi Health Research Fund (No. 2018D006), Xi’an Health and Family Planning Commission Fund (No. J201902034), Shaanxi Natural Science Foundation (No. 2019JQ-434, 2020JM-606), and National Natural Science Foundation of China (No. 82000959).
Disclosures: None.
Yaozu Zhang and Zonghui Wu contributed equally to this paper.