
Abstract
Objective
The present study was conducted to assess the changes in mucosal immunity and pulmonary function among participants in a 36-hour mixed task ultraendurance race.
Methods
Thirteen of the 20 race participants volunteered for the investigation (age 34±5 y). The event consisted of a mixture of aerobic, strong man, and military-style exercise. Participants had a pulmonary function test and gave a finger stick capillary blood sample and unstimulated saliva samples both before the event and upon dropout or completion. The blood sample was analyzed for hematocrit, and the saliva sample was analyzed for salivary flow rate, salivary alpha amylase, salivary immunoglobulin A (IgA), and IgA type 1.
Results
Significant differences were noted among the finishers and those who dropped out in salivary flow rate (P = .026), salivary IgA (P = .017), and peak expiratory flow (P = .05) measurements. Salivary flow rate and IgA for the race finishers were reduced from pre- to postrace, whereas the nonfinishers showed no change or small increases. No significant differences emerged for other variables.
Conclusions
Based on the results of the present investigation, finishing a 36-hour mixed task ultra-endurance event results in a decline in both pulmonary function and mucosal immunity compared with competitors who do not finish.
Introduction
Ultraendurance events are races that last for >6 hours and up to several days. Participation in these events is growing, as is analysis of performance trends in those who finish these lengthy efforts.
1
–3 According to the International Association of Ultrarunners (
Past studies suggest that participation in ultraendurance events acutely reduces lung function. 5 ,8,9 These studies demonstrated decreases in maximum voluntary ventilation at 12-second9,10 and 30-second 8 maximum inspiratory/expiratory pressure 6 as well as peak expiratory flow and forced expiratory volume (FEV) 1.0. 11 Additionally, declines in hemoglobin, hematocrit, and red blood cells have been noted after the 100-km ultramarathon. 12 Based on these reported changes, it is likely that capacity for oxygen delivery is impaired after ultraendurance performance. However, these data are reported from only ultramarathon events, and thus more information needs to be gathered on additional forms of ultraendurance competitions.
The study of mucosal immunity in conjunction with exercise is a topic of current interest because recent advances have made measurement of antimicrobial peptides and immunoglobulins in saliva more available. One of the primary analytes of interest has been secretory immunoglobulin A (IgA), the primary immunoglobulin in saliva that functions as part of the body’s initial defense against invading microbes.13,14 This dimeric molecule is produced in plasma cells that lie adjacent to salivary glands, from which it is excreted in a saliva flow rate-dependent fashion. 15 Marathon and endurance performance have been shown to negatively affect salivary IgA. 16 –19 Although the response of salivary IgA is well characterized in regard to long-duration exercise, other important components of mucosal immunity, such as salivary alpha amylase, require further study. 20 Recent data from a multistage marathon demonstrated reductions in salivary IgA with concomitant increases in salivary alpha amylase. 21 Although some studies of secretory IgA (sIgA) and other mucosal immune markers have been conducted in conjunction with ultraendurance events, more work is needed to develop a comprehensive understanding of how the varied length and composition of different events affect these markers. It has been suggested that subclasses of IgA in saliva, particularly sIgA type 1, are related to risk of infection in athletes. 22 Subclasses of IgA in saliva have yet to be reported on in conjunction with ultraendurance events. Thus, sIgA type 1 was selected as a primary variable of interest for the present study along with standard measures of salivary IgA and alpha amylase.
The present study was undertaken on a novel ultraendurance race that was 36 hours in length and combined strength, endurance, and work capacity tasks. It was hypothesized that athletes who finished the event would demonstrate marked reduction in markers of mucosal immunity, lung function, and hematocrit whereas athletes who dropped out before finishing would have minimal to no change in similar measures.
Materials and Methods
Design and Study Populations
The present study was conducted during a 36-hour long endurance race. This race took place in the summer in the Midwestern United States. Participants were recruited on site before beginning the event. The experimental procedures were explained to all participants, and participants gave written informed consent before beginning the study. The study was reviewed and approved by the Institutional Review Board at the University of Louisiana at Lafayette. Data were collected in a repeated measures fashion at the start of the event and when the participant’s effort concluded (either finishing at 36 hours or due to dropout).
Participants
Of the 20 competitors who registered for the event, 13 volunteered (12 male competitors, 1 female competitor) to be included in the investigation. Participants’ weight and body fat percentage were determined via a Tanita body composition analyzer (Model BF522W; Tanita Corp, Arlington Heights, IL). The participants were asked to fill out the Leisure and Physical Activity Survey, an instrument developed in our lab to quickly assess physical activity patterns, before the event 23 and had tympanic temperature collected at the check-in between event tasks in a manner reported in a previous study. 6 On average, the participants reported 3 to 5 days, >30 minutes per session of both weightlifting and aerobic exercise. Details about the participants are in the Table. Seven participants completed the entire 36-hour event and 6 competitors dropped out or were cut from the event before 24 hours.
Participant characteristics.
n = 12 males; n = 1 female, given in mean±SD.
SD, standard deviation.
Ultraendurance Event
The event was held on a private, wooded, rural farm in late summer. Before the event, the contestants are blinded to the composition of the tasks that are to be completed, although they are required to bring some of the supplies, such as sand, buckets, and an ax. The tasks to be completed generally are grouped into the following categories: running, long-distance weighted carries, strong-man type activities (deadlifts, Olympic lifts, overhead throws, farmers walks), chopping and carrying wood, calisthenics, and military-style marches. Each task must be completed and observed by a race official before the next can be started. The participants are not allowed to sleep during the event, and rest time between tasks is limited to a few minutes. Participants are allowed ad libitum water and snacks. Participants routinely check in at the race starting point during the event, and competitors who did not make sufficient progress through the tasks were dropped from the event at the 24-hour mark.
Saliva Collection and Dermal Puncture
Samples were collected before the race and immediately upon returning to the check-in after dropping out during an event, being cut from the event at the 24-hour mark, or upon event completion. The samples were gathered using a SalivaBio Oral Swab (Salimetrics, State College, PA) placed under the tongue for 2 minutes with the chin tipped downward. Before each collection, the swab was weighed using a portable digital scale that was calibrated in the field, and the final weight of the swab was determined again after collection. The change in weight (grams) was divided by the collection time (120 seconds) to determine salivary flow rate for each sample. Upon collection, samples were frozen on dry ice for transport and stored at −35°C before analysis.
Dermal punctures performed in singlet at the fingertip were used to collect capillary blood before the event and again at dropout or completion. The blood was collected in a heparinized capillary tube and immediately centrifuged for 15 minutes in a microhematocrit centrifuge (Adams Micro-Hematocrit Centrifuge; Clay Adams, Parsippany, NJ). The centrifuged samples were read with a microhematocrit tube reader (Leica Biosystems, Richmond, VA).
Quantification of Salivary Biomarkers
Before analysis, saliva samples were thawed and centrifuged for 15 minutes and the supernatant collected for analysis. Salivary alpha amylase was quantified via a kinetic enzyme assay (Salimetrics) with a sample dilution factor of 1:200. A commercially available indirect competitive immunoassay (Salimetrics) was used to determine secretory IgA levels in saliva (1:5 dilution). Finally, a commercially produced enzyme-linked immunosorbent assay kit (Alpco Diagnostics, Salem, MA) was used to determine the level of secretory IgA type 1 (1:1000 dilution). Microplates were read on a kinetic microplate absorbance reader (BioTek Elx 808, Winooski, VT). Samples were analyzed in duplicate, and the average intraplate coefficient of variation was less than 5%. After quantification, concentrations were controlled for salivary flow rate.
Peak Flow and Forced Expiratory Volume
Peak expiratory flow (L/min) and FEV1 at 1 second were measured before the event and at dropout or completion using a MicroLife Peak Flow Meter (MicroLife USA, Clearwater, FL). The device meets the standard for accuracy of the American Thoracic Society and has previously been used in research studies assessing FEV1. 24
Statistical Analysis
Data were first analyzed for normal distribution via Shapiro Wilk analysis. Nonnormal data were log-transformed before analysis. Analysis of variance (ANOVA) was used to examine average tympanic temperature by group (finisher, dropout). Repeated measures ANOVAs were used to assess change by time (pre, post) and by group (finisher, dropout). Statistical significance was set a priori at α < .05. A statistical software package was used (JMP version 11.0 Pro; SAS Institute Inc., Cary, NC) with G*Power software to determine effect sizes. 25
Results
Analysis of Normality
Significant results of Shapiro Wilk tests (P = .044 and P = .049, respectively) for sIgA type 1 and alpha amylase expression rates revealed nonnormal distribution of these data. Therefore, these data were log transformed before further data analysis. All other measures were not found to deviate significantly from normal distribution (P > .05).
Finishers and Nonfinishers
Race finishers were those who completed all 36 hours of the ultraendurance race. The nonfinishers were those who dropped out or were cut before the completion of the event (1 dropped out at 24 hours; remaining dropouts occurred between 12 and 20 hours; mean ±SD 17±5.5 hours).
Tympanic Temperature
Results of ANOVA analysis (F1,11 = 0.458; P = .513) did not reveal an average difference in tympanic temperature across the race by group (finisher: 36.7±0.3°C; dropout: 36.8±0.2°C).
Hematocrit and Salivary Flow Rate
Repeated measures ANOVA examining prerace to postrace changes in hematocrit among finishers and nonfinishers did not reveal significant main effects for time (F1,11 = 0.219; P = .651) or interaction effects for group (F1,11 = 0.027; P = .873). Mean prerace and postrace hematocrit levels were similar among finishers (pre: 45.3, post: 44.5) and nonfinishers (pre: 44, post: 43.6). Similar analysis for salivary flow rate again did not reveal a main effect for time (F1,11 = 0.389; P = .545); however, a significant interaction was noted for group by time (F1,11 = 6.579; P = .026). Post hoc analysis revealed a significant increase in salivary flow rate among nonfinishers (t = 2.18; P = .04; effect size [ES] = 0.889) but not among finishers (t = −1.43; P = .101; ES = .538), although a trend for reduced flow rate was noted (see Figure 1).
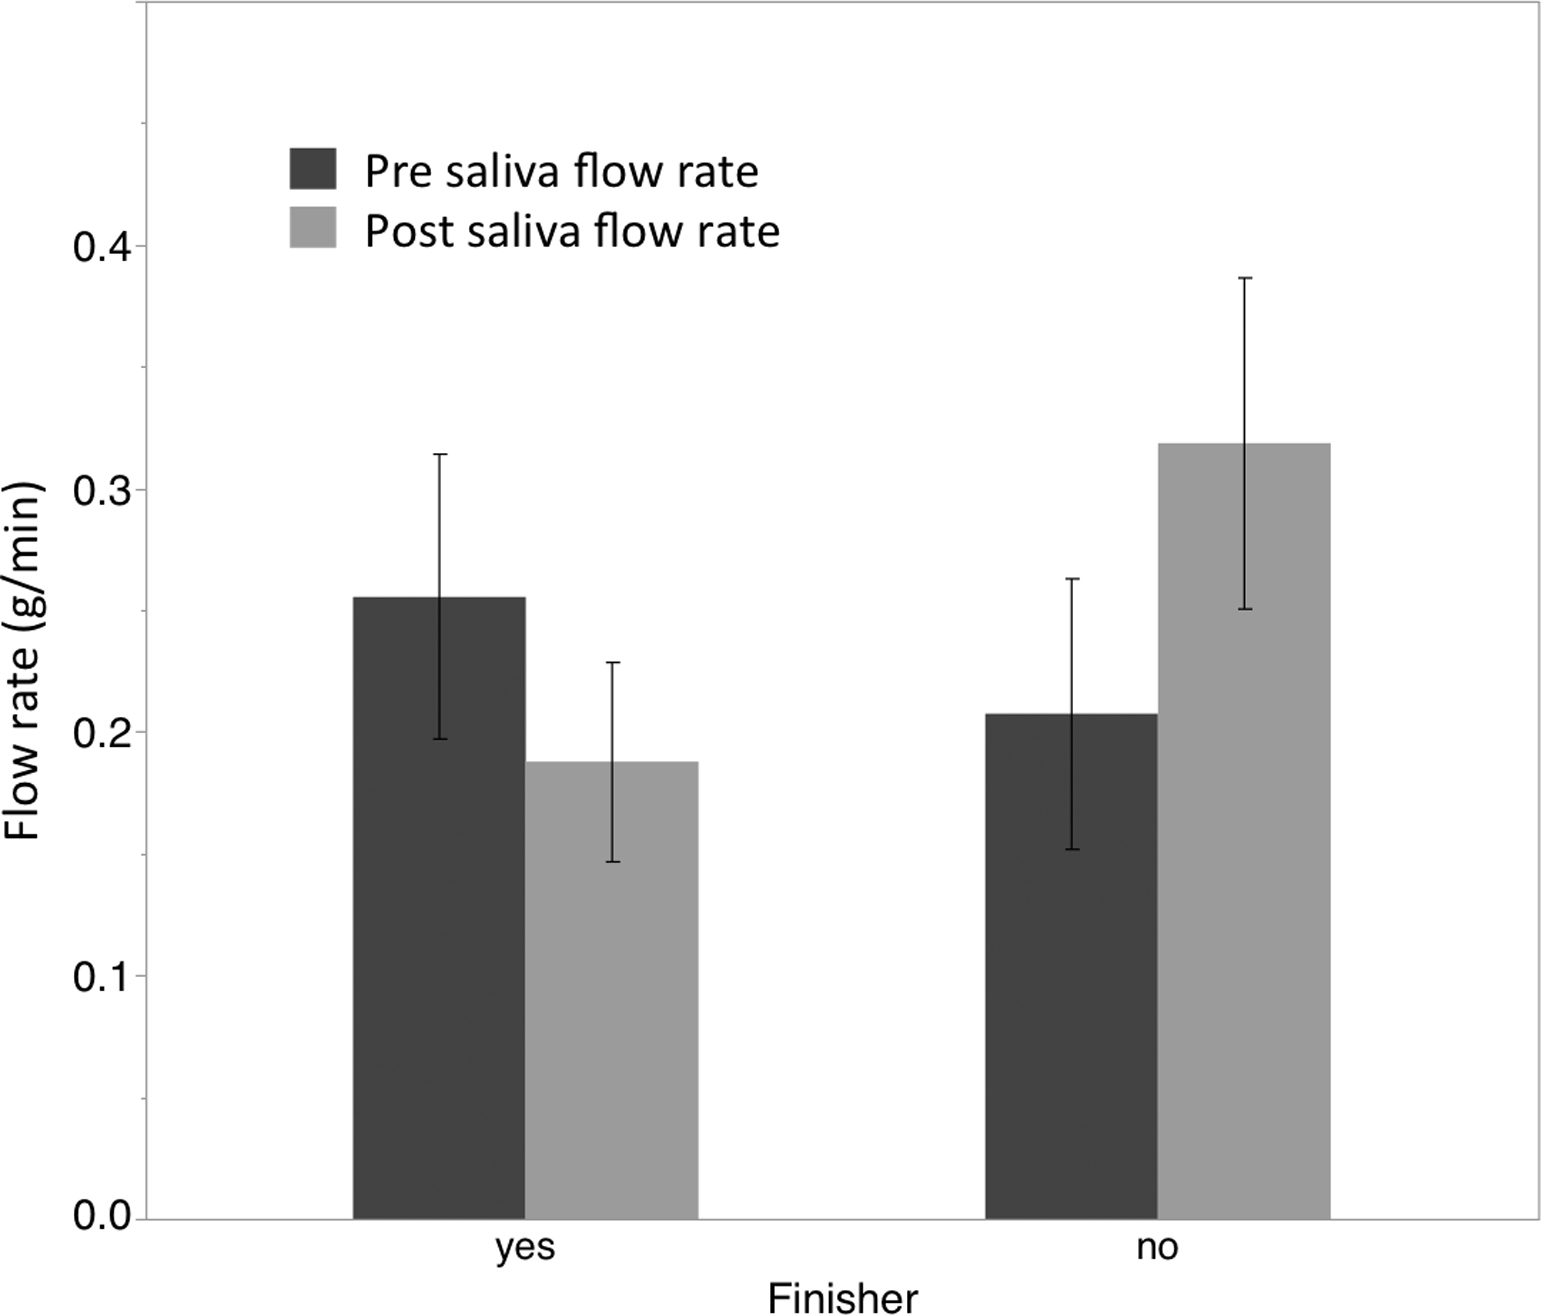
Graph showing changes in salivary flow rate pre- and post-ultraendurance race. (*) denotes significant difference (P <.05) from pre to post among group. Error bars represent ±1 standard error of the mean (SEM).
Secretory Ig A and Ig A Type 1
Concentration values for both sIgA and sIgA type 1 were first divided by salivary flow rate to determine expression rates for the immunoglobulins. Following this calculation, repeated measures ANOVA for sIgA expression rate did not reveal a main effect for time (F1,11 = 0.23; P = .642) but did reveal a significant interaction effect for group by time (F1,11 = 7.92; P = .017). Post hoc analysis demonstrated a significant reduction in expression rate among finishers of the 36-hour event (t = −1.90; P = .05; ES = 0.717) and a significant increase in expression rate among those who dropped out or were stopped before 24 hours (t = 2.03; P = .04; ES = 0.830). (Figure 2.)
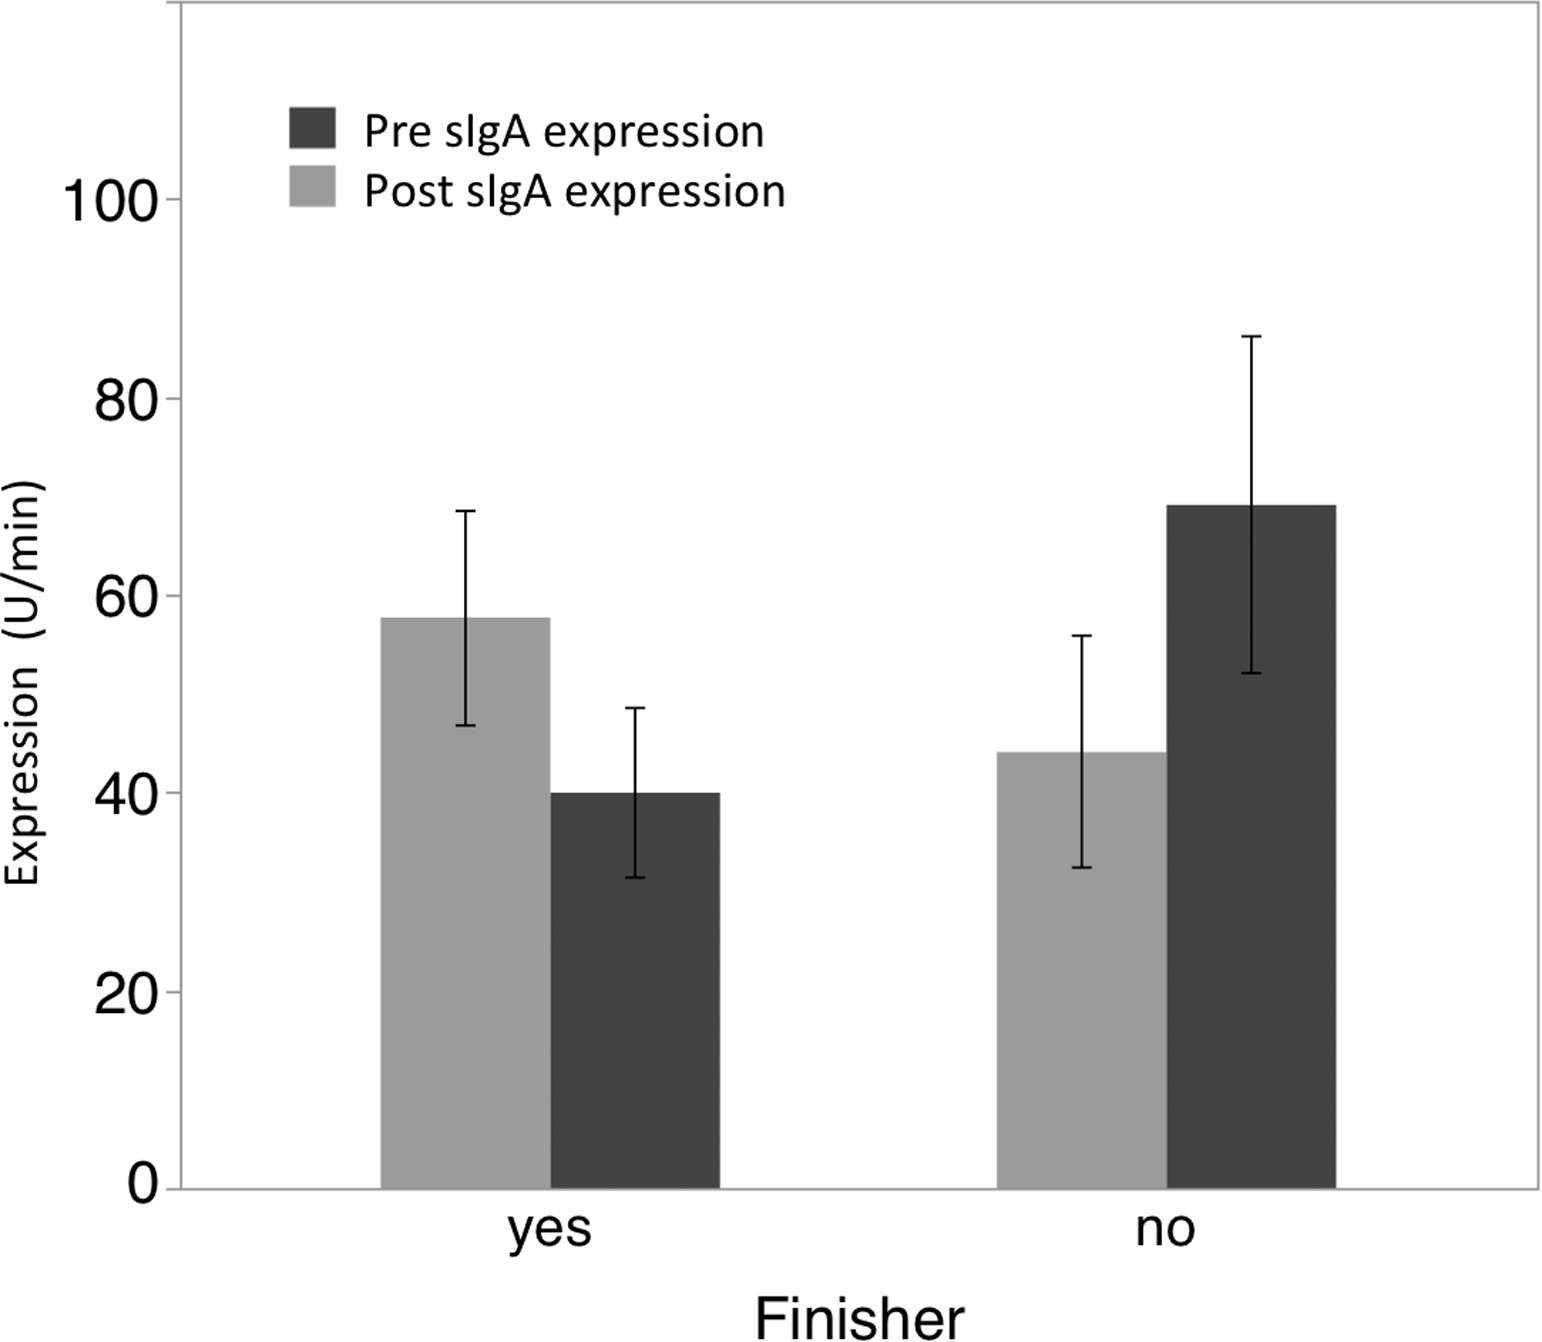
Graph showing changes in salivary IgA expression rate (µg/min) pre- and post-ultraendurance race. Error bars represent ±1 SEM.
Repeated measures ANOVA for sIgA type 1 expression rate did not reveal a significant main effect for time (F1,11 = 0.49; P = .500) or a significant interaction effect for time by group (F1,11 = 1.33; P = .273). A significant trend in the data was not noted among the finishers for a reduction in sIgA type 1 expression rate (t = −1.07; P = .164; ES = 0.402; see Figure 3).
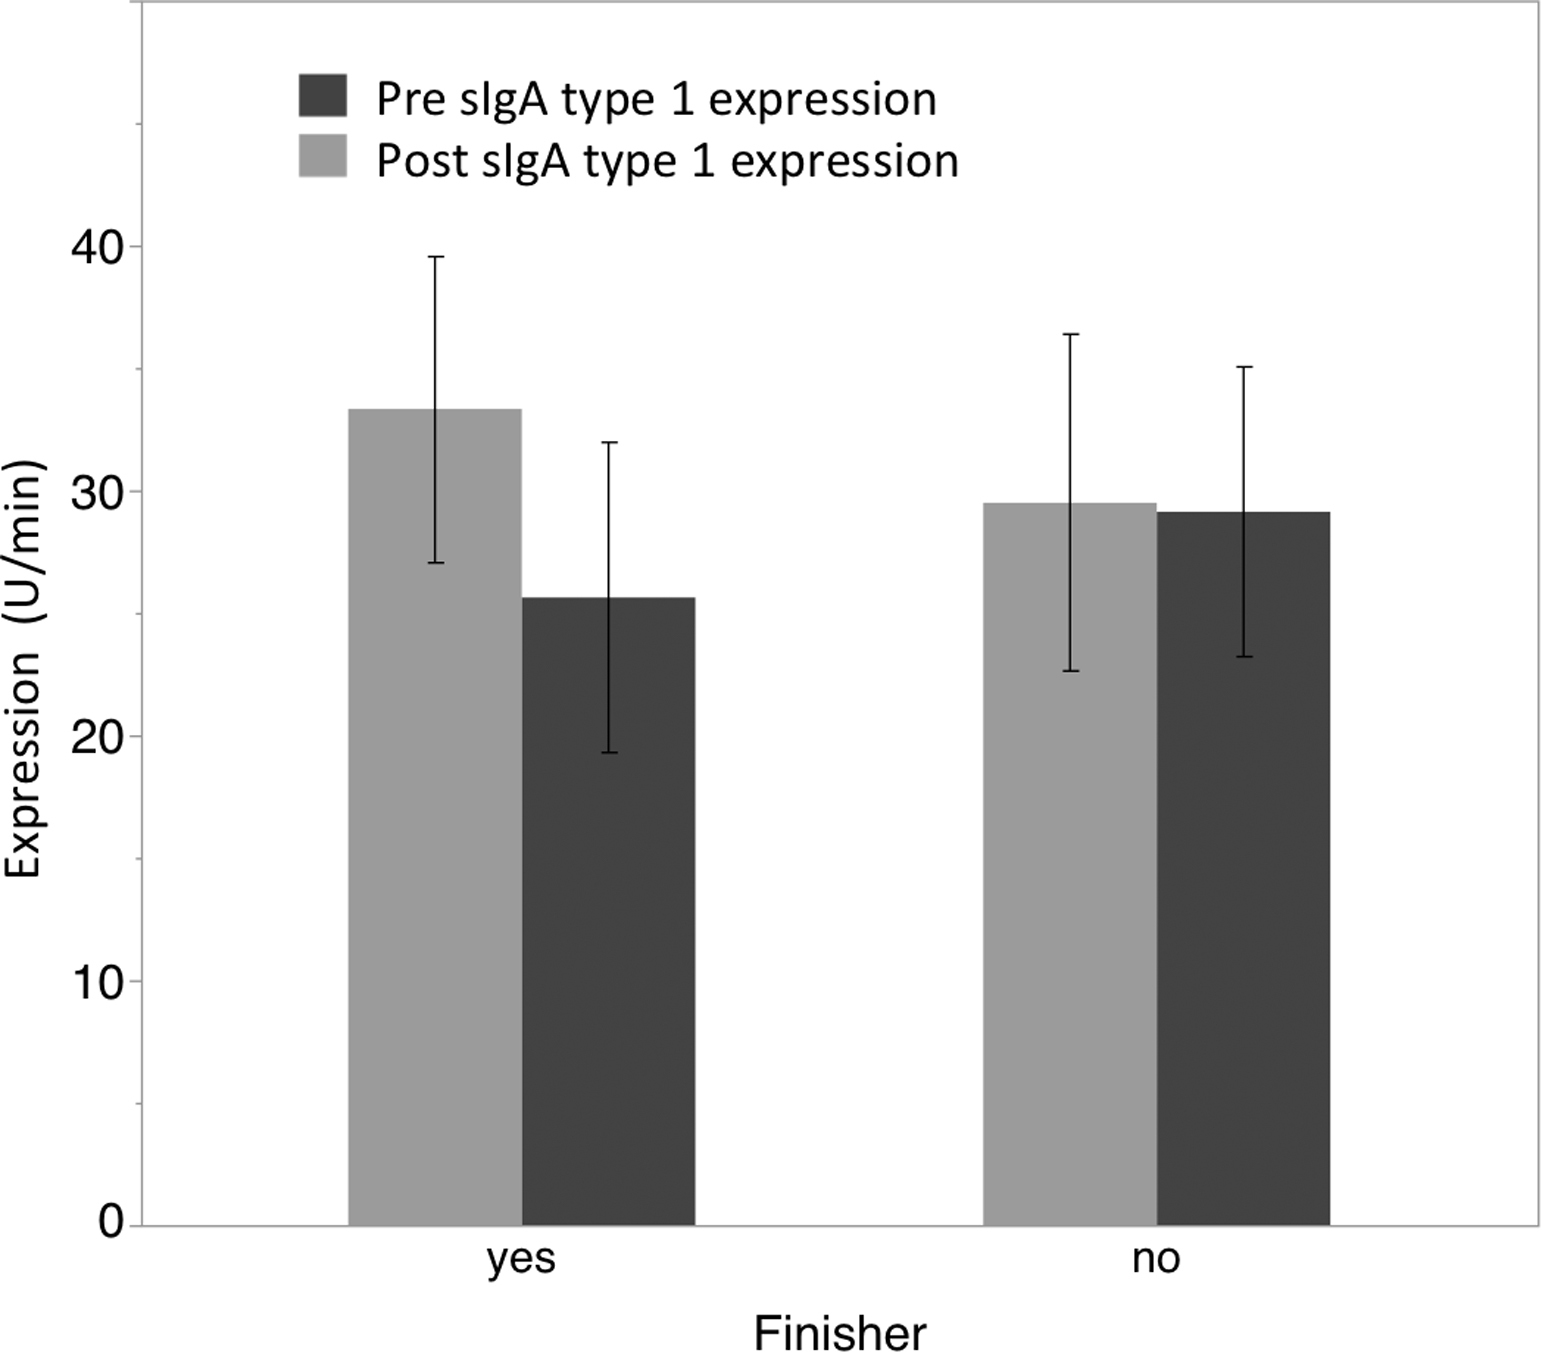
Graph showing changes in salivary IgA type 1 expression rate (µg/min) pre- and post-ultraendurance race. Error bars represent ±1 SEM.
Salivary Alpha Amylase
Repeated measures ANOVA did not reveal a significant main effect for time (F1,11 = 0.17; P = .692) when examining salivary alpha amylase expression nor a significant interaction effect for time by group (F1,11 = 0.266; P = .619).
Pulmonary Tests
Repeated measures ANOVA for peak flow did not reveal a significant main effect for time (F1,11 = 0.01; P = .946) but did demonstrate a significant interaction effect for finishers vs nonfinishers by time (F1,11 = 4.55; P = .05). Post hoc analysis demonstrated trends in the data for reductions (see Figure 4) in peak flow rate among finishers (t = −1.52; P = .09; ES = 0.533) and increases in peak flow rate among nonfinishers (t = 1.49; P = .09; ES = 0.611).
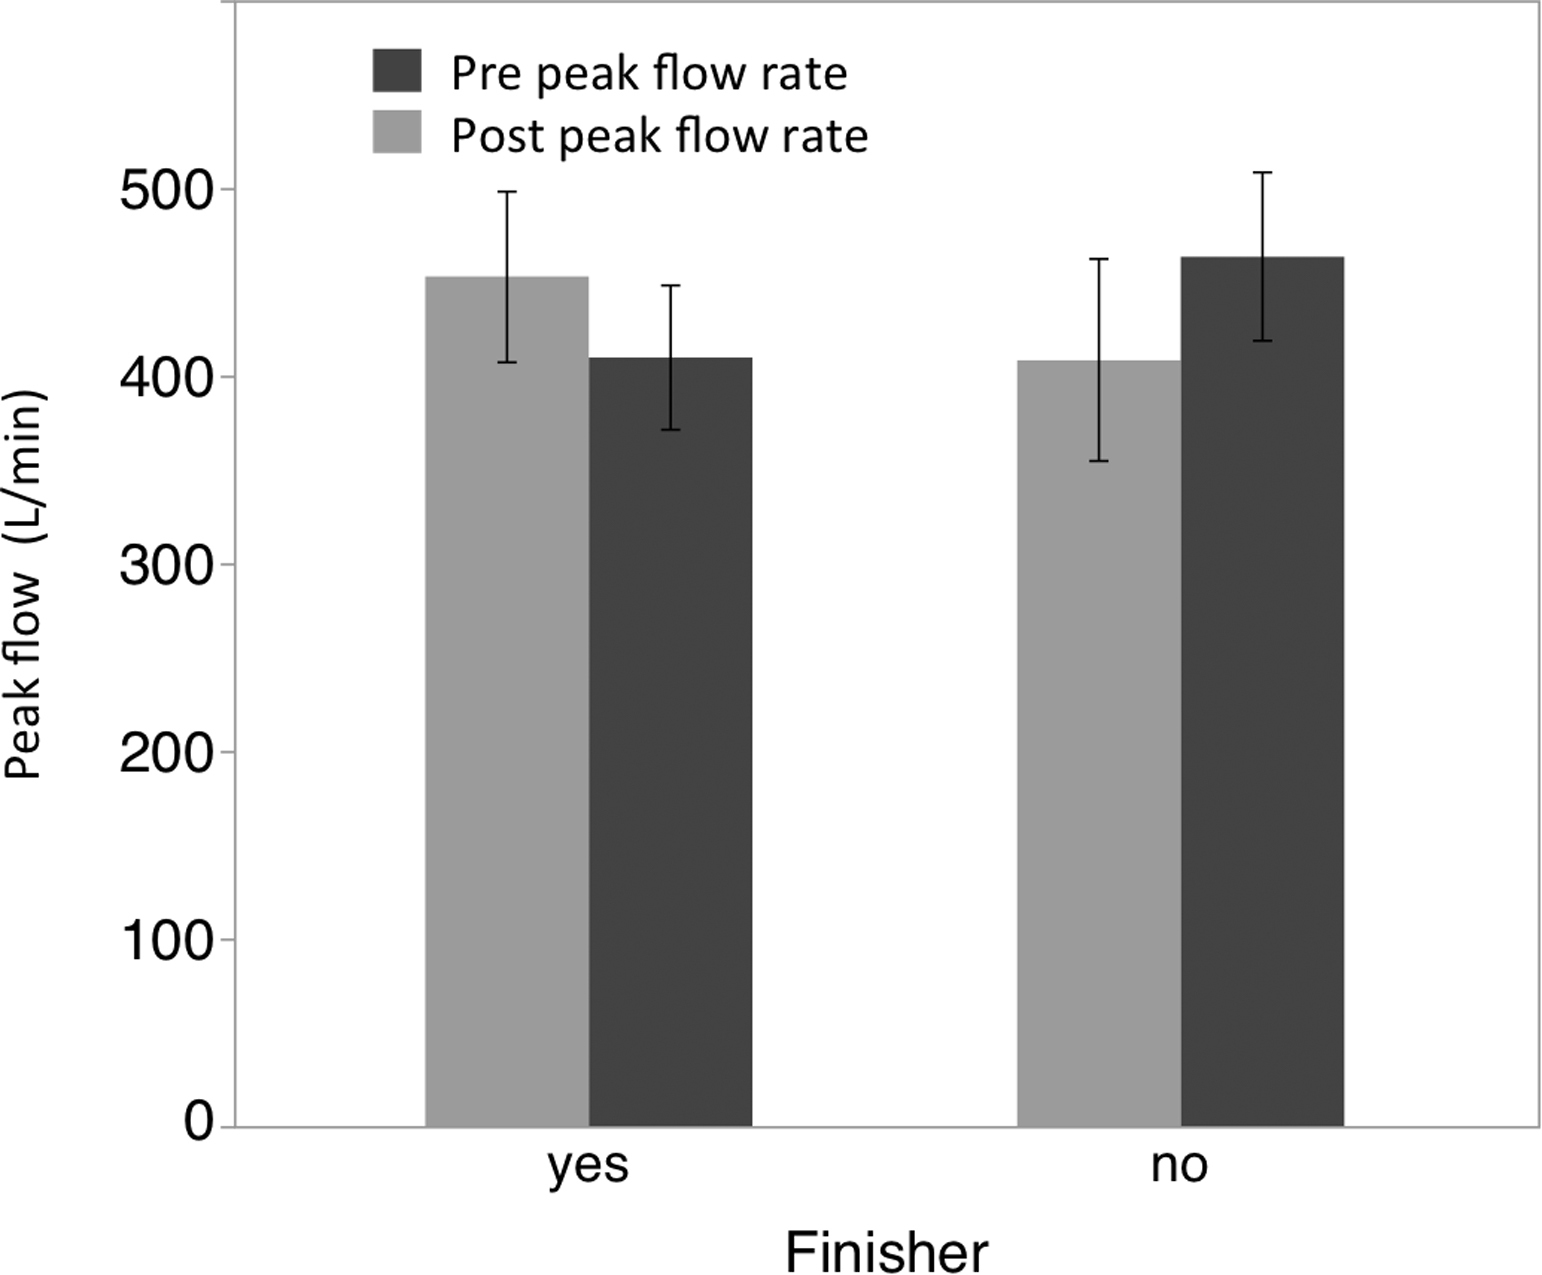
Graph showing changes in peak flow measurements (L/min) pre- and post-ultraendurance race. Error bars represent ±1 one SEM.
Analysis of FEV1 data did not reveal any significant main effects for time (F1,11 = 1.21; P = .298) or interaction effects for finisher vs nonfinisher by time (F1,11 = 1.80; P = .209).
Discussion
The present investigation extends the understanding of the effects of long-duration, ultraendurance type exercise on mucosal immunity and pulmonary function. What is unique about the present article is the examination of an event that requires 2 overnight periods of exercise without sleep. Furthermore, this study reports the differential responses among those athletes who completed all 36 hours of activity and those who did not make it past the 24-hour mark. Previous work examined the effects of 30 hours without sleep on the salivary IgA response to an acute bout of exercise. 26 These authors did not report any changes in sIgA due to sleep deprivation alone in a crossover design. 25 In the nonfinishers group for the present study, only 1 night of sleep deprivation was completed, which may in part explain why this group did not show a decline in sIgA. The significant decreases in total sIgA expression rate that were observed among the finishers of the race were consistent with previous findings for a 24-hour ultramarathon. 21 It should be noted that recent work by Hucklebridge et al 27 demonstrated a diurnal variation in sIgA in a small cohort of men. However, the acrophase (highest peak) was determined to be the morning, whereas our results suggest depressed levels of expression (race concluded at 07:00). Therefore, if a diurnal variation with higher levels in the morning is indeed present, the results from the present study may represent a robust finding of a decrease in secretion concomitant with an acrophase.
Additionally, Gill et al 21 reported reduced salivary flow rates similar to those observed among the finishers of the present investigation; however, the authors also reported a significant increase in salivary alpha amylase activity, which was not found in the present study. The present study extends the knowledge surrounding salivary IgA and ultraendurance events to include events based upon both sleep deprivation and varied forms of exercise. Work needs to continue in these areas, as recent reviews by Orysiak et al 28 on sIgA and upper respiratory tract infection and by Walsh et al 29 on exercise and immune function suggest that reductions in IgA are associated with increased risk of upper respiratory tract infection.
While most studies in the literature have focused on the dimeric molecule salivary IgA, in the present study an additional immunoglobulin secretory IgA type 1 was assessed. Although no significant differences were revealed for this immunoglobulin, further work should be conducted in this area as this form of exercise might negatively affect the expression of this molecule. Further work will need to be conducted in this area, as secretory IgA type 1 was found to be important 22 and associated with reduced upper respiratory tract infection in a group of athletes.
Additionally, peak expiratory flow, FEV1, and salivary flow rate were examined pre- and postevent in the present study. The results of the study suggest a decline in peak expiratory flow among the completers of the 36-hour event. Ross et al 30 reported similar declines in peak expiratory flow immediately after marathon running. However, pulmonary function was slightly improved among the nonfinishers. This may be due to the initial effects of exercise on the competitors before the onset of fatigue. It has been shown that warm-up exercise is effective at improving respiratory function in athletes, 31 so it could be speculated that completing the initial stages of the event may have provided benefit similar to a warm-up, but not enough stress to induce respiratory fatigue. Further research will be required to clarify the difference in the data from the nonfinishers. Additionally, salivary flow rate was not significantly reduced in finishers, but was significantly increased in nonfinishers. Although nonsignificant, the mean secretion rate was lower in the finishers at the conclusion of the race, similar to other reports in the literature. 21 The increase in the nonfinishers is intriguing and again will require more research to understand.
Limitations
Although the present investigation provides unique information from a type of ultraendurance event that is not well represented in the literature, there are limitations. First, even though these races are increasing in popularity, the field size is still significantly smaller than an average marathon. Therefore, although the majority of the race participants agreed to be part of the study, the overall study population was small. Second, because of the event course and race design, the participants could not be observed for some periods. Due to these limitations, hematocrit could only be assessed in singlet. It also was not possible to determine the fluid and nutrient intake of the participants. However, based upon the effect sizes of the findings, the authors are confident that the data are representative of physiological differences among the participants. 23
Conclusions
The present study suggests that ultraendurance races differentially affect markers of mucosal immunity and pulmonary function (as measured by peak flow) of finishers as compared with those who retire before the end of the race. Additionally, in the particular ultraendurance event studied, finishing the race resulted in declines in immune defense in the oral cavity, pulmonary function, and salivary flow rate. Ultraendurance athletes should be aware of these consequences and take steps to minimize their exposure to sources of upper respiratory tract infections in the hours after the race.
Acknowledgment: The authors would like to acknowledge and thank Gut Check Fitness, in particular Joe and Nicole Decker, for providing an opportunity for this study to be conducted.
Author Contributions: Study concept and design (DB, GRD, TP); acquisition of the data (DB, KAM, RA, TP); analysis of the data (DB, KAM, RA, GRD, TP); drafting of the manuscript (DB, RA, GRD); critical revision of the manuscript (DB, RA, GRD); and approval of final manuscript (DB, RA, GRD).
Financial/Material Support: None.
Disclosures Statement: None.
Footnotes
☆
Partial results presented at the 2014 ACSM National Conference, May 27–31, 2014, Orlando, FL.
Submitted for publication May 2016.
Accepted for publication December 2016.