
Abstract
The increasing interest in studying the interactions between cells and the extracellular matrix (ECM) has created a need for high throughput low-cost three-dimensional (3D) culture systems. The recent development of tubeless microfluidics via passive pumping provides a high throughput microchannel culture platform compatible with existing high throughput infrastructures (e.g., automated liquid handlers). Here, we build on a previously reported high throughput two-dimensional system to create a robust automated system for 3D culture. Operational controls including temperature and sample handling have been characterized and automated. Human mammary fibroblasts (HMFs) suspended in type I collagen are loaded and cultured in microchannel arrays and used to optimize the system operational parameters. A Peltier cooler maintains the collagen as a liquid at 4 °C during cell seeding, followed by polymerization at 37 °C. Optimization of this platform is discussed (e.g., controlling collagen contraction, increasing cell viability, preventing the removal of microchannel contents), and 3D distribution of HMFs is examined by fluorescent microscopy.
Finally, we validate the platform by automating a previously developed 3D breast carcinoma coculture assay. The platform allows more efficient 3D culture experiments and lays the foundation for high throughput studies of cell—ECM interactions.
Introduction
With recent advances in three-dimensional (3D) in vitro models, it is now widely accepted that the extracellular matrix (ECM) is one of the key regulators in various biological processes, including cancer progression 1 –4 and stem cell differentiation. 5 Although cells can be maintained and grown using traditional flat, two-dimensional (2D) plastic substrates, studies have shown that cells grown in 3D conditions differ considerably in their morphology and differentiation, 6 focal adhesion sites, 7 gene expression profiles at the RNA level, 8 and regulation of intracellular signaling 9 compared to cells grown in 2D conditions. The differences between 2D and 3D cell culture models highlight the fact that 3D cell culture models mimic in vivo conditions better than 2D models and provide enhanced interactions with neighboring cells and ECM proteins. 10,11 These results have created a need for higher throughput systems capable of screening the physical, chemical, and biological properties of the 3D cellular microenvironment. However, adapting cell-based assays to high throughput screening applications present challenges, such as cell plating conditions, incubation times, compound addition parameters, and assay end point considerations that affect the quality of the final output. 12 As a result, microfabricated arrayed systems (e.g., cellular microarrays, microfluidic valved arrays, and tubeless microfluidic channel arrays) have been developed in attempts to provide a more reproducible and controllable high throughput screening. 13 –15
Cellular microarrays create spatially distributed cell-containing spots that are deposited on flat surfaces by robotic spotters to perform high throughput analysis of cell–matrix and cell–cell interactions or toxicity screenings. Robotic spotting techniques possess the advantages of reducing the amount of materials needed for screening applications, providing a high degree of sample parallelization and facilitating the study of the material's influence on cellular behavior. For example, Flaim et al. 16 patterned various ECM compositions on polyacrylamide-coated glass slides with a robotic spotter and placed cells on top of the spotted ECM proteins to examine the influence of the ECM composition on embryonic stem cell differentiation. This method has also been used to select biopolymers that induce a specific response in cells 17,18 and to examine the combinatorial effect that different growth factors have on cell growth and differentiation. 19 Although cellular microarrays show promise for various screening applications, robotic spotting techniques have limitations, such as the generation of satellite spots, inhomogeneous spots, misplaced or absent spots, and carryover of samples. 20 Khetani and Bhatia 21 used elastomeric stencils to culture human liver cells on micropatterns of type I collagen, which overcame the previous limitation of patterning the surface of substrates using spotting techniques. Additionally, Lee et al. 22 spotted type I collagen or alginate-gels containing cells on a functionalized glass surface, which allowed culturing cells embedded in 3D instead of on top of ECM proteins. However, because the entire patterned substrate is exposed to the same culture media, only one type of soluble stimuli can be applied at a time. Therefore, in cellular arrays, individual treatment of each spot is difficult and potential cross talk between different spots can complicate interpretation of results.
Microfluidic valved arrays provide a different way of increasing the number of experimental conditions by allowing the incorporation of multiple fluids and cell types. In brief, microfluidic valved arrays typically consist of three different components (i.e., fluid channels [bottom], membrane valve [middle], and air channel [top]), in which the membrane valve deflects under air pressure applied through the air channel to control the opening of the fluid channel. The enclosed channel design enables the delivery of different soluble stimuli and limits cross talk among different conditions in the system. For example, eight different soluble factors were incorporated in an 8-by-8 microfluidic array to examine the soluble factor effect in gene expression patterns of living cells 23 and to deliver two different cell types into designated chambers of a 6-by-6 microarray. 24 Moreover, microfluidic valved arrays are compatible with both 2D and 3D cell cultures to mimic in vivo-like environments. 25,26 However, 3D cell culture is more difficult as the matrix can clog the network. Additionally, the need for complex connectors and pumps limits their adoption and widespread use.
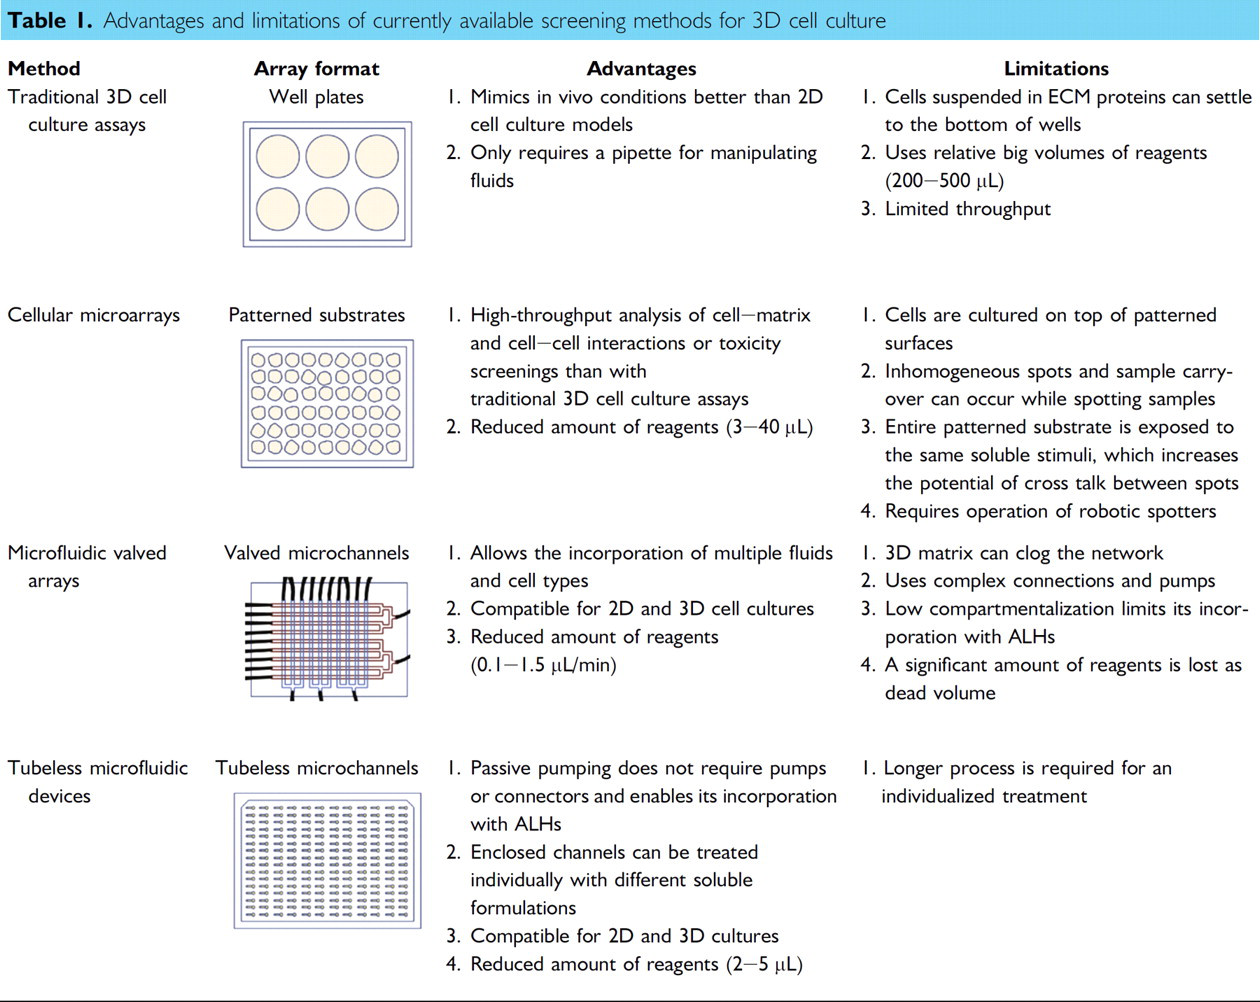
Tubeless microfluidic channel arrays, operated by passive pumping, 27 offer an alternative method of culturing cells that alleviates the limitations found in cellular microarrays and microfluidic valved arrays, while facilitating the individualized treatment of microchannels with multiple soluble formulations. 28 Table 1 summarizes the functional advantages and limitations of traditional 3D cell culture methods, microfabricated arrayed systems, and tubeless microfluidic devices. Although tubeless microfluidic devices offer several important advantages for the screening of 3D cell cultures, one limitation is the relative separate loading process required for each micro-channel. However, the loading process and all liquid exchanges are easily automated via existing liquid handlers addressing the arrayed microchannels. Samples are loaded into microchannels via surface tension-driven pumping called “passive pumping.” 27 The difference in surface tension created by placing different-sized droplets on inlet and outlet ports results in an internal pressure differential, causing the fluid to be pumped from small drop (inlet) to the large drop (outlet). Therefore, the process only requires the use of a pipette to touch off drops on the ports' surfaces and eliminates the need for external connectors, pumps, or power amplifiers, enabling their incorporation into automated liquid handlers (ALHs). 29 Recently, a 192-polydimethylsiloxane (PDMS) microchannel array (MCA) and a single-pipette ALH were operated for 2D cellular assays and tested for loading robustness, cell seeding consistency, and staining quality. Each channel was addressed for 35 operations (dispensing and aspirating) for a typical cell-based assay, and a success rate higher than 99% was found more than 30,000 times. 30 The system is compatible with 3D cell culture by passive pumping the cell–ECM mixture. 31,32 However, automating 3D cell culture requires additional operational controls, such as temperature and sample handling. 30
Advantages and limitations of currently available screening methods for 3D cell culture
In this work, we report the development of a robust automated microchannel platform for 3D cell culture. Type I collagen is the major ECM protein component in connective tissues, and, accordingly, it was selected to support the 3D growth of cells. Human mammary fibroblasts (HMFs) are used for initial validation because of their susceptibility to the physical properties of type I collagen, such as fiber diameter, alignment, and stiffness. 33 HMFs are initially suspended in type I collagen (1.3 mg/mL) and loaded with the automated platform into a 192-MCA. A Peltier cooler/heater maintains the 192-MCA at low temperature to keep type I collagen as a liquid during the loading process. The collagen in the MCA is then polymerized at 37 °C after the loading is complete. The platform is optimized to control collagen contraction, cell settlement, and prevent the removal of microchannel contents during washing. Moreover, the 3D distribution of cells was examined by fluorescent microscopy, and their distribution along the microchannel length was quantified. Finally, we biologically validate the platform by automating a previously developed 3D breast carcinoma microfluidic coculture model. 34 Breast carcinoma cell growth was analyzed after loading microchannels using the automated platform, and similar results to those previously reported were obtained. Thus, the platform discussed in this article lays the foundation for future 3D cell screenings that can be used to study the interactions between cells and the ECM under specific conditions in a cost-effective way.
Materials and Methods
Tubeless Microfluidic Device Fabrication
Tubeless microfluidic devices composed of an array of 192 microchannels were fabricated using soft lithographic techniques. Two layers of SU-8 100 (MicroChem, Newton, MA) were individually spun on a 6-in. silicon wafer and developed to create molded masters. The MCA layout was designed to conform to the dimensions of a standard 384-well plate. PDMS (Sylgard 184 Silicon Elastomer Kit; Dow Corning Corporation, Midland, MI) was poured on top of the molded silicon wafer master, sandwiched between two transparency films under weight, and cured at 80 °C for 4 h. The resulting MCA was then removed from the master mold, washed in 70% ethanol for sterilization purposes, and air dried. After sterilization, the MCA was mounted on a culture-treated polystyrene omnitray (Nunc, Rochester, NY). The PDMS MCA has overall dimensions of 111.0-mm long and 72.0-mm wide with a space of 4.5 mm between each microchannel port (Fig. 1A). Each microchannel (0.75-mm wide, 0.25-mm high, and 4.5-mm long) has two ports (0.75-mm input, 1.5-mm output). The larger output port helped to maintain the larger radius of curvature for passive pumping (Fig. 1B and C).
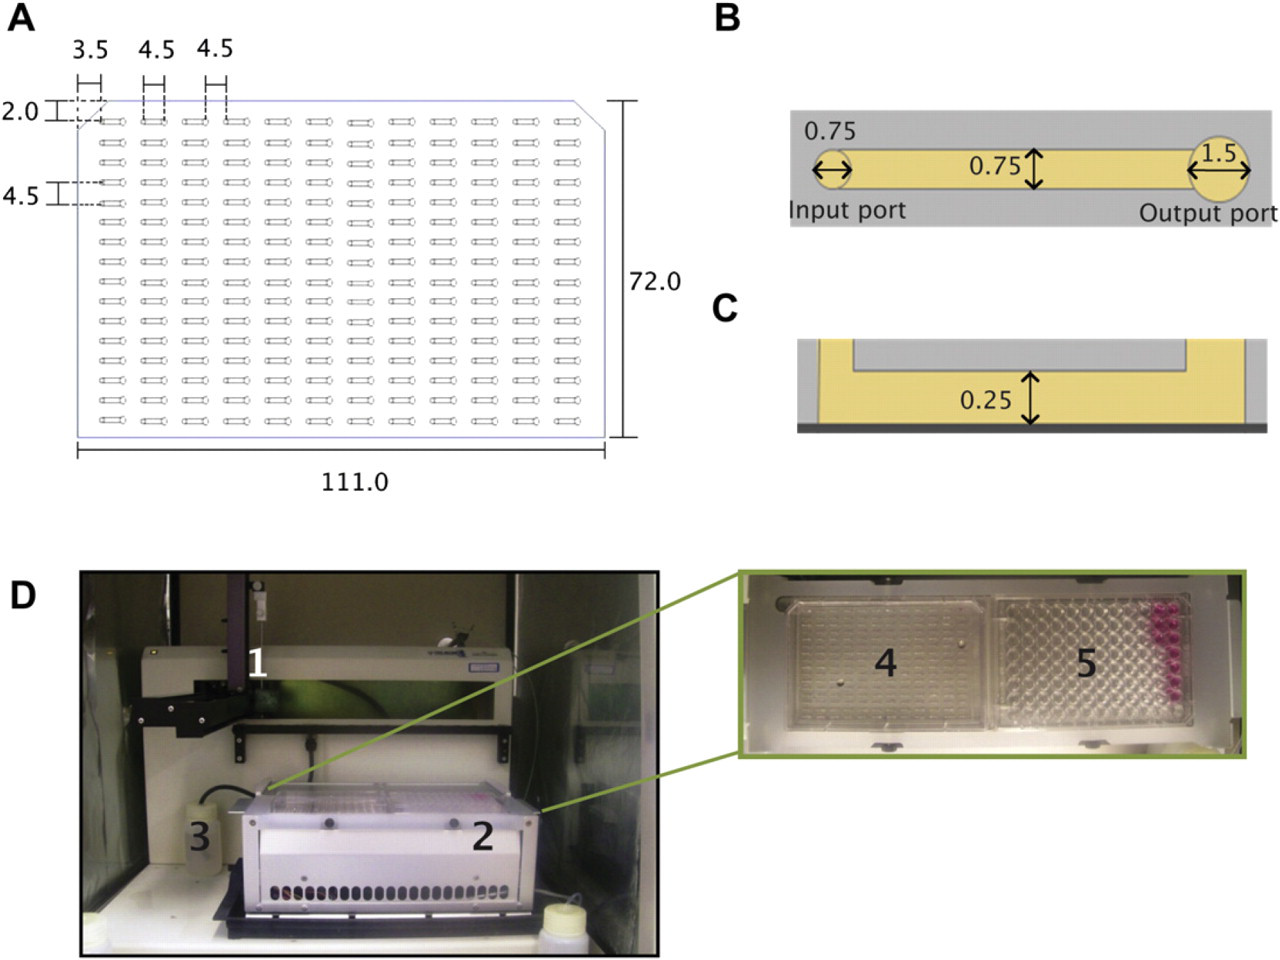
Microchannel dimensions and the automated platform. (A) Geometry of a MCA composed of 192 channels used in the automated platform. (B) Top view of a single microchannel showing the input (left) and output (right) ports. (C) Side view of a single microchannel mounted on a polystyrene omnitray (dark gray). (D) The automated microfluidic platform and its components showing (1) dispensing pipette, (2) Peltier device (for temperature control), (3) waste reservoir, and a top view of Peltier device showing (4) a MCA, and (5) 96-well plate reservoir containing media and collagen/cell suspension. Dimensions in millimeters.
Cell Culture and Collagen Gel Preparation
The HMFs immortalized with human telomerase (HMFs; originally termed RMF/EG) were provided by Dr. Kuperwasser. 35 HMFs were cultured in flasks with high glucose (4.5 mg/mL) Dulbecco's modified Eagle's medium (DMEM; catalog no. 11995, Gibco, Grand Island, NY) supplemented with 10% calf serum and 1% penicillin/streptomycin (Invitrogen, Grand Island, NY) before use in the MCA. Flasks were maintained inside humidified incubators at 37 °C containing 5% CO2. To add cells to the MCA, cells were trypsinized (Gibco, Grand Island, NY), added to culture media, counted, and spun down with a centrifuge at 1000 rpm for 3 min (model 5402; Eppendorf, Hamburg, Germany). At the same time, an acidic type I collagen solution (3.92 mg/mL, rat tail; BD Biosciences, Bedford, MA) was neutralized with a solution of 100 mM 4-(2-hydroxyethyl)-1-piperazinee-thanesulfonic acid (HEPES) at a 1:1 ratio. This 100 mM HEPES solution was previously prepared in 2x phosphate-buffered saline (PBS). DMEM was used to adjust type I collagen concentration to 1.6 mg/mL. After mixing by pipetting up and down, cells were resuspended in DMEM at a density of 6 × 10 cells/mL. Finally, cells and the neutralized type I collagen solution were mixed together to a final collagen concentration of 1.3 mg/mL and cell density of 6 × 10⁵ cells/mL (approximately 700 cells/microchannel). This collagen/cell mixture was added to two wells of a 96-well plate and placed in the automated platform. All collagen solutions were prepared by hand over ice to keep samples cold and avoid collagen polymerization.
Automated Platform and Components
An ALH (223 sample changer, 402 syringe pump, and 250-μL syringe; Gilson, Middleton, WI) was used to load micro-channels, and a Peltier cooler/heater (242 Peltier Rack; Gilson, Middleton, WI) was used to hold in place one 96-well plate and one MCA at the same time (Fig. 1D). This Peltier cooler maintained a temperature of 4 °C during cell seeding and ensured type I collagen stayed as a liquid during sample loading.
Before using the ALH, the system was sterilized by spraying all ALH surfaces with 70% ethanol, rinsing the ALH probe (stainless steel, beveled shape tip; Gilson, Middleton, WI) and transfer tubing (Upchurch Scientific, Oak Harbor, WA) with 70% ethanol and treating all surfaces with UV light for 20 min. The Peltier cooler was then turned on and allowed to reach a stable temperature while the collagen samples were prepared by hand inside an aseptically prepared laminar flow hood. The 96-well plate containing the collagen/cell samples (BD Labware, Franklin Lakes, NJ) and the 192-MCA were placed adjacently on the Peltier cooler (Fig. 1D).
Automation of MCA Precoating and Cell Seeding
All fluid manipulations on the 192-MCA were performed by the ALH. These manipulations are divided into three main processes that were run separately on different days. These processes are described in Figure 2 as MCA precoating, cell seeding, and cell staining. At the beginning of each of these processes, the syringe probe was rinsed in cold water and sent to a touch off zone on the back of the ALH to prevent droplets from sticking to the end of the probe (step A). After rinsing, the probe moved to the 96-well plate to aspirate the solutions to be used in all the three processes.
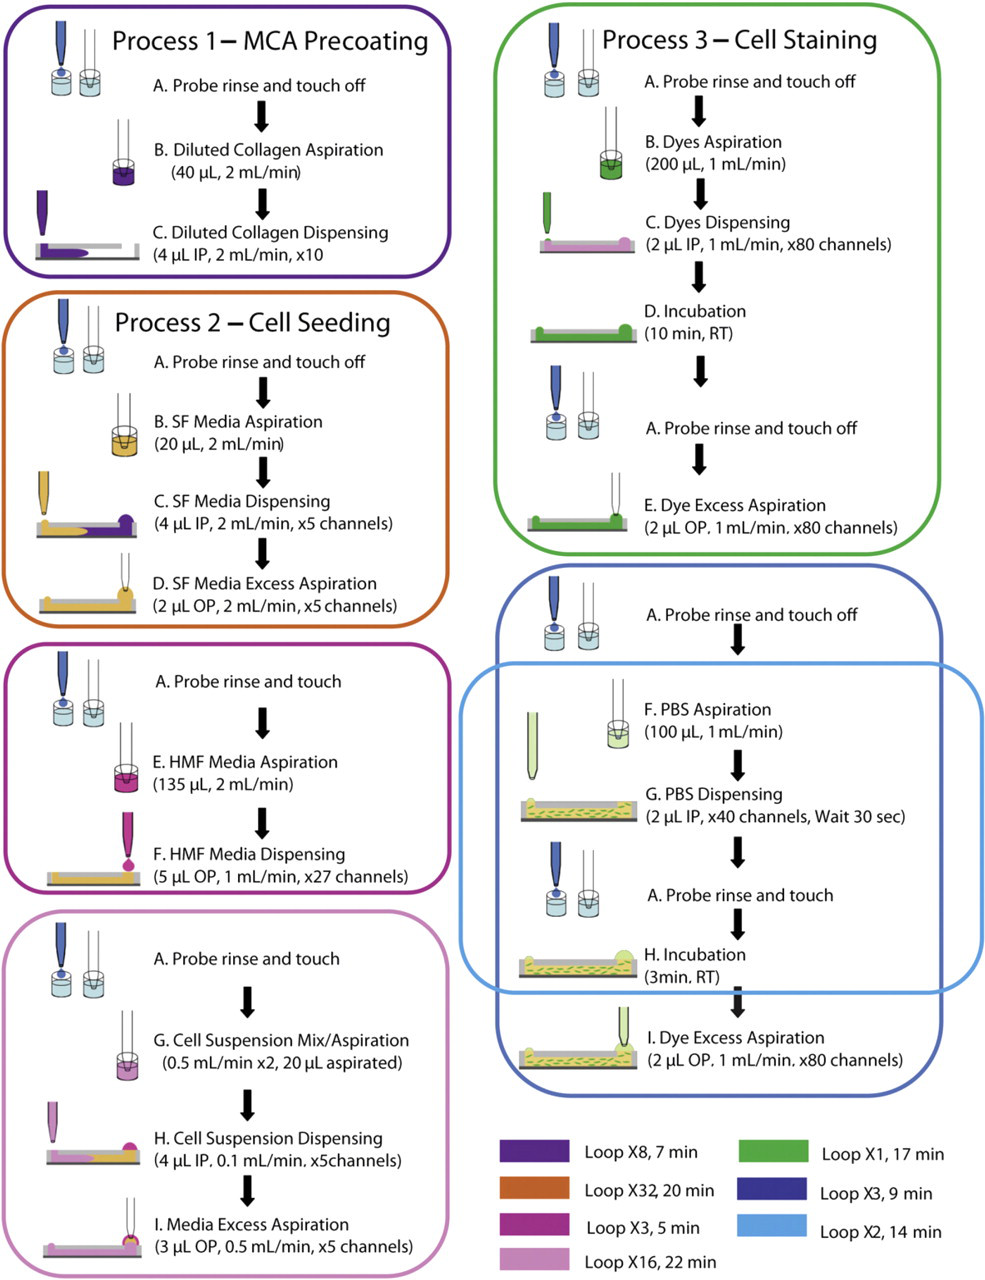
Diagram of automated processes. Three main processes were performed by the automated platform after the system was optimized. Colored squares represent separate loops. IP = input port, OP = output port, RT = room temperature.
During process 1 (MCA precoating), the ALH aspirated 40 μL of the 50-μg/mL type I collagen solution from one well and dispensed 4 μL to the input ports of 10 microchannels. These steps were repeated until a total of 80 microchannels were filled with collagen (steps A–C, purple square, Fig. 2). After all channels were filled with the collagen solution in approximately 7 min, the MCA was kept overnight at 4 °C until the next day.
The cell seeding process (process 2) started on the next day and was divided into three separate loops (orange, magenta, and pink squares, Fig. 2). The first loop rinsed the diluted collagen solution out and filled the microchannels with serum-free (SF) media (DMEM; Gibco, Grand Island, NY). This was done by returning the MCA to the previously sterilized ALH along with the 96-well plate containing four wells filled with SF media. The ALH aspirated the SF media from the 96-well plate to treat 5 microchannels (step B, orange square), dispensed 4 μL to the input ports (step C, orange square, Fig. 2), and aspirated 2 μL from the microchannel's output ports (step D, orange square, Fig. 2). This first loop was repeated 32 times in order to rinse 80 microchannels twice (orange square, Fig. 2). After this, a second loop was used to add DMEM droplets to the output ports of the microchannels (magenta square, Fig. 2). In brief, the ALH probe aspirated 135 μL of HMF culture media from one well of the 96-well plate (step E, magenta square) and dispensed 5 μL to the output ports of approximately 27 microchannels (step F, magenta square, Fig. 2). This loop was repeated a total of three times until 80 microchannels contained DMEM in their output ports (27, 27, and 26 microchannels treated in each loop). The media in the output ports served as a reservoir droplet for passive pumping the collagen/cell suspension that was added during the third loop (pink square, Fig. 2). 27 While the automated platform was performing the first and second loops, the collagen/cell suspension was prepared manually. After preparing the suspension, the MCA was ready for loading, and 250 μL of the collagen/cell suspension was added to two wells of a 96-well plate before running the third loop (pink square, Fig. 2). Immediately after this, the ALH probe rinsed in water, went to the touch off zone (step A, pink square, Fig. 2), and moved to one well containing the cell suspension, where the collagen/cell suspension was mixed twice at a flow rate of 0.5 mL/min (step G, pink square, Fig. 2). Next, the probe aspirated 20 μL of this cell suspension and added 4 μL to the input ports of five microchannels in the MCA (step H, pink square, Fig. 2). Adding the smaller droplet on the input port replaced the contents of the microchannels via passive pumping. After seeding five channels, the probe aspirated the residual volume that remained in the output ports, discarded this volume, and rinsed (step I, pink square, Fig. 2). This procedure was repeated a total of 16 times for seeding 80 micro-channels in the MCA. After the loop was done, the MCA was kept on the cold Peltier for 1 min, flipped upside down, and incubated at 37 °C for 2 min. The MCA was then flipped every 2 min for a total of 10 min to allow type I collagen to polymerize and sustain cells in three dimensions. The total time required for each loop outlined in Figure 2 is summarized at the bottom of the figure with their corresponding colored loop codes.
Automation of Viability Assay—Cell Staining
The viability of HMFs was assessed after the second day of culture in microchannels (LIVE/DEAD Viability/Cytotoxicity Kit for mammalian cells; Invitrogen, Carlsbad, CA). Dye solutions (4 mM calcein acetoxymethyl ester and 2 mM ethidium homodimer-1 in 1 × PBS) were added to two wells of the 96-well plate (250 μL each), and the plate was placed on the ALH platform.
This staining process consists of three main steps that were run consecutively one after the other (green, blue, and light blue squares, Fig. 2). The first loop includes a probe rinse in water (step A, green square), aspiration of the dye solution from the reservoir wells, and dispensing to the input ports of the microchannels (steps B and C, green square, Fig. 2), an incubation period of 10 min at room temperature (step D, green square, Fig. 2), a probe's rinse and touch off (second step A, green square, Fig. 2), and a final aspiration of the excess dye from the output ports (step E, green square, Fig. 2). At the second loop (blue square), the probe is rinsed in water again (step A, blue square), and a third loop follows to rinse microchannels with PBS a total of three times (steps F–I, light blue square, Fig. 2).
Image Acquisition and Analysis
Automated imaging for phase contrast and fluorescence was performed on an inverted microscope (IX70; Olympus, Center Valley, PA) and monochromatic camera (SPOT imaging; Diagnostic Instruments, Inc., Sterling Heights, MI) using x–y image acquisition journaling (MethaMorph 7.5; MDS Analytical Technologies, Downington, PA). A 4 × objective was used to investigate the distribution of the cells within the microchannels, and a 10 × objective was used for looking closer at the cell morphology. The distribution of cells along the length of microchannels was quantified by dividing microchannel images into eight sections of 250 μm with ImageJ software (Rasband, W.S., ImageJ; U.S. National Institutes of Health, Bethesda, MD, http://rsb.info.nih.gov/ij/, 1997–2009) and counting the number of cells in each section. The viability of HMFs was calculated by counting the total number of live and dead cells in each microchannel. 3D cell distributions were observed using a deconvolution microscope (IX71; Olympus, Center Valley, PA). Images were taken in the z-direction using a 20 × objective and a step size of 1 μm to form 3D images using Slidebook 5.0 (Intelligent Imaging Innovations, Inc., Denver, CO). Images were deconvolved after their acquisition by applying nearest-neighbor parameters (theoretical spacing: 0.5 um, subtraction constant: 0.9). The 3D distribution of cells in the collagen matrix was evaluated by counting the total number of cells in the z-direction using incremental steps of 25 μm for a total of 250 μm. Collagen fibers were observed using multiphoton laser scanning microscopy and Second harmonic generation (SHG) with an excitation source produced by a Millenia 8W pump laser (Spectra Physics, Inc., Mountain View, Santa Clara, CA). Both systems were mounted around a Nikon Eclipse TE300, and images were focused onto a Nikon 40X Plan Apo oil-immersion lens (numerical aperture = 1.4), and SHG emission was observed at 445 nm.
T47D Breast Carcinoma Coculture with HMFs
The human breast carcinoma T47D cell line was obtained from Dr. M. Gould (University of Wisconsin, Madison, WI). T47Ds were cultured in low-glucose (1.0 mg/mL) DMEM (catalog no. 11885, Gibco, Grand Island, NY) supplemented with 10% fetal bovine serum, and 1% penicillin/streptomycin (Invitrogen, Grand Island, NY) and HMFs were cultured with high-glucose (4.5 mg/mL) DMEM (catalog no. 11995, Gibco, Grand Island, NY) supplemented with 10% calf serum and 1% penicillin/streptomycin (Invitrogen, Grand Island, NY) before use in the MCA. Both cell types were maintained at 37 °C in a humidified atmosphere incubator containing 5% CO2. For monoculture experiments, T47Ds were trypsinized, resuspended, and added to neutralized type I collagen to get a final collagen concentration of 1.3 mg/mL and cell density of 6 × 10⁵ cells/mL (720 cells/microchannel). In coculture experiments, T47Ds and HMFs were mixed in a 2:1 ratio in type I collagen with DMEM used in HMF culture to get a final collagen concentration of 1.3 mg/mL and cell density of 4 × 10⁵ T47Ds/mL (480 T47Ds/microchannel) and 2 × 10⁵ HMFs/mL (240 HMFs/microchannel). The resulting T47D/collagen and T47D–HMF/collagen mixtures were added to two different wells of a 96-well plate and placed in the automated platform. Samples were prepared by hand and over ice to avoid collagen polymerization.
T47D Cell Growth Analysis
For the quantification of T47D cell growth, microchannels in the MCA were loaded with cells and type I collagen using the automated platform. All other fluid manipulations were performed with the automated platform using the optimized parameters described for the 3D culture of HMF cells. T47D cells were cultured for 5 days with media changes every other day. After the fifth day of culture, cells were fixed with 4% paraformaldehyde for 20 min at room temperature and washed three times with PBS. Samples were further treated with 0.1 M glycine in PBS to reduce the collagen autofluorescence, and the MCA was kept at 4 °C overnight. The following day, the MCA was placed back on the automated platform, and the microchannels were washed three times with PBS and treated with 0.1% Triton X-100 in PBS for 90 min at room temperature to permeabilize cell membranes. Samples were then washed three times with PBS and blocked with 10% goat serum overnight at 4 °C. The next day, cells were stained, and the MCA was incubated overnight at 4 °C using primary antibodies diluted at a 1:50 (mouse monoclonal antihuman pan-cytokeratin (CK); LabVision, Fremont, CA) and 1:150 dilution ratios (rabbit polyclonal antihuman vimentin (VM); LabVision, Fremont, CA). Secondary antibodies were added the following day at a 1:150 dilution ratio (Alexa Fluor 594 goat antimouse; Alexa Fluor 488 goat antirabbit; Invitrogen, Carlsbad, CA) and incubated overnight at 4 °C. For counterstaining the nuclei, Hoechst 33342 was used at 20 μg/mL (H3570; Invitrogen, Carlsbad, CA). Lastly, the microchannels were washed with PBS four times.
Analysis of the total T47D staining area per microchannel was done using two methods, fluorescence microscopy and fluorescence scanning (Typhoon Trio; GE Healthcare). Fluorescence microscopy images provided a standard for comparing the results from the scanner for validation. Fluorescence images were obtained for each microchannel using the x-y image acquisition journaling (MethaMorph 7.5) that was previously used for the viability analysis. Total T47D staining area was calculated using ImageJ software. For the automated analysis, the MCA was placed on the scanner, and software analysis was performed on the scanned image to analyze the total fluorescence intensity per microchannel (ImageQuant TL, Array version 7.0, GE). Samples with no primary antibody were used as negative controls. All analyses were conducted over the entire channel region.
Results and Discussion
The microfluidic platform described in this work was automated for 3D cell culture through the incorporation of an MCA and an ALH that performed all fluidic manipulations in the array. The Peltier device used in this platform maintained a low temperature during cell seeding, enabling the handling of collagen samples. Because of intrinsic characteristics of 3D culture, the successful automation of this 3D platform required a different set of optimized parameters from a previously reported 2D platform. 30 Specifically, the optimization of several operations and parameters, such as surface treatment, sample mixing, and total loading time, was required to reduce collagen contraction, maintain a uniform cell seeding distribution, prevent the removal of contents in microchannels during sample washing, and minimize the total time that cells spent on the platform. First, we discussed in more detail how we addressed each of these points. Second, we used biological validations to evaluate cell morphology, cell viability, distribution of cells in the 3D matrix, and collagen fiber formation. Finally, we further validate the optimized platform as a screening tool via co-cultures of T47D breast carcinoma cells and HMFs in a type I collagen matrix and compare T47D cell growth with previously reported data. 34,36 This coculture experiment was completely automated by using the optimized operations and parameters discussed before to perform all fluidic manipulations, including collagen surface coating, cell seeding, media changes, fixing, blocking, and inmmunostaining.
System Automation and Optimization of Operational Parameters
Collagen gel contraction was minimized in our 3D cell cultures by treating the interior surface of microchannels before adding the collagen/cell suspension. Controlling contraction is important in microchannels as it can reduce sample size significantly and make sample analysis more difficult. Therefore, to control the contraction in our microchannels, a type I collagen monomer precoating step previously used 31 was automated and included before loading the collagen/cell suspension (process 1, Fig. 2). SF media were used to rinse out the collagen monomer solution to keep the PDMS surface hydrophobic (process 2, orange square, Fig. 2). This was particularly important as proteins in serum-containing media can make the PDMS surface hydrophilic and reduce the contact angle of the droplets necessary for passive pumping. 27
Seeding cells inside microchannels during process 2 required mixing the collagen/cell suspension continuously to maintain a uniform cell seeding distribution along micro-channels. To achieve this, the collagen/cell suspension in wells was mixed by pipetting with the automated probe after loading five channels in the MCA. Previously, magnetic stir bars were used inside wells to keep cell suspensions homogeneously mixed in 2D cell cultures. However, using stir bars required the incorporation of magnetic plates that are difficult to add in our platform because of the presence of Peltier devices that are required to keep collagen samples cold. Figure 3A shows a microchannel loaded with the automated platform. An even distribution of cells was observed along the length of the microchannel. This distribution of cells was further quantified in Figure 4B for different positions in the MCA. Therefore, pipetting the collagen/cell solution multiple times with the automated probe proved to be effective for mixing the solution and ensuring a uniform cell density along the MCA.
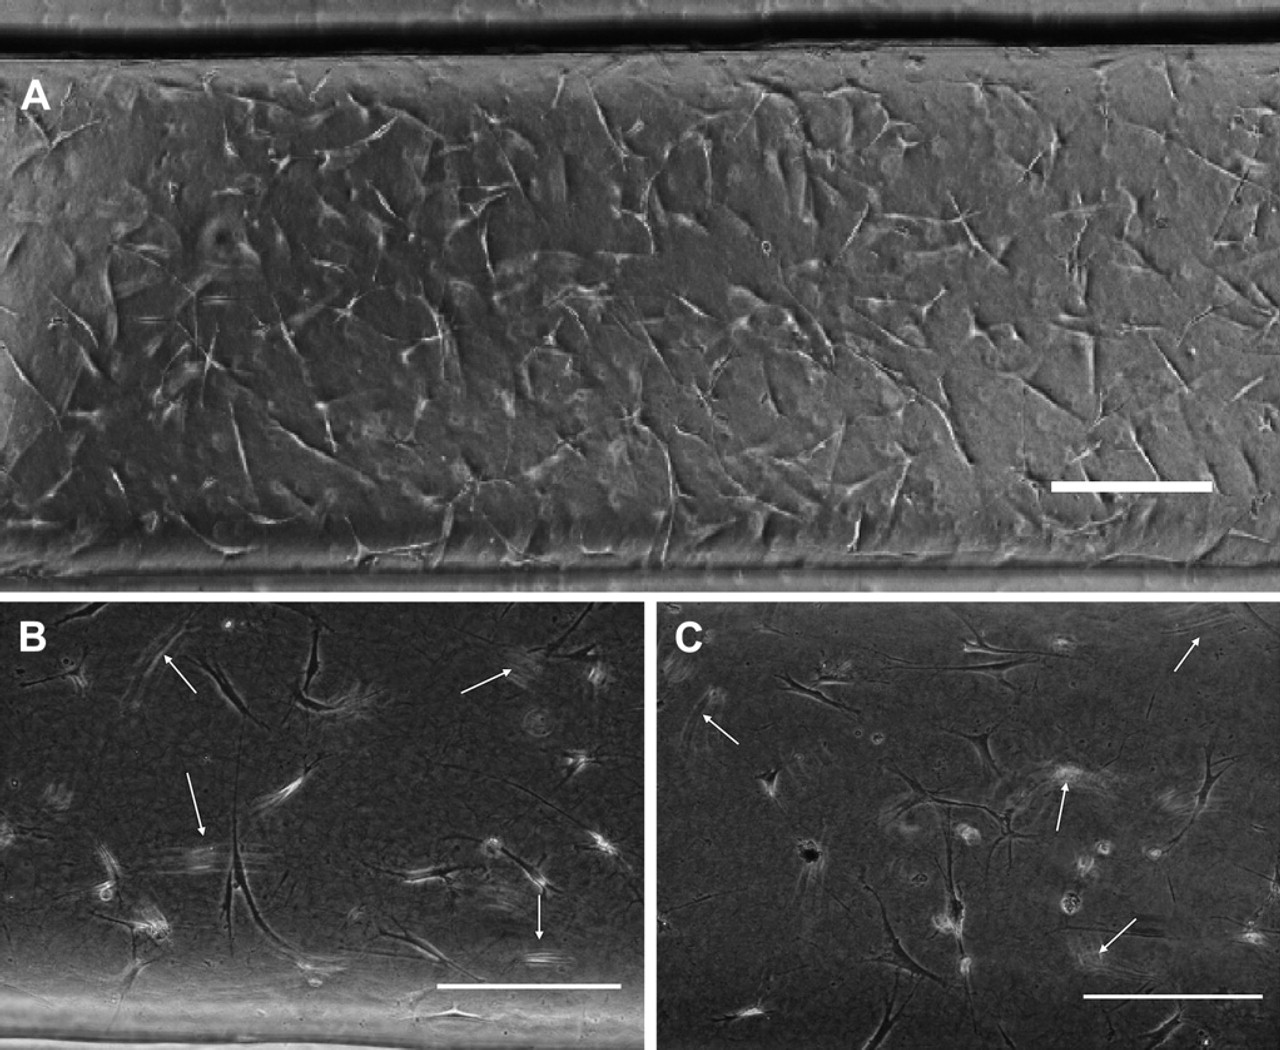
Morphology and distribution of HMF cells loaded manually and with the automated platform. (A) Phase contrast image of HMFs loaded inside a microchannel with 1.3 mg/mL type I collagen using the automated platform. Cells inside a microchannel loaded (B) by hand and (C) with the automated platform show similar morphology. Arrows point fibroblasts in different focal planes, suggesting a 3D distribution. Scale bars represent 200 μm.
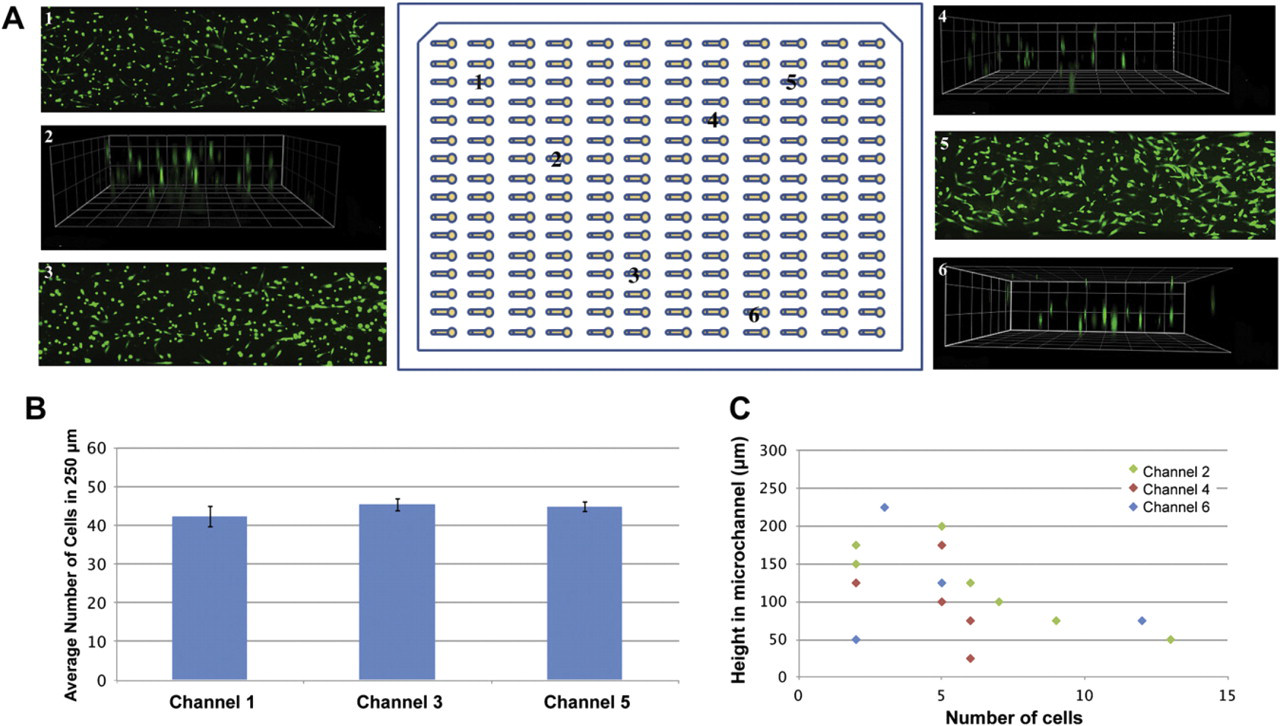
Uniformity in viability and 3D distribution of cells in the MCA. (A) Microchannels 1, 3, and 5 show cells with an average viability of 90%. Channels 2, 4, and 6 show a 3D distribution of cells inside 250-μm high microchannels. (B) Average number of HMFs along 250-μm sections of microchannels 1, 3, and 5 show no significant differences among these channels. (C) HMFs are distributed in 3D along different heights in microchannels 2, 4, and 6. Squares dimensions are 100 μm.
The aspiration of excess volumes is necessary when performing multiple washes as fluid is replaced from the input to output port via passive pumping and output drops increase in volume. 27 This fluid replacement is possible in 3D cell cultures because of contraction of the matrix on the top surface of the microchannel that permits fresh fluid to flow inside the microchannel. 31 However, the removal of excess volumes from the output ports in 3D cultures requires care so as not to accidentally remove any of the collagen/gel sample when aspirating the output droplets. To avoid removal of the channel contents during aspiration, the probe's height was modified in process 3, such that during the excess volume aspiration steps (steps E and I, green and blue squares, respectively, Fig. 2) the probe was raised 1 mm higher than during the dispensing steps on the input ports (steps C and G, green and light blue squares, respectively, Fig. 2). Finally, two loops were included at the end of the process 3 that ensured the dye solution was rinsed out from the microchannels (steps A thru I, blue and light blue squares, Fig. 2).
The total time that cells spent in each process on the automated platform was critical to maintain cell viability. This was particularly important in processes that involved either cells suspended in cold type I collagen (pink square, process 2, Fig. 2) or cells cultured in microchannels (process 3, Fig. 2). Accordingly, process 2 was divided into three loops that were run separately. The first and second loops (orange and magenta squares, Fig. 2) were run during sample preparation, such that the precoating solution was rinsed out of micro-channels (orange square, Fig. 2), and output droplets were dispensed on the array for passive pumping (magenta square, Fig. 2) before cells were suspended in type I collagen and added to the 96-well plate. The bottom region of Figure 2 shows a color code with the total time spent for each loop in all the three processes. The platform takes approximately 47 min to run all the three loops in process 2. However, by separating process 2 into three separate loops, cells stayed in the cold collagen for only 22 min (pink square). It is important to note that although the automated platform was able to load the MCA with the precoating solution in a shorter amount of time (process 1, approximately 7 min), a continuous rinsing of the probe and mixing of the collagen/cell suspension during cell seeding was necessary to avoid clogging the probe and ensuring a uniform cell seeding density along the MCA. The total time required for staining cells with the automated platform (process 3) was also important because cells are not fixed in viability assays but rather stay alive during the staining process. Other staining protocols (e.g., immunostaining) require fixing the cells before staining, and thus the total time spent on each process after fixing is not critical. Nevertheless, a viability assay was found useful for testing the capability of the automated platform for staining cells and for determining the sensitivity of cells to previous fluidic manipulations (cell loading, cell mixing, and cell seeding). The total time spent on process 3 was shortened by adding droplets only to the input ports (steps C and G, green and light blue squares, Fig. 2) and aspirating out the same volume from the output ports (steps E and I, green and blue squares, Fig. 2), instead of aspirating droplets from output and input ports and dispensing new droplets to both input and output ports. Passive pumping was still possible because of the presence of media droplets on the output ports that were already present during cell culture.
Biological Validation of the Automated Platform
After optimizing the system's operational parameters, we examined the viability and morphology of HMFs seeded and cultured with the automated platform as compared with cells seeded in microchannels by hand. Figure 3B shows a microchannel that was loaded manually and Figure 3C a microchannel randomly chosen from a MCA loaded with the automated platform. As can be seen from the figures, HMFs show a similar stretched morphology for both loading techniques. Moreover, HMFs were seen in different focal planes (pointed out by white arrows) in microchannels loaded both by hand and with the automated platform, which suggested that cells were also distributed in the collagen matrix in 3D.
The viability of HMF cells was evaluated using several pipetting speeds and number of mixes (mixing up and down) to determine the optimum pipetting manipulation for the cell seeding process (process 2, Fig. 2). This is particularly important in our platform as the collagen/cell suspension needs to be continuously mixed to maintain a uniform cell seeding distribution in the MCA. However, a continuous and vigorous pipetting of the collagen/cell suspension can also cause cell damage. Excessive trituration (mixing via pipetting up and down)isknown to produce shear stress and damage to embryo cultures. 37 In our system, cells are exposed to shear stresses during sample mixing, while type I collagen is still a liquid. After the loading is finished and type I collagen gel is polymerized, cells are embedded in 3D type I collagen, and exposure to shear stress is minimal for subsequent fluid changes. Therefore, pipetting triturations in our system were minimized during the cell seeding process (process 2, Fig. 2) to reduce shear stresses and possible damage to the cells. Speeds varying from 2 mL/min to 0.5 mL/min were tested, and cell viability was assessed to look at how cells responded to the pipette's manipulation. It was found that a speed of 0.5 mL/min increased cell viability to 90% that contrasted with the initial cell viability of 31% found when using a speed of 2 mL/min (Fig. 5A). In addition to the speed of pipetting, the total number of mixes also affected cell viability. Initially, the collagen/cell suspension was mixed at 0.5 mL/min four times (pipetting up/down counting as one mix) before loading into the microchannels. Subsequently, it was found that reducing the number of mixes to two increased cell viability to 99% (Fig. 5B). Thus, the optimum condition for mixing the collagen/cell sample was found to be mixing at the reduced speed of 0.5 mL/min twice after loading five microchannels in the array. A 99% in viability demonstrates that our platform is not just robust enough to aspirate and dispense a collagen/cell suspension but gentle enough to mix cells and keep them viable for cell culture purposes as well.
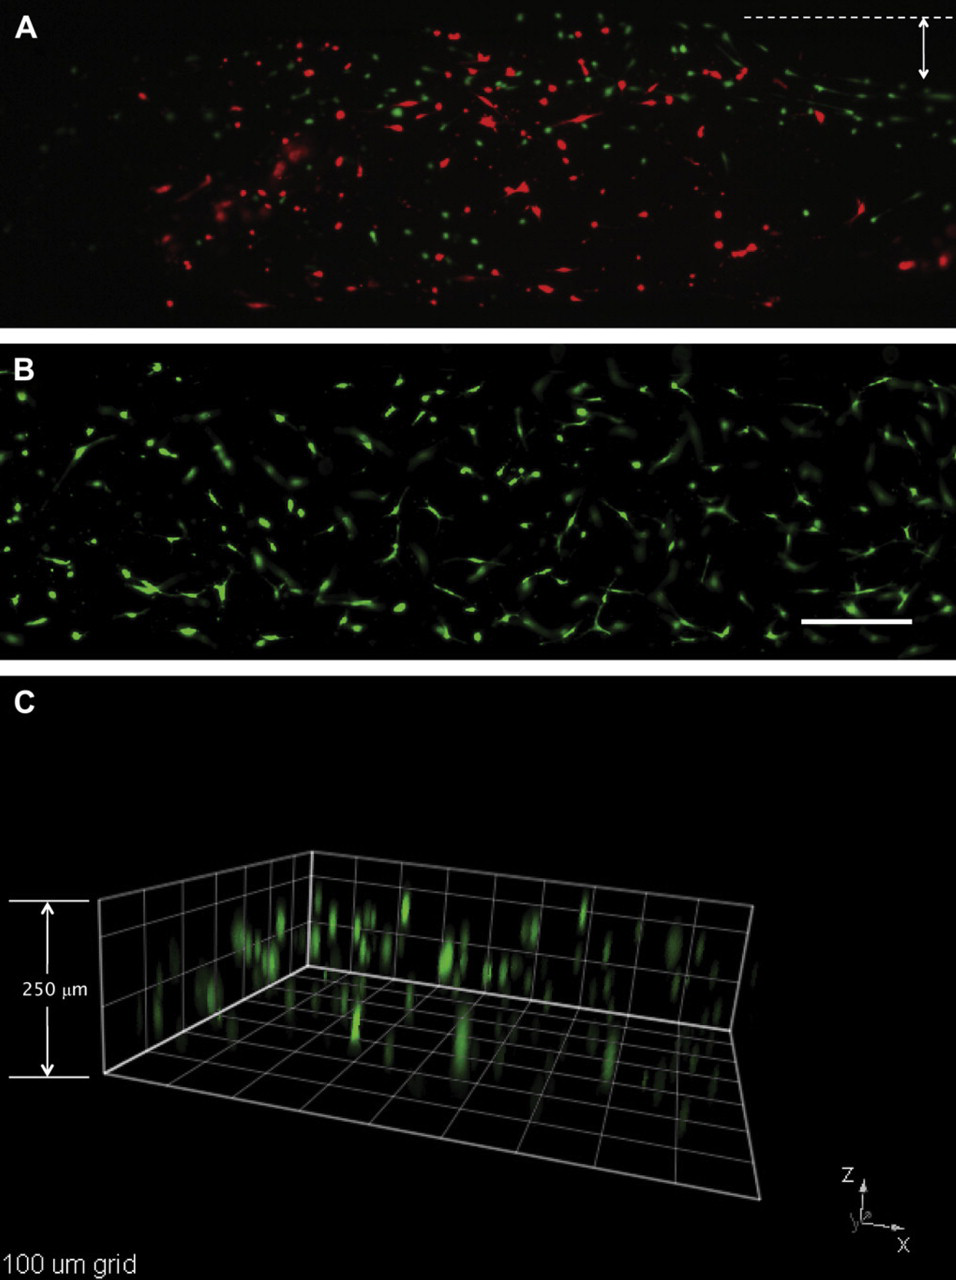
Viability and 3D distribution of HMF cells loaded with the automated platform. Fluorescent images of HMFs suspended in 1.3-mg/mL type I collagen, loaded, and stained with the automated platform (A) before and (B) after system optimization. (A) A cell viability of 31% and collagen contraction on the sides of the microchannel was observed before system optimization. (B) A viability of 99% and minimum collagen contraction was found after the system was optimized. Calcein acetoxymethyl ester stained for live cells (green) and ethidium homodimer-1 for dead cells (red). Arrow shows collagen contraction before system optimization. (C) A 250-μm high microchannel was loaded with HMFs using the automated platform. HMF cells (green) showed a 3D distribution along 200 μm of type I collagen matrix. Square dimensions are 100 μm. Scale bar represents 200 μm.
To corroborate the 3D distribution of cells inside micro-channels, cells were stained using the protocol previously described with the automated platform and observed via fluorescent microscopy. Figure 5C shows a stack of images from a microchannel that was seeded, stained, and washed using the automated platform. HMFs showed to be distributed along 200 μm of matrix inside a 250-μm high microchannel. Previously, a collagen contraction of approximately 16.5% (167.25 μm in 200-μm high microchannels) was reported for type I collagen gels containing HMFs. 31 Although the actual height of the microchannels used in this work was 250 μm, a contraction of 20% was observed, which is similar to the 16.5% collagen contraction reported previously.
After observing that cells were distributed along the length (Fig. 3A) and height (Fig. 5C) of microchannels, their distribution through the MCA was examined. Six microchannels were randomly selected to evaluate the capability of the automated platform for obtaining a uniform cell distribution along the length of microchannels (microchannels 1, 3, and 5) and a 3D cell distribution (microchannels 2, 4, and 6). As can be seen from Figure 4A, the automated platform was able to seed cells uniformly along the length and height of microchannels in different places in the MCA. This qualitative observation was further validated by quantifying the number of cells in eight equally divided sections (250 μm in length per section) along the channel length (Fig. 4B). Cell number averages of 42 ± 3, 45 ± 2, and 45 ± 1 were found every 250 μm, in microchannels 1, 3, and 5, respectively. No significant differences were found between cell average numbers on these microchannels. Additionally, the 3D cell distribution was quantified for microchannels 2, 4, and 6 (Fig. 4C). Cells were observed at heights starting from 17 μm above the bottom of the microchannel (microchannel 4) to up to 231 μm (microchannel 6). Finally, the cell viability was evaluated and found to be 90% along the whole MCA. These results confirm that our platform optimization was successful and that mixing the collagen/cell suspension and flipping the device after seeding cells were effective enough to seed cells uniformly along the length of microchannels and to suspend cells in 3D during matrix polymerization.
Finally, type I collagen fiber formation was examined to determine if our platform was controlling collagen polymerization properly. It has been shown previously that type I collagen polymerization in microsystems is different from macro systems mainly because of increased heat transfer caused by the high surface area to volume ratio of microsystems. 31 This high surface area to volume ratio accelerates sample warming and results in a faster polymerization in microsystems. To control this, a cold Peltier device was used to keep collagen samples at low temperatures during sample loading. SHG imaging revealed that a similar type I collagen fiber structure is obtained with microchannels loaded from collagen samples kept on the Peltier device (Fig. 6A, B) and microchannels loaded with collagen samples kept over ice (Fig. 6C). This similarity in type I collagen fiber structure was also observed in microchannels loaded right before loading the MCA (0 min, Fig. 6A) and right after loading the whole MCA (22 min, Fig. 6B). Figure 6D shows that no significant differences in SHG intensities were observed in microchannels A thru C. This confirmed that our platform controls the temperature of the collagen/cell suspension in the wells and that a similar type I collagen structure can be obtained in microchannels loaded between 0 and 22 min.
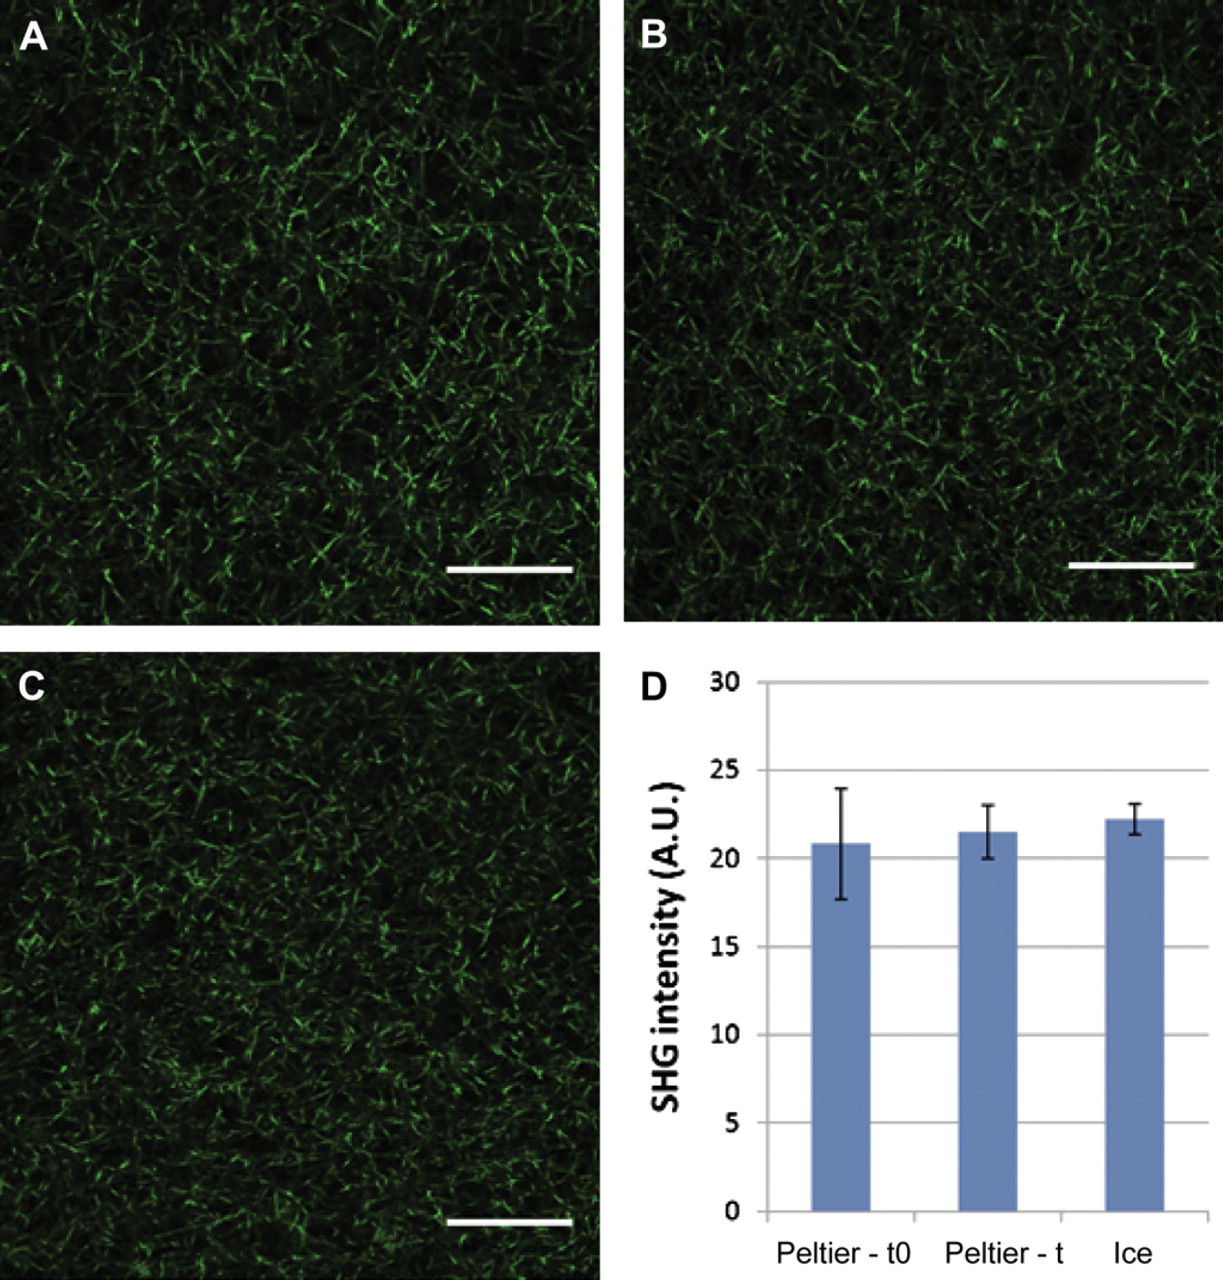
Collagen fiber polymerization in microchannels loaded on Peltier device and over ice. SHG images of microchannels loaded with type I collagen on Peltier device (A) before starting the cell seeding process (0 min, Process 2) and (B) after the duration of cell seeding process (22 min, process 2). A similar type I collagen fiber structure was observed in (C) microchannel loaded using traditional preparation methods over ice, thus confirming proper fiber collagen polymerization in microchannels loaded on the Peltier device. (D) No significant differences in SHG intensity were found for microchannels loaded on Peltier device before (Peltier-t0) or after the cell seeding process (Peltier-t) or when samples were kept over ice (Ice). A.U., measured as arbitrary units. Scale bars represent 50 μm.
Screening of T47D Cell Growth
A 3D coculture system of T47D breast carcinoma cells with HMFs was used to validate the screening capabilities of the automated platform. Previously, this model was used to study paracrine signaling pathways between T47D and HMFs in type I collagen gels 36 and showed that the presence of HMFs in T47D cultures induced an increase in T47D carcinoma cell growth when compared with T47D monocultures. More recently, this 3D model was validated for microfluidic cell culture. 34 Here, we used the automated microfluidic platform to seed, fix, and stain T47D breast carcinoma cells and HMFs inside tubeless microchannels. All fluidic manipulations were performed using the optimized parameters previously found for HMF cell culture. T47D cells were cultured in monocultures (T47D) and cocultures (T47D and HMFs) for 5 days inside microchannels, and T47D cells were distinguished from HMFs by immunocyto-chemical labeling of CK in T47Ds and VM in HMFs. Figure 7A and B shows images of microchannels containing monocultures of T47Ds and cocultures with HMFs, respectively. As can be seen from the figures, T47Ds (red) grew in bigger clusters when cocultured with HMFs (green) than in monocultures. To quantify this difference in T47D cluster size, the total CK-positive staining area was used as a surrogate of T47D growth. Previous models have shown that there is a direct correlation between T47D cell number and CK-positive area. 34,36 We confirmed this observation in our system by counting the total number of T47D nuclei per clusters manually and found that the CK-positive area correlates to not only the cell number but also the nuclei staining (Fig. 7E). This last correlation can be particularly useful for performing a fast analysis of the total T47D cell number in monocultures and simplifying the staining protocol, as fixing and secondary staining are not necessary. Therefore, T47D cell growth was evaluated in monocultures and cocultures using two methods. The first method quantified the total CK-positive fluorescence per microchannel by using a fluorescent scanner, and the second method evaluated total T47D nuclei area in microchannels by manually adjusting a threshold of T47D clusters with ImageJ. Thus, the first method provided a fast automated analysis of total CK-staining area per microchannel, and the second method served as a comparison standard. Figure 7C and D shows data obtained from the scanner and manual calculation, respectively. In both cases, cluster size of T47Ds was approximately 1.5 times bigger in cocultures than in monocultures. This induction in T47D cells agrees with previous reports where a 1.5- to 2.5-fold increase in breast carcinoma cell growth was observed. 34 The fact that we were able to obtain similar results between the automated scanner and manual calculations shows that either CK-positive staining area or nuclei staining area can be used to quantify T47D cell number, and that the scanner could be used as a tool for a faster analysis. These results also confirm the utility of the automated microfluidic platform for 3D culture and promise to be a useful tool for other cell screenings.
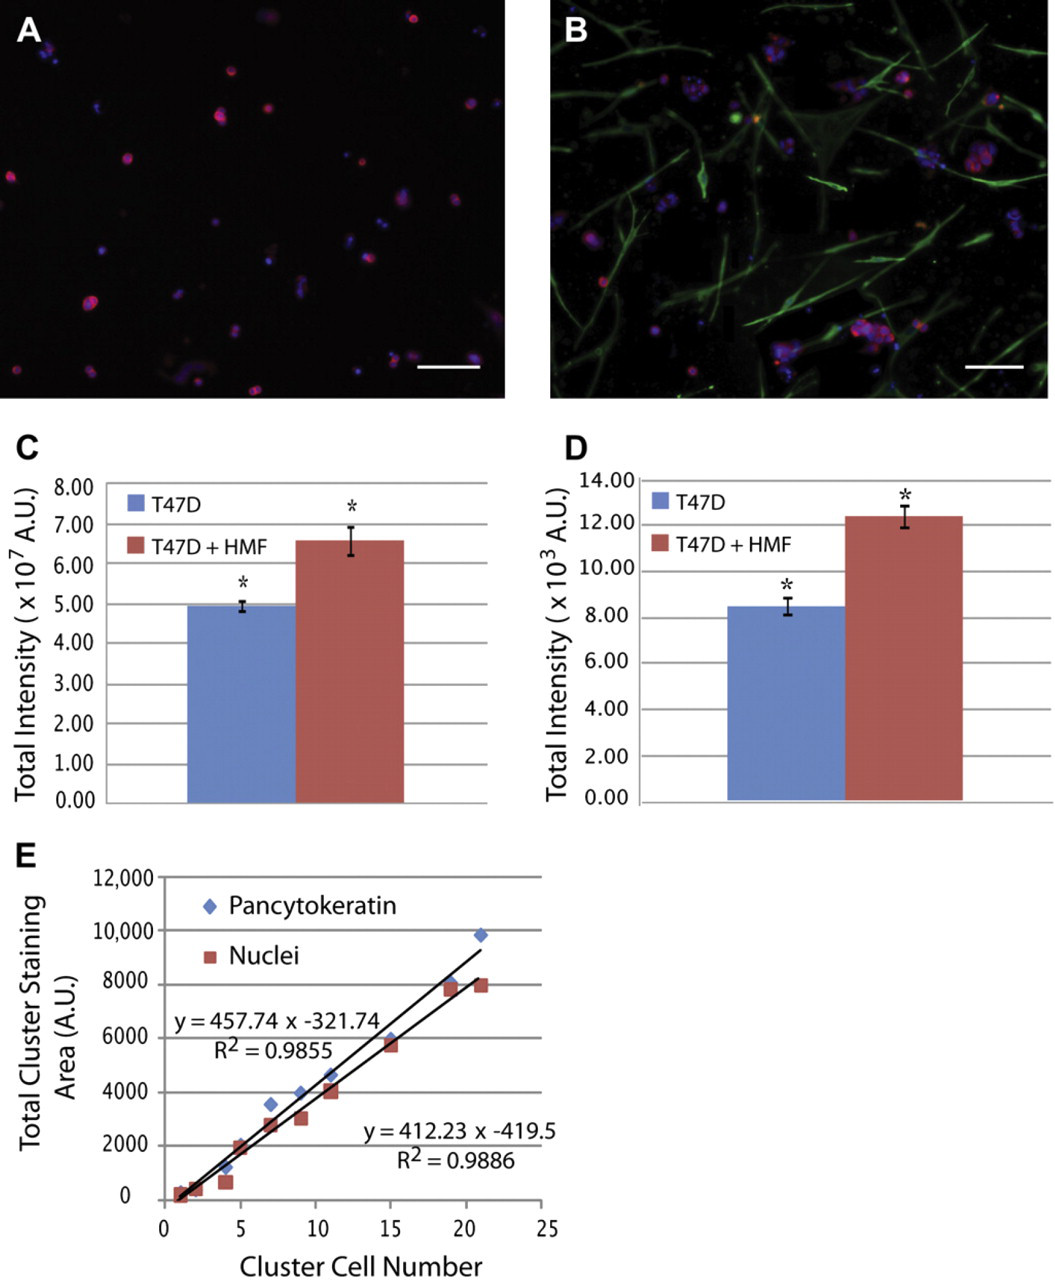
Screening of T47D cell growth. T47D cells were grown for 5 days and stained for CK (red), VM (green), and cell nuclei (Hoechst, blue). (A) T47D carcinoma cells grow into small and irregular clusters in monocultures. (B) In contrast, in presence of HMF cells, T47D cells grow into bigger clusters. (C) A CK total area analysis was performed via fluorescent scanning, and total fluorescence intensity in microchannels showed a 1.5-fold increase in cocultures (red bar) when compared with monocultures (blue bar). (D) Manual calculation of total nuclei staining area also shows a 1.5-fold increase in T47D growth in cocultures. (E) A linear correlation was found between the number of T47D cells in the clusters and the total CK-positive (blue diamond) and nuclei staining (red squares) areas. Scale bars represent 150 μm. n = 30, *P < 0.02. A.U., measured as arbitrary units.
Conclusion
The increased interest in studying cells in 3D has created a need for low-cost high throughput systems capable of screening for parameters in the microenvironment that influence cellular behavior. Tubeless microfluidic devices promise to be a useful tool for screening the cellular microenvironment because of their easy incorporation with ALHs and scanners, capacity for treating samples individually, ability to increase the number of replicates and experimental conditions, and ability to markedly reduce reagent consumption and total costs. This work has shown that a tubeless 192-MCA can be easily incorporated into an ALH after system optimization for 3D cell culture. The individualized treatment allowed for the culture of T47D breast carcinoma cells in monocultures and cocultures with HMFs in separate compartments. Differences in T47D cell growth in monocultures and cocultures were quantified using a laser scanner for a rapid high throughput analysis and confirmed with manual calculations. Moreover, the total reagent volumes were significantly reduced when compared with traditional 3D cell culture methods. For example, one data point in an MCA only requires the loading of one microchannel with 2 μL of sample, whereas a traditional 3D cell culture assay (e.g., 96-well plate) requires a minimum of 50 μL. Therefore, a 25-fold in savings can be obtained with microchannels when compared with traditional 3D culture methods. This is particularly important for high throughput 3D cell screenings that use numerous data points, primary cells, and costly ECM proteins.
In addition to reducing total costs and effort, this automated platform was validated by looking at the cell morphology, cell viability, 3D distribution of cells, and type I collagen fiber structure in microchannels loaded with the automated platform. When the cells seeded by the automated platform were compared with cells cultured by hand, it was found that our automated platform was gentle enough to handle cells, and no morphological differences were seen. The screening capabilities of this platform were further tested by loading human breast carcinoma cells (T47Ds) with HMFs, and it was found that the platform was robust enough to coculture these cells in microchannels. An automated scanning analysis was performed using this model, and results similar to those reported elsewhere were obtained. 34,36 In conclusion, the microfluidic platform presented in this work promises to be useful for future cell screenings that will facilitate the study of cell–ECM interactions.
Acknowledgments
The authors thank Gui Su for her insight in 3D T47D breast carcinoma co-cultures and the Laboratory for Optical and Computational Instrumentation for their help with SHG imaging. This work was supported by the NIH 5T32GM08349, NIH R33 CA137673, the Korea Research Foundation grant (KRF-2008–220-D00133), and NLM training grant (NLM 5T15LM007359).
Competing Interests Statement: The authors disclose that D. J. Beebe has an ownership interest in BellBrook Labs, LLC, which has licensed technology presented in this manuscript.