
Abstract
The HID EVOlution—qPCR/STR Setup System enables automation of DNA quantitative real-time polymerase chain reaction (PCR) setup, normalization of DNA sample, and PCR setup for short tandem repeat (STR) analysis. The HID EVOlution System tracks sample and reagent information and facilitates data transfer of DNA quantification, normalization, and PCR setup for STR analysis steps, eliminating the need for manual processing and repetitive data entry. Instruments for the automated system include a Tecan Freedom EVO 150 robot for liquid handling, the 7500 Real-Time PCR System for DNA quantification, the GeneAmp PCR System 9700 for STR amplification, and the 3130xl Genetic Analyzer for the detection of amplified STR fragments. Validation studies including reproducibility, accuracy, correlation, and contamination studies were performed. Results demonstrated clean liquid-handling capabilities and maintenance of sample integrity. Variation in average allele peak height obtained using automated protocol was similar to that obtained using the manual protocol.
Introduction
Short tandem repeats (STRs) are microsatellite loci that reside as repeat units of nucleotide sequence typically ranging from 2 to 6 nucleotides. 1,2 Polymorphic STR loci, loci exhibiting variation in the number of repeat units among individuals, are useful in distinguishing between two individuals. A high degree of discrimination among individuals in the population can be achieved when multiple STR loci are examined. Therefore, STR profiling has been accepted as a standard methodology for human identification (HID). A set of 13 autosomal STR loci referred to as Combined DNA Index System (CODIS) loci are identified for generating a national database in the United States. The use and acceptance of the DNA results in the court system for the past two decades, the passing of new legislations for DNA databasing, and the availability of government funding have increased the number of samples that can be processed for STR profiling worldwide. As a result, backlogs of database and casework samples in forensic laboratories have been a continuous issue for the past decade. 3 The backlog of convicted offender samples in 2007 estimated by National Institute of Justice was 708,706. 4 The number of offender profiles in the Federal Bureau of Investigation's CODIS database alone increased from 460,365 in the year 2000 to 6,575,018 in 2009. 5 Automation, therefore, is an important tool in meeting increasing workload needs and reducing turnaround time in the forensic laboratory while maintaining precise and accurate sample processing.
A typical STR profiling exercise is a lengthy procedure using multiple technologies:
Extraction of DNA from a biological sample. It is important to obtain high recovery of DNA that is free of inhibitors for polymerase chain reaction (PCR).
Quantification of human DNA in the extracted sample. This is to ensure that an optimal quantity of human DNA template is used for the amplification reaction because forensic samples often contain nonhuman DNA.
Multiplex amplification of STR loci using PCR methodology.
Separation of amplified products usually by capillary electrophoresis (CE).
Data analysis for genotyping and interpretation.
Each of the above-described methodologies comprises multiple steps. These experiments are traditionally performed manually, which makes STR profiling a tedious, time-consuming, labor-intensive, low-throughput, and expensive exercise. Automation of different steps in STR profiling offers certain advantages, such as increased throughput, streamlined data transfer, minimal sample transfer and data entry errors, tracking of the sample throughout the process, and increased laboratory productivity and labor savings. In addition, automation in the forensic laboratory achieves efficient use of resources, enabling highly trained and skilled analysts to devote more time to the analysis of results.
In the past few years, forensic laboratories have been transitioning into automation. Some laboratories have independently developed automated protocols using commercially available robotic platforms. 6 8 Laboratories have begun automating individual methods in the STR profiling workflow, for example, extraction, quantification, PCR setup for multiplex amplification, amplified product setup for CE, and data trans-fer. 9 Although high-throughput laboratories have adopted automation strategies, automation for low- and medium-throughput laboratories is still a challenge because of limited resources and the availability of validated ready-to-use automation systems. We have developed the HID EVOlution—qPCR/STR Setup System, which is a graphical user interface for Freedom EVOware software for use with the Tecan Freedom EVO 150 robot. The HID EVOlution System achieves automation of quantitative real-time PCR (qPCR) setup using the Quantifiler Human DNA Quantification kits (Applied Biosystems, Foster City, CA), normalization of the DNA samples, and PCR setup for STR amplification using the AmpFℓSTR PCR Amplification kits (Applied Biosystems, Foster City, CA). The AmpFℓSTR PCR Amplification kits enable simultaneous amplification of multiple STR loci and are routinely used in forensic laboratories for DNA analysis. 10 15 The system integrates the forensic workflow from the quantification of human DNA using the 7500 Real-Time PCR System, multiplex amplification of STR loci using the GeneAmp PCR System 9700 to the analysis of amplified products on the 3130xl Genetic Analyzers. Validation studies for the HID EVOlution—qPCR/STR Setup System were performed following the revised validation guidelines provided by the Scientific Working Group on DNA Analysis Methods (SWGDAM). 16 The goals of developing the HID EVOlution System were to reduce the hands-on time required to set up and process samples, eliminate transposition errors, and streamline transfer of sample data between instruments.
Freedom EVO 150 Robot Description
The Freedom EVO 150 instrument used in the present study is configured with four low-volume disposable tip (DiTi) adapters, low-volume tubing, and 250-μL syringes. The system also contains a PosID-3 (Positive identification option, barcode scanner) for automated barcode ID of the samples. Standard Tecan carriers were used to hold DiTi, troughs, and 1.5-mL microfuge tubes. Custom microplate carriers with custom metal racks were designed to hold specific reagents for quantification and STR setup. Reaction plates were held in place using metal plate holders to facilitate liquid detection. The metal reagent holders were refrigerated before use to keep the reagents cool during reaction setup. The scripts were programmed and optimized to maximize liquid transfer accuracy; 200-μL capacity disposable tips were used to prepare and dispense the master mix and 10 mM Tris-HCl, pH 8.0 containing 0.1 mM EDTA (TE) buffer, and 50-μL capacity disposable tips were used to transfer the DNA samples. Furthermore, ≥2.0 μL volume of DNA sample was used to dilute DNA samples during the DNA normalization step to maximize pipetting performance. Dispensing of master mix was optimized for accuracy and speed using a multidispensing functionality, wherein the tip aspirates the master mix and dispenses it into four wells. Uninterrupted operations between normalization and PCR setup reduced the total process time. Normalization of the DNA samples ensures uniform input of template DNA in the STR amplification (based on the manufacturer's recommended input), increasing the chances of obtaining interpretable STR profiles in the first attempt.
DNA Preparations
DNA from anonymous donor samples was extracted using a standard phenol—chloroform method 17 or the BloodPrep DNA Chemistry and 6100 Nucleic Acid PrepStation (Applied Biosystems, Foster City, CA) following the manufacturer's recommended protocol. 18 Genomic DNA from unknown individuals was obtained from Biochain (Hayward, CA), Sigma Chemical Co. (St. Louis, MO), or Serological Research Institute (Richmond, CA). The samples from commercial sources were used to validate liquid-handling scripts. The anonymous donor samples were used to verify sample tracking (position ID confirmation studies). The quantity of human DNA in the extracts and commercially procured samples was determined by the Quantifiler Human DNA Quantification Kit.
Precision and Reproducibility Studies for Automated qPCR
Precision and reproducibility studies for the Quantifiler setup were performed using one DNA sample (procured from Biochain) at six different concentrations (0.025, 0.05, 0.1, 1.0, 5.0, and 25.0 ng/μL). The sample concentrations were selected to span the quantification range of the Quantifiler standard curve (23 pg/μL—50 ng/μL). Each concentration was quantified in 12 replicates. The source containers used for the DNA samples were 96-well PCR plates or 1.5-mL microfuge tubes. The experiment was performed three different times using the Tecan Freedom EVO 150 and compared with the same experiment where the quantification setup was performed manually. The protocol outlined in the Quantifiler User's Manual 19 was used for both automated and manual qPCR setup. qPCR was performed on the 7500 Real-Time PCR System (Applied Biosystems, Foster City, CA), and the data were analyzed with the 7500 System SDS Software v1.2.3 (Applied Biosystems, Foster City, CA) using a threshold value of 0.2. In some instances, Standard 8, which contained approximately 23 pg/μL of DNA (roughly seven copies of the SRY target), was eliminated in computing the standard curve during the validation of both automated and manual Quantifiler Y Human Male DNA protocols. 18 Because of the haploid nature of the SRY target, greater variation in the C T values can be observed, sometimes resulting in the need to eliminate Standard 8 from the standard curve calculations. 15,19
The results for extracted DNA samples in the tube source containers are summarized in Figure 1. As expected, the variation in the quantification was greater for samples with lower DNA concentrations because of stochastic effects. Similar results were obtained when plate was used as the source container for the extracted DNA sample (data not shown). The range of variation in the quantification results at all tested concentrations of DNA using the HID EVOlution System and the manual protocol was similar (data not shown). The standard deviation values for the automated protocol and the manual protocol for all tested DNA concentrations were comparable, with the exception of the sample containing 25 ng/μL DNA (Table 1). The standard deviation value for the quantification of the sample containing 25 ng/μL of DNA ranged between 0.701 and 2.538. A precision study for the Quantifiler Y Human Male DNA Quantification Kit was also performed. The standard deviation values for the quantification of male DNA in tube source containers for samples containing 0.025, 0.05, 0.1, 1.0, 5.0, and 25.0 ng/μL of DNA were 0.014, 0.024, 0.019, 0.080, 0.242, and 0.8, respectively.
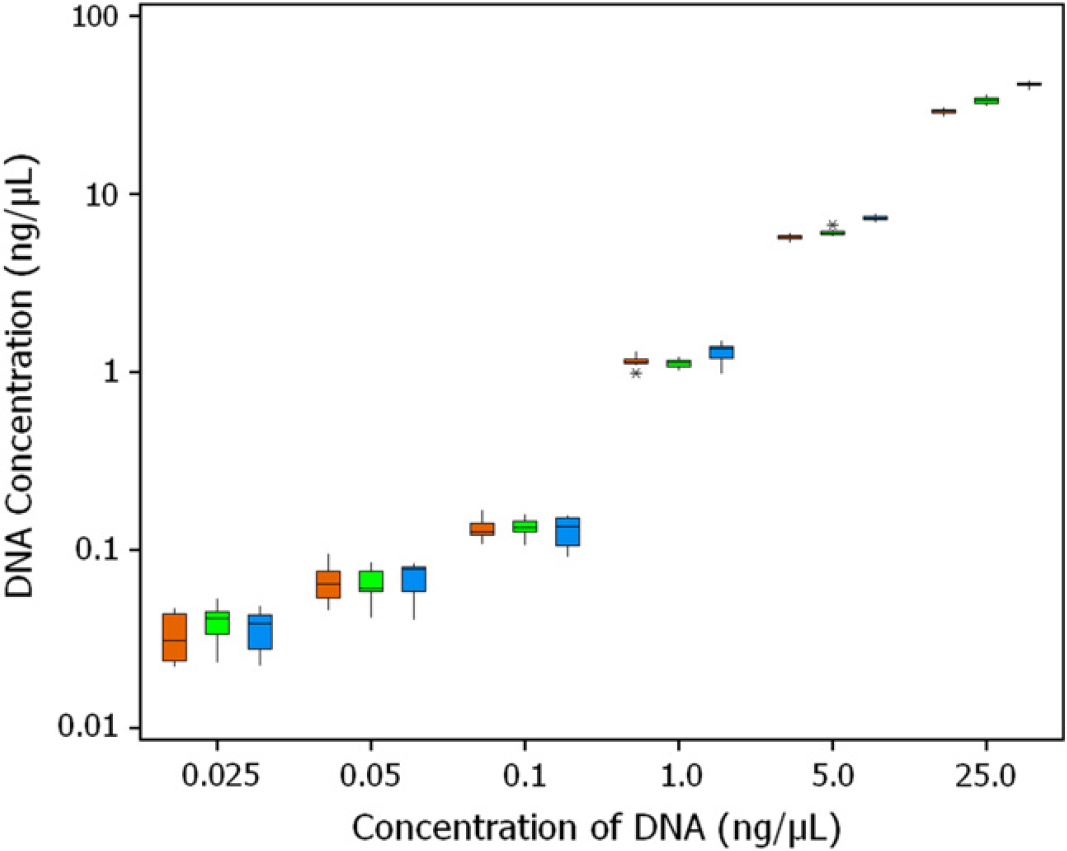
Box plot for the precision and reproducibility studies of the Quantifiler Human DNA Quantification Kit. y-Axis represents determined quantities and x-axis represents input quantities of DNA. Samples containing 0.025, 0.05, 0.1, 1.0, 5.0, and 25.0 ng/μL of DNA were quantified in 12 replicates (n = 12) for three runs using tubes as source containers. Brown box, run 1; green box, run 2; and blue box, run 3. The box represents inter-quartile range of the data points, the bar within the box represents median data point, lower whisker extends to the lowest data value within the lower limit, upper whisker extends to the highest data value within the upper limit, and asterisks are outliers.
Standard deviation values for the Quantifier Human DNA Quantification Kit obtained from precision and reproducibility studies
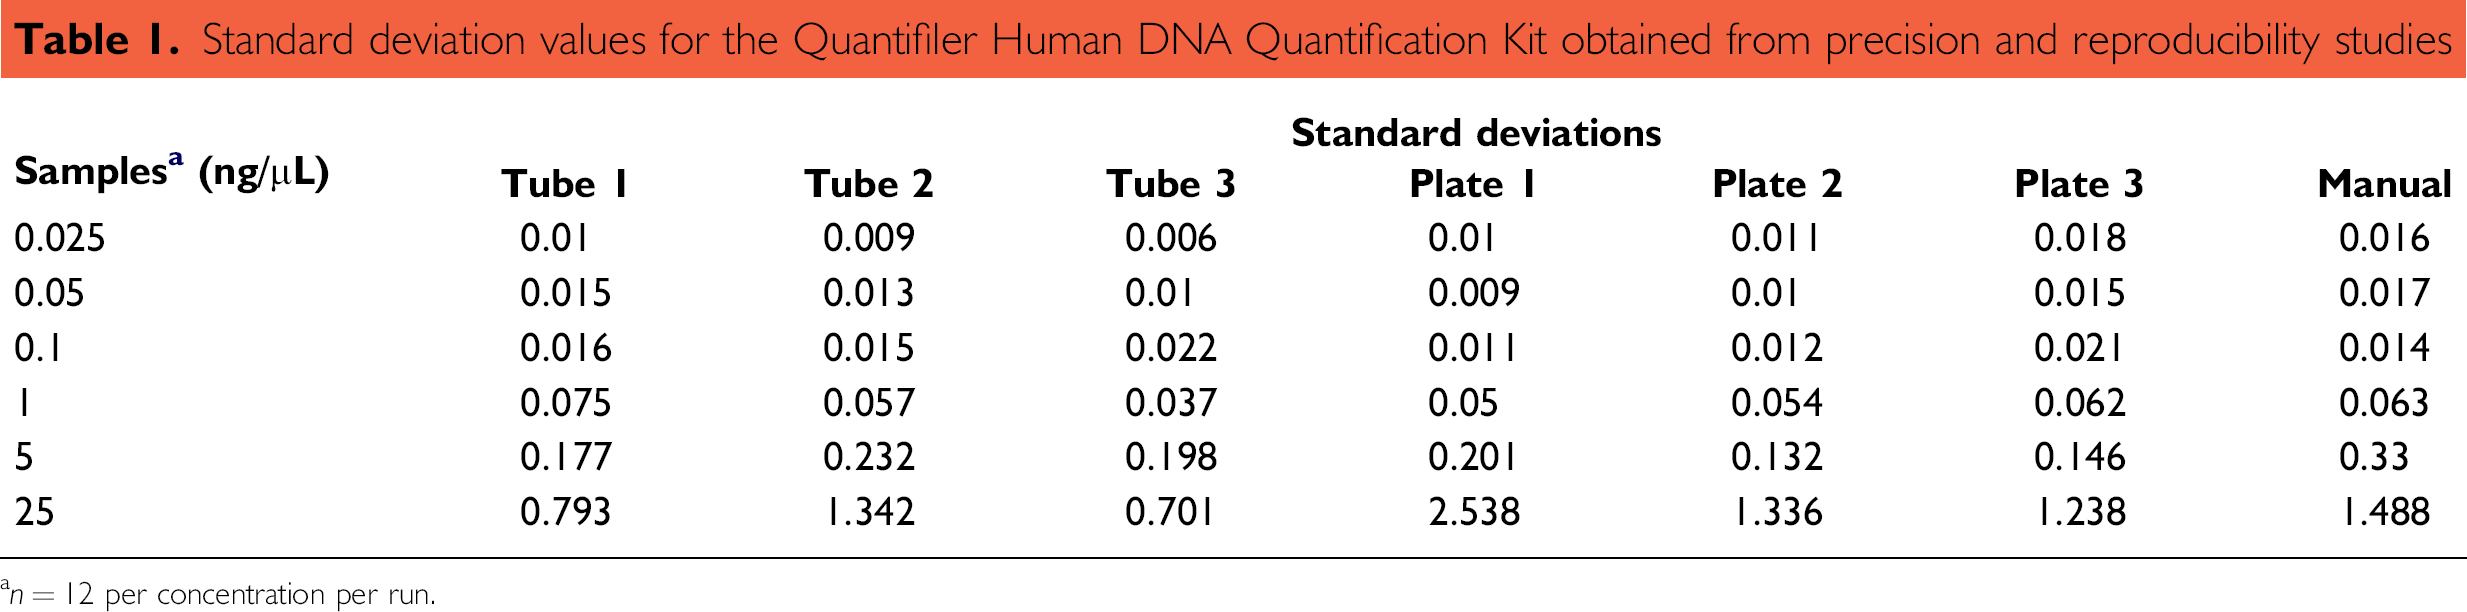
a n = 12 per concentration per run.
Reproducibility of Standard Curves for Quantifiler Kits
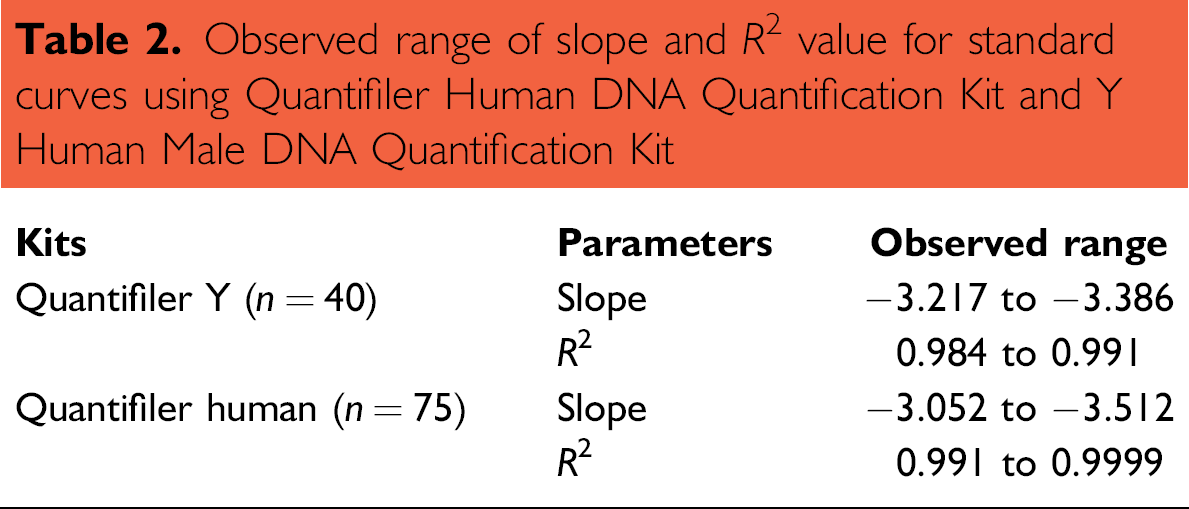
To evaluate the ability of the HID EVOlution System to reproducibly and precisely prepare a standard curve dilution series during qPCR setup, eight plates were prepared using the Quantifiler Human and Quantifiler Y Human Male DNA Quantification kits. On each 96-well plate, five sets of standard dilutions were set up by the instrument and run for real-time PCR, using the DNA standard provided by the kit being evaluated. A total of 75 and 40 standard curves were run for Quantifiler Human DNA Quantification Kit and Quantifiler Y Human Male DNA Quantification Kit, respectively, on different times and days. The range of slope and R 2 values observed are summarized in Table 2. A slope value of −3.32 represents 100% efficiency of PCR. A slope range of −3.0 to −3.6 has been observed with the Taq-Man assays. 20 The slope values for standard curves observed in this study fall within this range. A slope range of −2.9 to −3.3 was observed during the developmental validation of the Quantifiler Human DNA Quantification Kit manual operations. 19
Observed range of slope and R 2 value for standard curves using Quantifier Human DNA Quantification Kit and Y Human Male DNA Quantification Kit
Precision and Reproducibility Studies for Automated ampFℓSTR PCR Amplification Setup
Automated protocols for PCR amplification setup using AmpFℓSTR Kits were verified for functionality, precision, and reproducibility. These studies were performed using samples containing 0.025, 0.1, 0.5, 1, 2, 5, 10, and 50 ng/μL of DNA quantified with the HID EVOlution System using the Quantifiler Human DNA Quantification Kit. In general, multiplex amplification PCR is performed using either 25- or 50-μL reaction volumes. For ease of optimizing liquid-handling parameters, the AmpFℓSTR Kits were grouped into two groups based on the PCR reaction volume: (1) 25 μL for Identifiler, Yfiler, and MiniFiler kits, and (2) 50 μL for SGM Plus, Profiler Plus, COfiler, and SEfiler kits. Liquid-handling scripts for all 25-μL PCR reaction volumes were identical. Also, the scripts for all 50-μL PCR reaction volumes were identical.
The DNA samples with concentration greater than 0.1 ng/μL were diluted to a target concentration of 0.1 ng/μL by the HID EVOlution System before PCR STR reaction setup with the AmpFℓSTR Identifier and Yfiler PCR Amplification kits; 0.05 ng/μL L for the MiniFiler Kit; and 0.2 ng/μL for SGM Plus, Profiler Plus, COfiler, and SEfiler kits. The parameters used to define the dilution ratio of a sample were concentration in ng/μL (CONC), volume of (diluted) DNA in an STR PCR (10 or 20 μL [VOL]), target amount of DNA in ng in an STR PCR (AMOUNT), and dilution ratio (DIL), for example, a DIL of 1.548 represents a ratio of 1:1.548 of DNA sample:diluent. The required dilution was then calculated with the following formula:

Dilutions are performed by the HID EVOlution System either in a one-step or in two steps depending on the DNA concentration in the sample. Those samples requiring a 1:1–1:20 dilution were prepared in a one-step dilution. DNA concentrations requiring more than 1:20 dilutions were prepared using a two-step dilution. A minimum of 2 μL of DNA extract was used for both one- and two-step dilutions. Dilutions are prepared in a predilution 96-well reaction plates. To cover a dynamic range of possible dilutions (from 1:1 to 1:4000 for 25-μL total reaction volume and 1:1 to 1:8000 for 50-μL total reaction volume), different volumes of TE buffer and DNA extract are used in the predilution steps. Samples with a DNA concentration less than 0.1 ng/μL and controls are transferred to the PCR reaction plate using the direct transfer (no normalization is performed).
In this study, samples containing 0.025, 0.1, 0.5, 1.0, 2.0, 5.0, 10.0, and 50.0 ng/μL of DNA were run in 11 replicates, enabling the evaluation of the direct sample transfer PCR amplification setup, the one-step dilution and PCR amplification setup, and the two-step dilution and PCR amplification setup. The experiment was repeated three times for extracted DNA in tubes and three additional times in a 96-well plate.
Liquid-handling scripts for automated STR setup were developed based on the procedure described in the user's manual for the respective kit. 21 27 First, the master mix was prepared and dispensed (15 μL for 25-μL PCR kits and 30 μL for 50-μL PCR kits) into a 96-well PCR plate. Based on the quantification results, the HID EVOlution System identified those samples requiring normalization; normalization was performed, the normalized and direct transfer DNA samples (10 μL for 25-μL kits and 20 μL for 50-μL kits) were pipetted into the PCR plate, and the components were mixed. The quantity of DNA template in the PCR was 0.5 ng for MiniFiler; 1.0 ng for Identifiler and Yfiler; and 2.0 ng for SGM Plus, Profiler Plus, COfiler, and SEfiler kits. The PCR was performed on the GeneAmp PCR System 9700, the amplified products were analyzed on 3130xl Genetic Analyzer, and the data were analyzed using GeneMapper ID Software v3.2.1 (all from Applied Biosystems, Foster City, CA).
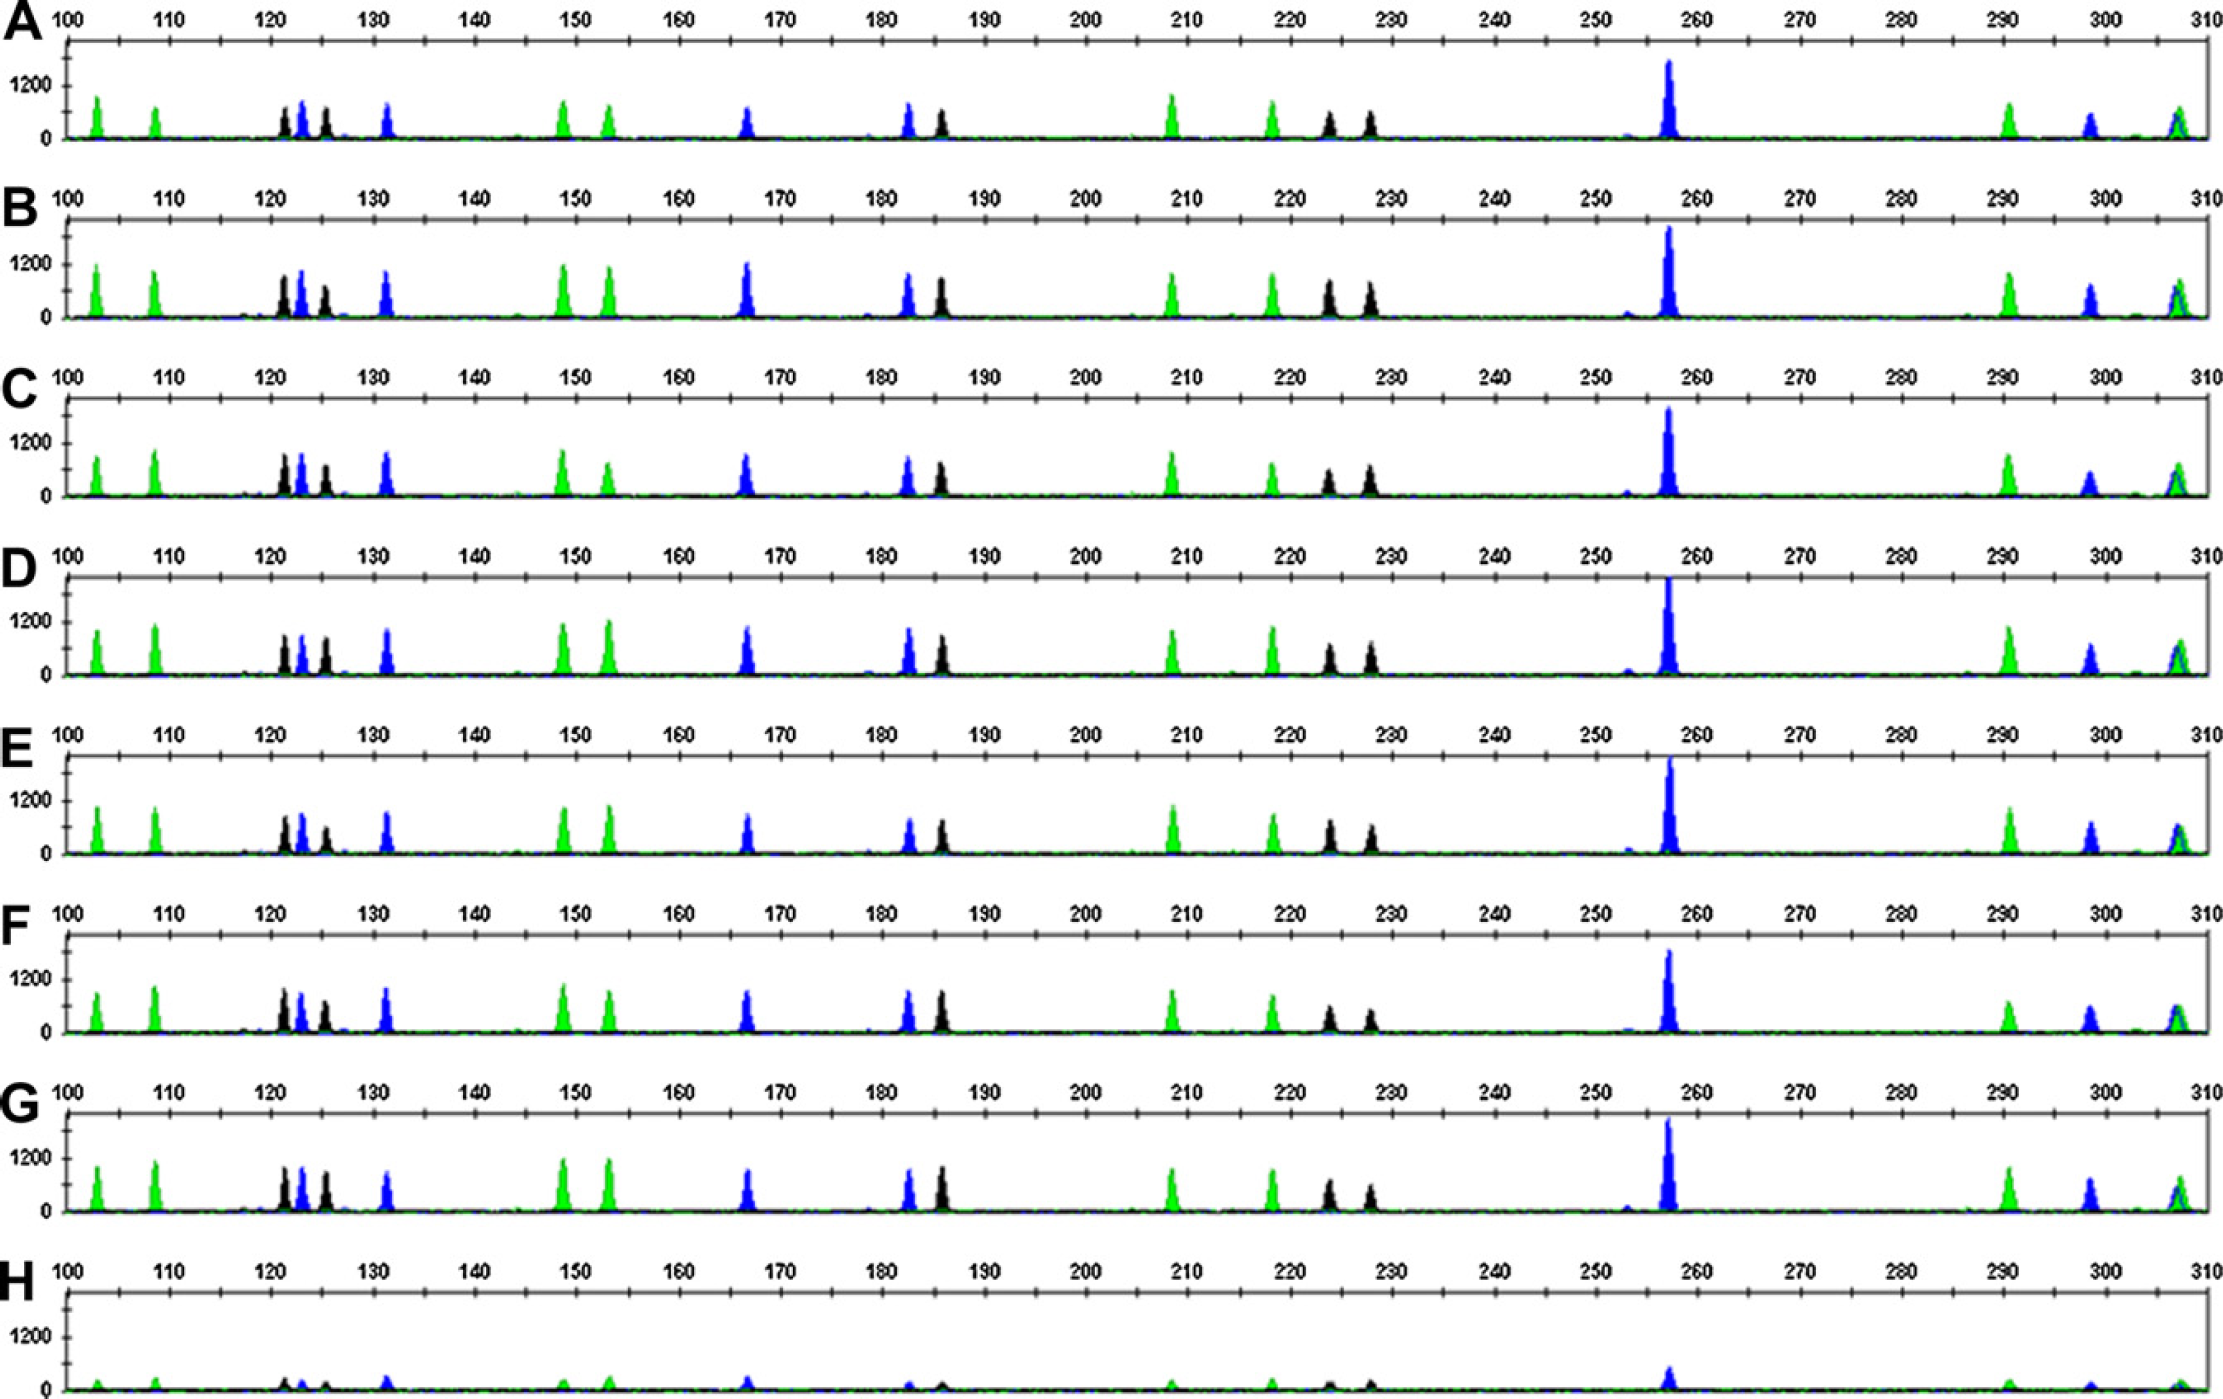
Identifiler STR profiles of the DNA samples at different concentrations are presented in Figure 2. The average peak heights of the alleles from the sample containing >0.1 ng/μL of DNA that required normalization (one- or two-step dilution) were similar to the peak heights for the sample containing 0.1 ng/μL of DNA, which did not get normalized. Thus, the normalization of all samples containing >0.1 ng/μL of DNA to the target concentration of 0.1 ng/μL was achieved. As expected, the samples containing 0.025 ng/μL of DNA exhibited STR profiles with lower peak heights; for these samples, 10 μL of the DNA sample containing 0.25 ng of DNA was amplified. This quantity of template DNA is less than the recommended 1.0-ng input amount. The average peak heights among all replicates from three runs for both plates and tubes as DNA sample source containers are summarized in Figure 3. The variation in the peak height was similar when the normalization and PCR setup were performed either in plate or in tube as source containers and were compared with the results from manual setup (data not shown).
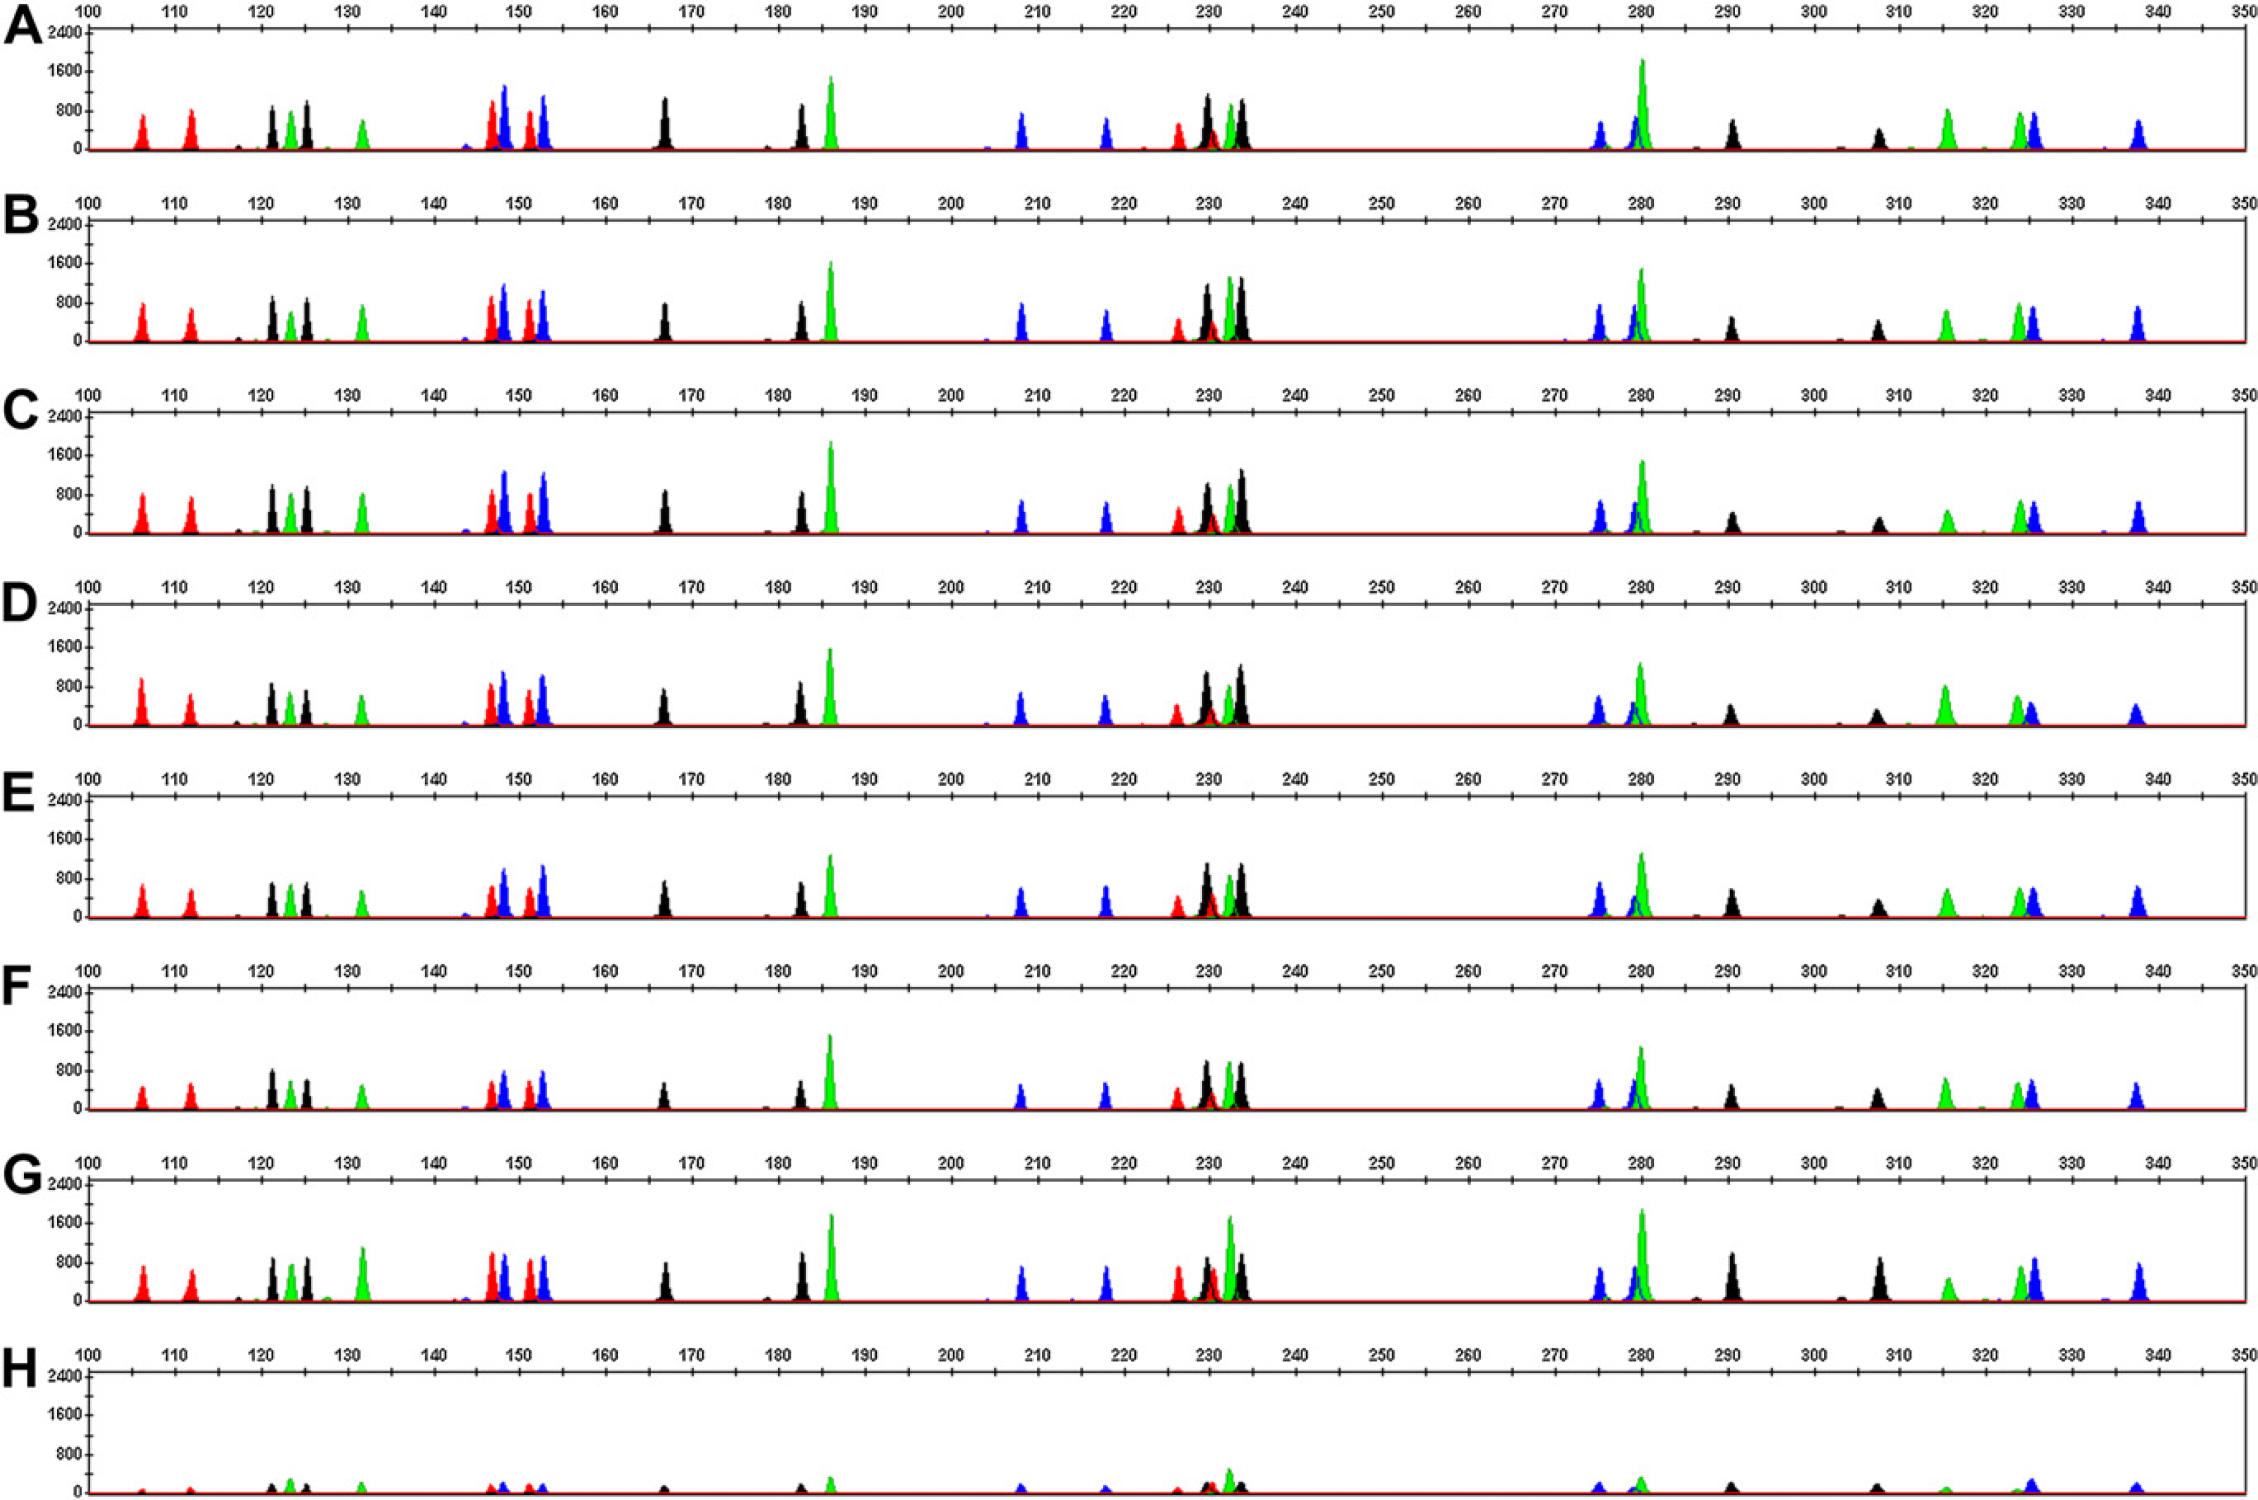
Identifiler electropherograms for DNA samples at indicated DNA concentrations. y-Axis represents relative fluorescence unit values and x-axis represents size estimates of the fragments in bases. Panel A, 50 ng/μL; panel B, 10 ng/μL; panel C, 5 ng/μL; panel D, 2 ng/μL; panel E, 1 ng/μL; panel F, 0.5 ng/μL; panel G, 0.1 ng/μ; and panel H, 0.025 ng/μL.
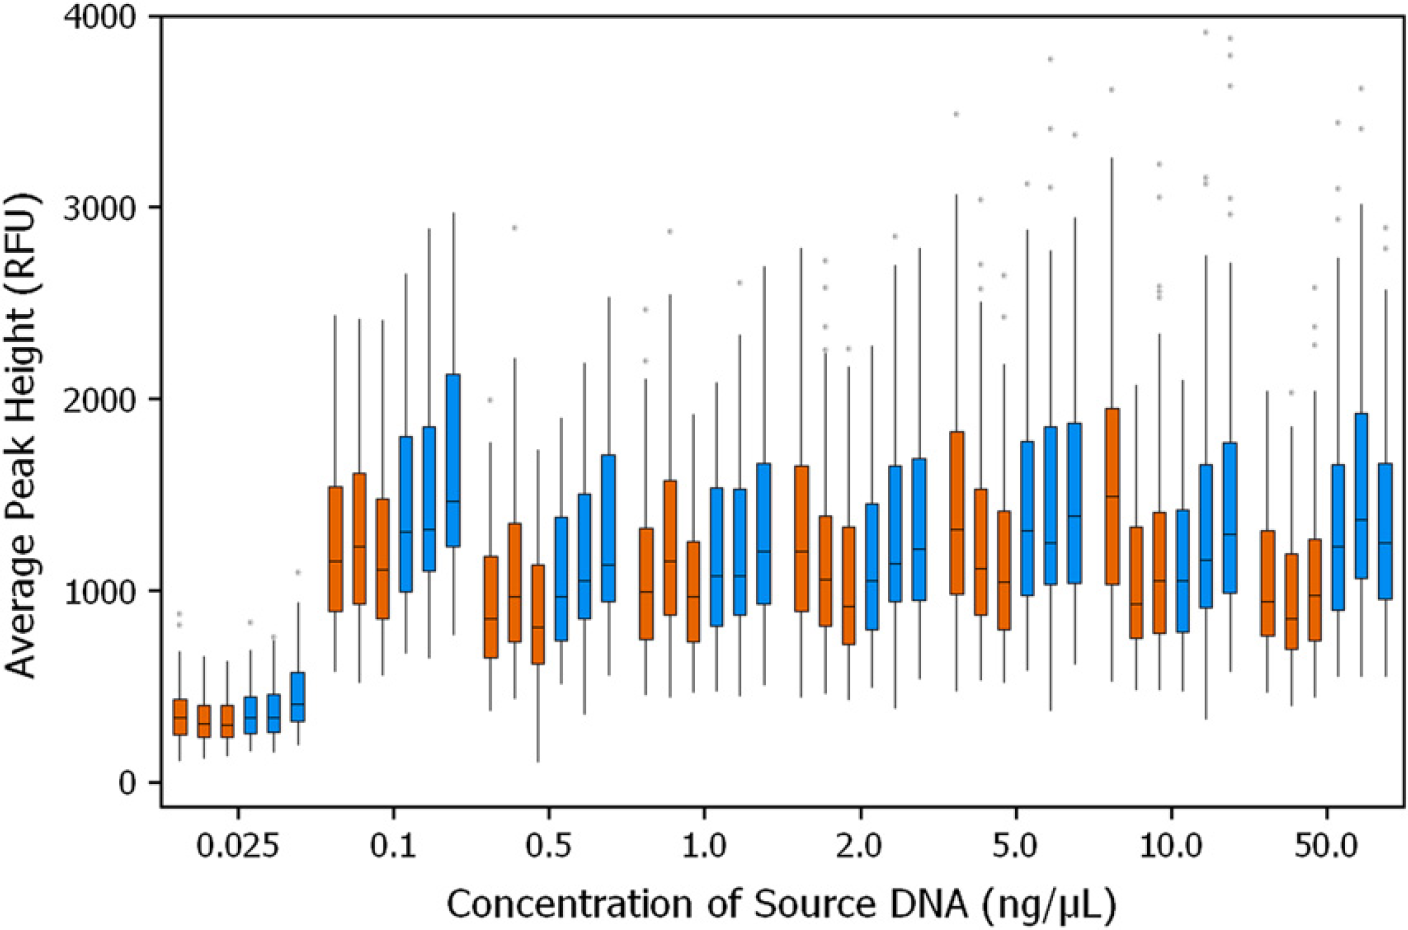
Identifiler reproducibility study. Box plot for average peak height distribution of alleles is presented. DNA samples were in either plates (brown) or tubes (blue) as source containers. Studies were carried out in three days. The samples were run in 11 replicates; total number of alleles in each data set was 171. RFU, relative fluorescence units.
Figure 4 presents the SGM Plus STR profiles for samples at different concentrations. As expected, the peak heights of the alleles in the STR profiles for samples containing >0.1 ng/μL of DNA were similar to those for samples containing 0.1 ng/μL of DNA. Thus, acceptable normalization of all samples containing >0.1 ng/μL of DNA to the target concentration of 0.1 ng/μL was achieved. As expected, the samples containing 0.025 ng/μL of DNA exhibited STR profiles with lower peak heights. Average peak heights among all replicates; data from three runs for both plates and tubes as DNA sample source containers are summarized in Figure 5. Similar variation in peak heights was observed when the normalization and PCR setup were performed either in plate or in tubes as source containers at different times. Also, the peak height variation from the robotic operations correlated well with those observed for samples prepared manually (data not shown).
SGM Plus electropherograms for DNA samples at indicated DNA concentrations. y-Axis represents relative fluorescence units values and x-axis represents size estimates of the fragments in bases. Panel A, 50 ng/μL; panel B, 10 ng/μL; panel C, 5 ng/μL; panel D, 2 ng/μL; panel E, 1 ng/μL; panel F, 0.5 ng/μL; panel G, 0.1 ng/μ; and panel H, 0.025 ng/μL.
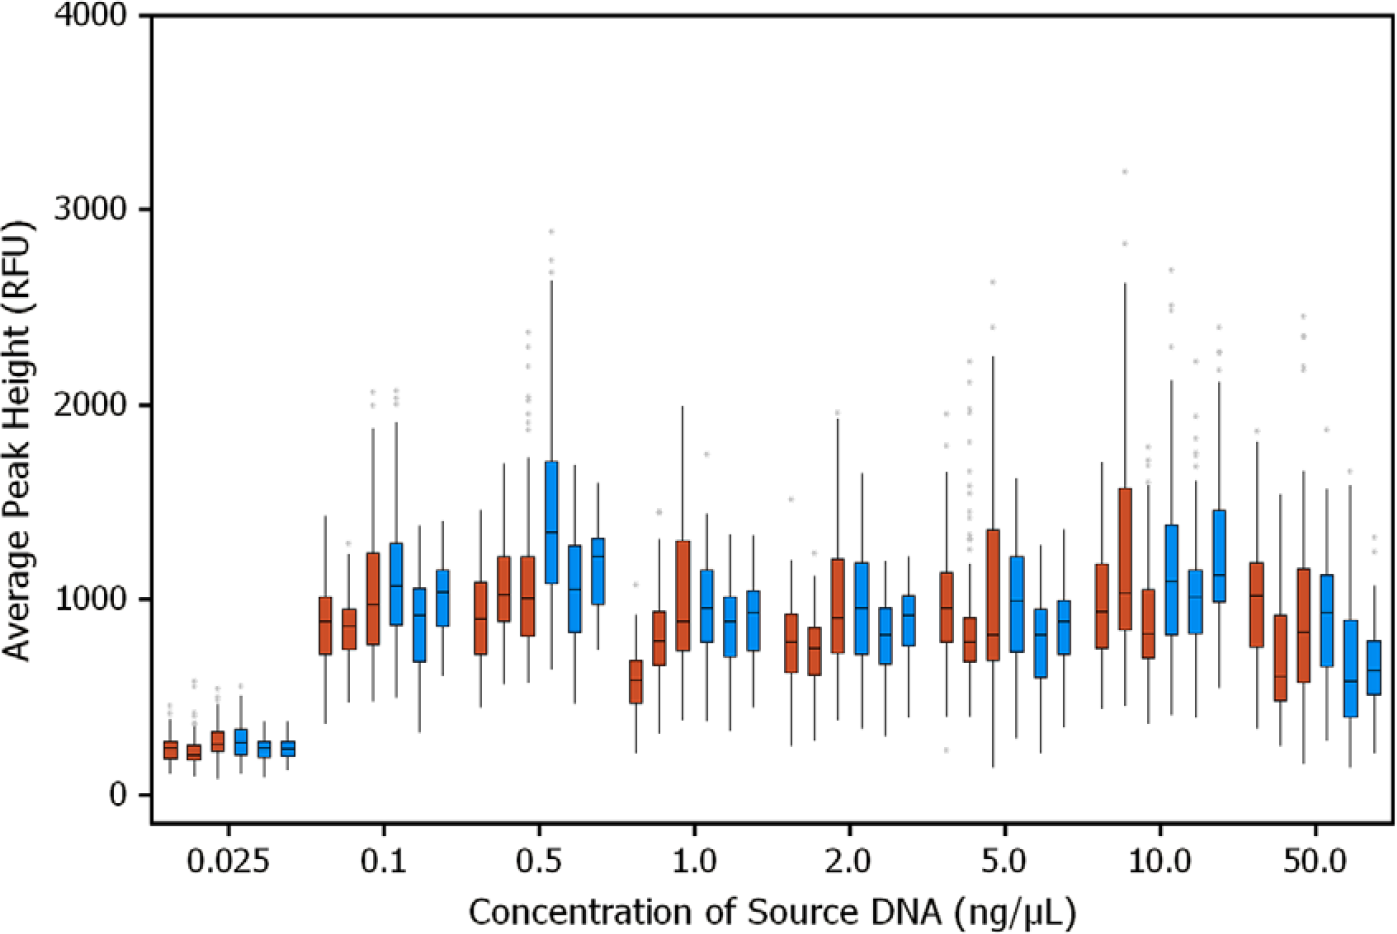
SGM Plus reproducibility study. Box plot for average peak height distribution of alleles is presented. DNA samples were in either plates (brown) or tubes (blue) as source containers. Studies were carried out in three days. The samples were run in 11 replicates; total number of alleles in each data set was 121. RFU, relative fluorescence units.
The precision studies for other AmpFℓSTR kits were run using both plate and tubes as source containers. The results, as evaluated by the variation in the peak height among 11 replicates, were similar to those observed for the Identifiler and SGM Plus kits (data not shown).
Integration of Quantification and STR Analysis
The integrated workflow in the HID EVOlution System comprises several steps: (1) qPCR setup for quantification, (2) generation of a sample setup file for the quantification instrument, (3) importing the quantification results, (4) normalization of samples based on the concentration of human DNA, (5) STR kit-specific PCR reaction setup, (6) generation of a sample setup file for CE of the amplified products, and (7) generation of a report documenting all activities performed in the operation. qPCR was performed on the 7500 Real-Time PCR System, and PCR for STR genotyping was performed on the GeneAmp PCR System 9700. The workflow and operations governed by the HID EVOlution System are presented schematically in Figure 6.
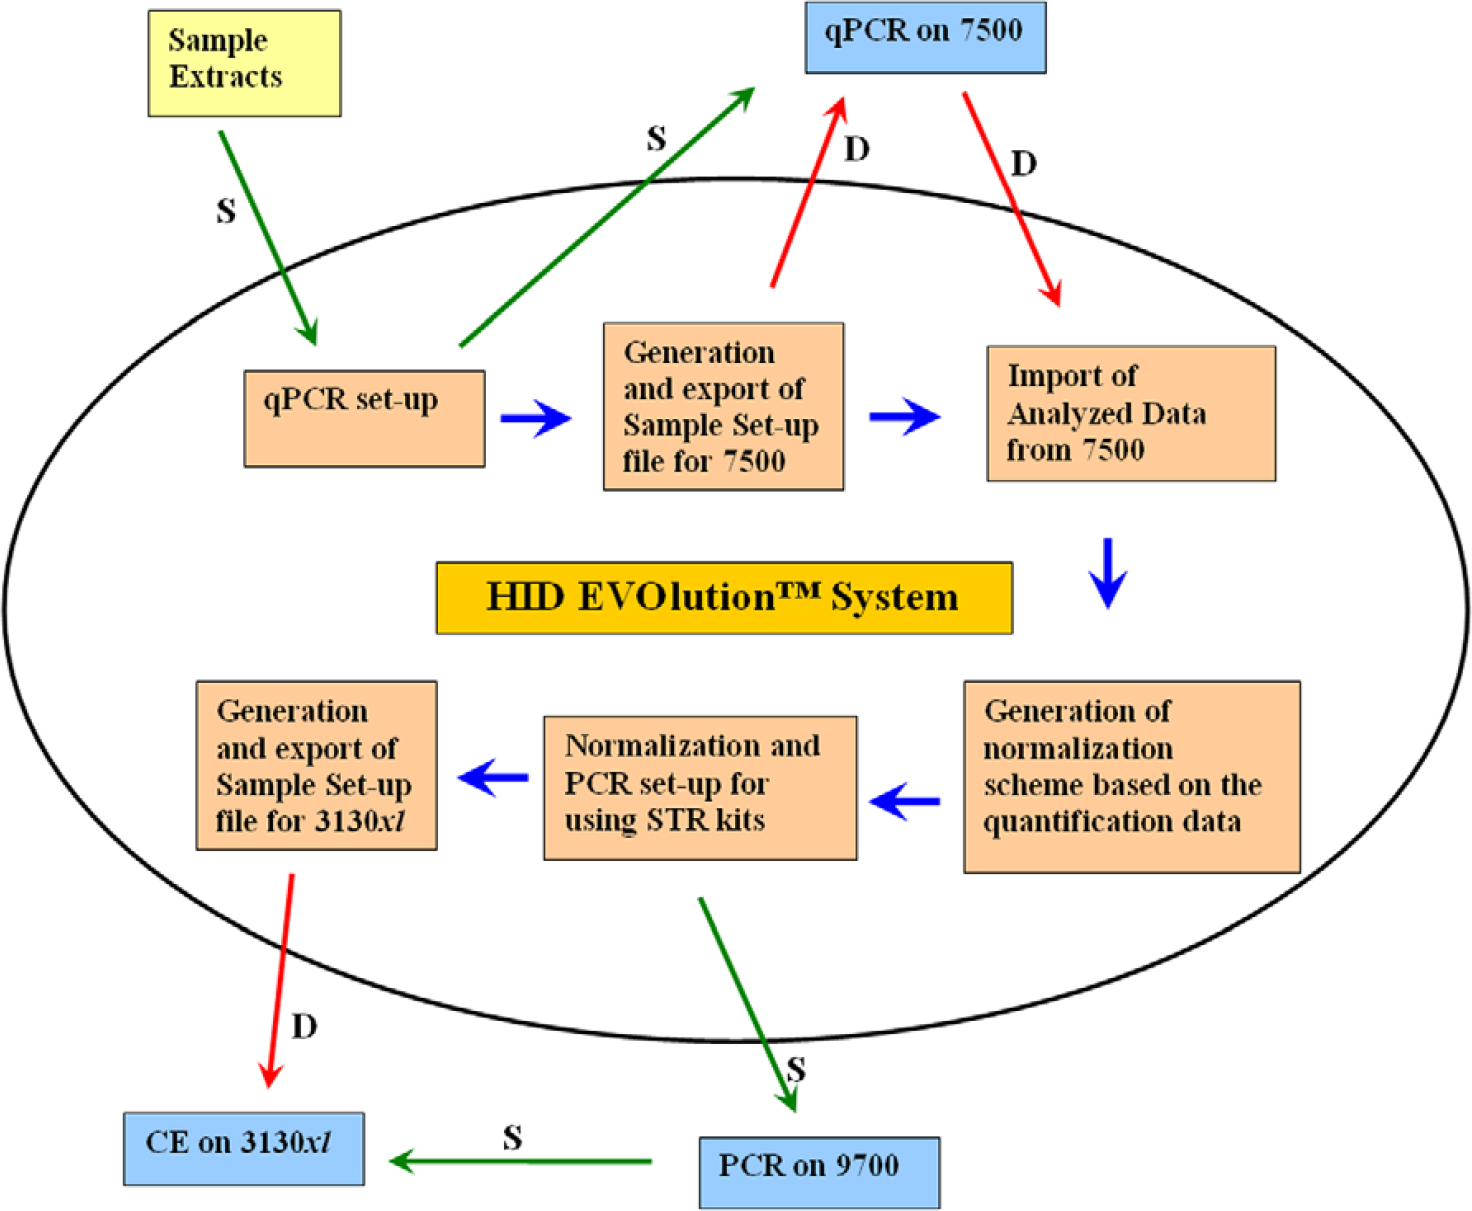
Schematic presentation of the automation and integration workflow governed by the HID EVOlution System. “S” indicates movement of samples and “D” data. Quantitative real-time polymerase chain reaction (qPCR) setup process involves addition of reagents for quantification of human DNA. qPCR on 7500 is real-time PCR on 7500 Real-Time PCR System. PCR on 9700 step achieves amplification of STR loci using GeneAmp PCR System 9700. Capillary electrophoresis on 3130xl enables separation of amplified fragment on 3130xl Genetic Analyzer.
To evaluate the precision of the entire HID EVOlution System workflow, genomic DNA samples with concentrations 0.025, 0.1, 0.5, 1, 2, 5, 10, and 50 ng/μL were quantified in 10 replicates (80 samples in total). The qPCR setup including the preparation of the quantification standards was performed by the HID EVOlution System using the Quantifiler Human DNA Quantification Kit. The output file generated by the HID EVOlution software was used as the sample input file for the 7500 Real-Time PCR System. After qPCR, the samples were diluted and normalized based on the quantification data obtained using SDS software v1.2.3 that was used as the import file for the HID EVOlution software. All samples with concentrations ≤0.1 ng/μL were selected to allow the system to directly add 10 μL of DNA extract to the PCR reaction plate. The samples were then prepared for AmpFℓSTR Identifiler Kit amplification. Electrophoresis instrument files were generated by HID EVOlution System and imported to the 3130xl Genetic Analyzer for use as sample input files for fragmentanalysis. Average peak heights of the alleles for all 10 replicates for each source sample concentration are presented in Figure 7. The variation in the average peak height was very low because each replicate at all concentrations of DNA was normalized based on the quantification value obtained and not based on predetermined DNA concentration values. The intralocus and the intracolor balance for all samples containing ≥0.1 ng/μL of DNA was >60% and >40%, respectively (data not shown).
This study demonstrated that the liquid-handling protocols for automated quantification, normalization, and PCR setup using the HID EVOlution System provided robust and reliable results at a range of DNA concentrations.
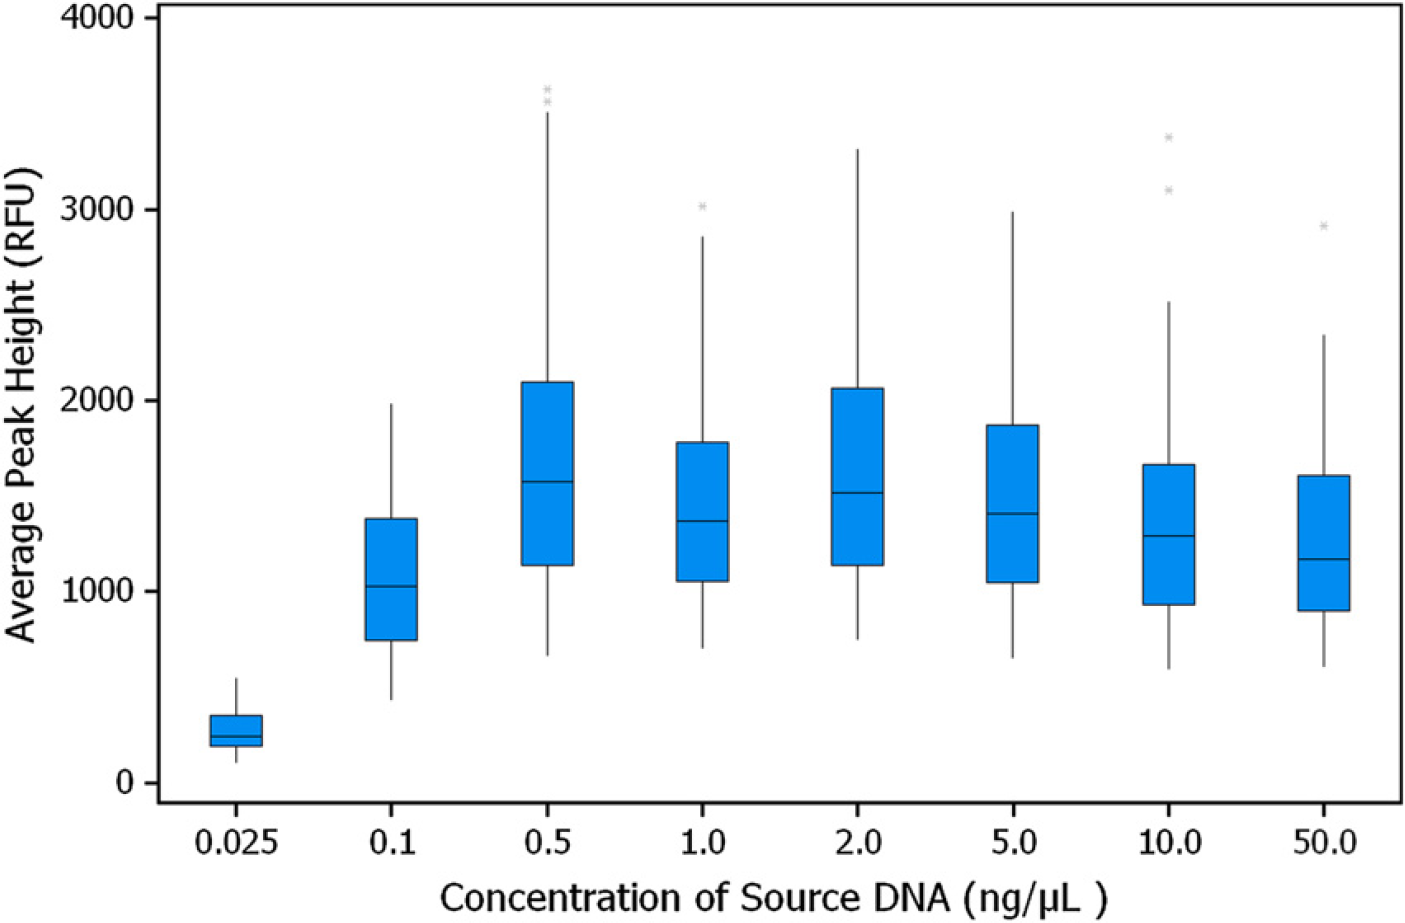
System integration study using Identifiler. Box plot for average peak height distribution of alleles is presented. DNA samples were in tubes as source containers. The samples were run in 10 replicates; total number of alleles in each data set was 176. RFU, relative fluorescence units.
Contamination Study
During automated liquid-handling operations, the samples are transferred multiple times. Thus, it is important to establish that the robotic or laboratory operations do not introduce contamination. The potential for contamination in the automated quantification PCR and STR protocols was evaluated by alternating samples containing 100 μL of 100 ng/μL of DNA and TE buffer in a checkerboard or stripe pattern in 40 replicates on a 96-well plate. The samples were processed for quantification using the Quantifiler Human DNA Quantification Kit and STR analysis using Identifiler and Mini-Filer kits.
All TE wells in the stripe pattern experiment exhibited C T values greater than 40, indicating that there was no cross-contamination during the qPCR setup. Of the 40 wells of TE in the checkerboard plate, one well exhibited a C T value of 38. This sample was amplified using the MiniFiler Kit and showed no STR profile using standard HID analysis methods. The absence of a profile confirmed that the C T value of 38 was a result of stochastic variation in the qPCR and not because of a cross-contamination of the sample during the setup by the instrument. The 80 wells containing TE (40 from each pattern) were evaluated for STR profiles. In this set of studies, none of the TE wells exhibited an STR profile.
Position id Confirmation Study
In processing forensic samples, it is a prerequisite that the integrity of a sample is maintained and the system does not introduce an incidence of sample switch. In the HID EVOlution System, the positions of amplification controls and allelic ladders in the STR amplification plate are predetermined. Thus, the position of a sample in the source plate or tube is different from its position in the STR amplification plate; for example, a sample in position C6 in the source plate will be at a different position in the PCR plate because of insertion of controls and allelic ladders. The movement of the samples during processing is tracked by the HID EVOlution System software. It is critical that this information is reliable to properly process samples. The accuracy of sample tracking was demonstrated by processing 80 previously typed human DNA samples. Samples were quantified using the Quantifiler Human DNA Quantification Kit, normalized, and genotyped using the SGM Plus Kit. The STR profile for each sample was compared with the known profile generated by manual operations. One hundred percent genotype concordance in the STR profiles for all samples was observed. The position ID experiment was also performed using these 80 samples with tubes as source containers and STR profiling using the Identifiler Kit; 100% genotype concordance in the STR profiles for all samples was observed.
The sample information and locations in the HID EVOlution report were compared with the expected location in the quantification and STR PCR plates and the real-time PCR and GeneMapper ID Software results. One hundred percent agreement was observed. Thus, we conclude that the HID EVOlution System software tracks the sample information and position correctly during processing.
Conclusions
The HID EVOlution—qPCR/STR Setup System was developed for the automation and integration of DNA quantification, normalization of DNA concentration, and PCR setup for STR analysis using the Quantifiler DNA Quantification kits and the AmpFℓSTR PCR Amplification kits. The liquid-handling protocols provided robust and reliable results in obtaining interpretable STR profiles from samples containing varying concentrations of DNA. Contamination studies demonstrated clean liquid-handling capabilities. Position ID experiments exhibited 100% genotype concordance demonstrating accurate and reliable sample processing and tracking. Some salient features of the HID EVOlution System include the following: (1) automated qPCR setup including preparation of standards for standard curve sample, (2) quantification data integration from the 7500 Real-Time PCR System for normalization and PCR setup for STR analysis, (3) automated sample normalization and PCR setup reagent tracking, (4) automated generation of instrument setup files for the 7500 Real-Time PCR System and the 3130xl Genetic Analyzer, (5) generation of quantification PCR and STR setup reports, and (6) sample tracking (sample ID, original source position, position in quantification PCR plate, and position in STR PCR plate). The HID EVOlution System, therefore, is a useful tool in the forensic laboratory to reduce hands-on sample handling, minimize the potential for pipetting errors, and improve throughput and processing consistency.
Acknowledgments
The authors thank Tony Mamone and Sonny Young for useful discussions.
Competing Interests Statement: The authors certify that they have no relevant financial interests in this manuscript.