
Abstract
Serological surveillance testing for bovine brucellosis, Enzootic Bovine Leukosis, and Warble fly reaches approximately 1.7 million tests every year in the UK. An automated system was developed to improve the quality of data handling for all three surveys. The objectives were to make improvements in efficiency, sample tracking, and test reporting and to develop an epidemiological database. The developed system of bar-coded samples and test plates processed on automated equipment capable of scanning barcodes and transferring information across a computer network met the data objectives. Consolidating and automating the highly repetitive liquid-handling steps met the cost objectives. To reduce the impact of temporary bottlenecks in the system, a philosophy of ‘islands of automation’ was adopted to maximize the throughput. The creation of this system was driven largely by the need to have in place an effective emergency response capability to handle the serological needs of an outbreak of an acute and highly infectious veterinary disease such as Foot and Mouth Disease (FMD) in the UK.
Introduction
The UK serological testing requirements for the veterinary surveillance programs for bovine brucellosis, 1 Warble Fly 2 (WF), and Enzootic Bovine Leukosis 3 (EBL) present a huge logistical challenge to the organizations involved. Field samples are submitted to the Veterinary Laboratories Agency (VLA), which is then responsible for the delivery of timely and high-quality test results for all three of these annual surveys. For screening alone 4 - 6 the number of tests required is approximately 1.7 million per year. This breaks down to approximately 1 million tests for brucellosis, 0.5 million for EBL, and 0.2 million for WF. Samples are submitted for brucellosis testing and brucellosis results must be reported against each specific submission. These samples can then be used at random for EBL and WF testing where results are reported on a monthly and yearly basis with the exception of positive confirmatory results, which are reported immediately. This reduces the sampling requirement to only 1 million cattle. The VLA also performs confirmatory serological tests on samples positive for the screening tests. These tests are more complex and costly to perform per sample and are less suited to automation, but they have superior diagnostic qualities.
Each survey is conducted using an indirect Enzyme-linked Immunosorbent Assay (ELISA) screening assay followed by a variety of confirmatory testing methods on the screen positive samples. All three surveillance programs have been conducted for several decades with varying levels of automated liquid handling in use for each survey and samples were tested in one area and then passed to the next. This required frequent reformatting of the field tubes into the 96-well format used for ELISA testing. Each laboratory also had its own manual system for sample tracing and reporting of results.
Although this system has worked successfully in the past, upgrading it—as described below—has been driven primarily by the need to create an efficient high-throughput serological response capacity to an outbreak of acute veterinary diseases. Previous experiences gained by the VLA from serological testing for Foot and Mouth Disease (FMD) during the outbreak in 2001 7 identified areas for improvements in efficiency and data handling. Ensuring a high standard of test traceability, facilitating the swift reporting of results to multiple agents within the government, maintaining a database of results for epidemiological purposes, and responding rapidly to test related enquiries were all identified as areas where developments would improve customer satisfaction and ultimately disease control.
Testing requirements during the time of the FMD outbreak were of a magnitude similar to the brucellosis surveillance conducted annually. Developing the brucellosis surveillance testing as a model system for dealing with outbreak serology provides the opportunity for the system to be tested rigorously and for benefits gained to be realized on a regular basis. Rolling out these benefits to the EBL and WF surveys has produced further benefits.
The strategy that developed was based on the use of bar-coded tubes for collection of samples, a Laboratory Information Management System (LIMS) to hold all the sample data, and laboratory equipment communicable with LIMS to provide an automated connection between sample identity and test result. Throughout the project it was essential that the finished system meet the requirements of ISO 17025. 8
The design issues were identified at the start of the project to take into account the following considerations. A robust sample barcode was required to withstand field conditions and sample inactivation in the laboratory. Accurate liquid handling at the test stage (this is complicated by the variable viscosity and volumes of liquid material received) with an efficient method of handling errors was essential. Forward compatibility was required so that the designed protocol could easily be adapted for alternative test protocols. In addition, elimination of bottlenecks in the system to maximize throughput; effective tracking of material transfer between laboratories; efficient sample handling system to limit costs; elimination of sources of human error to improve traceability; effective contingency plans in the event of component failure; and reduction in sample storage requirements were essential.
Materials and Methods
Equipment
Bar-coded tubes for the collection of field samples are produced according to a specification created jointly by the VLA and the State Veterinary Service. The tubes are made of plastic, provide good clot retraction, and retain sufficient vacuum to assist sampling. The tubes are pre–bar-coded in code 128 format so that the barcode runs vertically and wraps around a substantial proportion of the tube leaving a section clear to assess the blood flow during sampling. The label remains fully affixed to the tube after heat inactivation of the tube (and sample) within a waterbath at 60 °C for 1 h should such a procedure be required in the future. The quality of the barcode is of type A or B according to the standards set out in ISO 15417.
The barcode scanner used during sample registration is the Maxiscan 2220 from Intermec which is a benchtop omniscanner.
Four Hamilton Star robots with eight independent liquid-handling channels perform the primary liquid-handling aspects. Disposable tips are used to reduce the possible occurrence of cross contamination between samples using compressed O-ring (CO-RE) expansion for reliable fixing. There is an integrated barcode scanner (Leuze BCL 21) to read each of the barcodes on the deck during the protocol. Data exchange between the Hamilton and LIMS is achieved through swapping Comma Separated Values (CSV) files. Errors in pipetting are identified and recorded using ‘Monitored Air Displacement’; and capacitance technology. Load capacity for each run is high (up to 800 samples) enabling greater operator ‘walk away time’. An additional Hamilton Star robot is used which has, in addition to the specification described above, a fixed 96 probe head (with capacitive liquid-level detection), a CO-RE grip system for handling plates and tip racks, and an integrated 2D tube scanner (2DCYPHER SmartScan from ABgene) as shown in Figure 1.
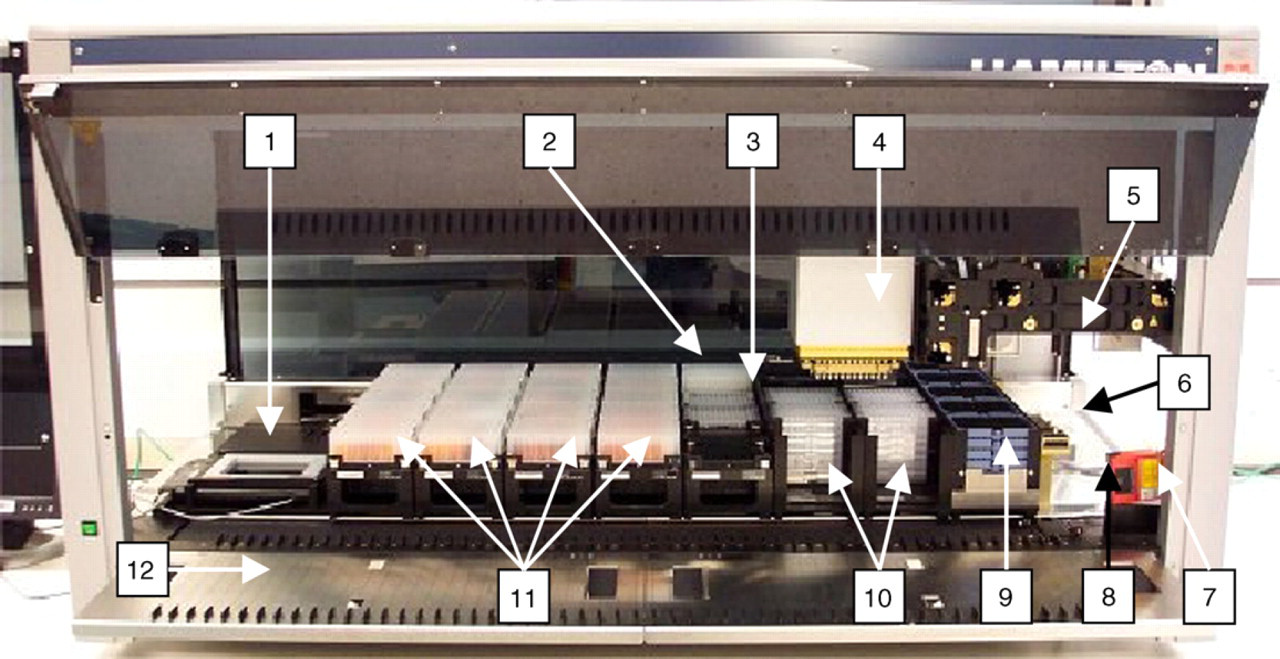
The upgraded Hamilton Star. A photo showing the layout of the upgraded Hamilton at the start of the protocol to add test serum to Brucella test plates and WF predilution plates. (1) 2D tube scanner (not used in this protocol), (2) Brucella test controls in DWP, (3) Brucella and WF test plates on deck ready for serum addition, (4) 96-probe head, (5) two (of eight) independent liquid-handling channels (used with CO-RE grips in this protocol to manipulate plates and tip racks), (6) CO-RE grips, (7) barcode scanner (can twist horizontally to scan test plates and DWPs), (8) waste station, (9) tip racks (stacked four deep), (10) bar-coded Brucella test plates (left) and WF predilution plates (right) stacked eight deep, (11) bar-coded DWPs containing serum, and (12) autoload deck.
The ELISA plate reader is the Multiscan Ascent from Thermo Labsystem. This reads optical densities in a variety of wavelengths as required for each ELISA method.
A Hamilton ‘microlab AT2 plus’ is used for conducting the secondary dilution and the addition of controls for the WF screen ELISA. This robot uses disposable tips for each sample and has a barcode reading capability for matching mother and daughter plates.
In-house barcode production used for labeling Deep Well Plates (DWPs), 2D tube racks, EBL pooled tubes, and test plates is performed using a Zebra Stripe S600 printer with Zebra Bar-One software.
DWPs are produced by Abgene. They are 2.2 mL 96 times format DWPs (Abgene cat No AB-0932).
2D tubes and tube racks are from Abgene. They are 2DCYPHER Mk1 1.2 mL Microtubes (Flat-V) in stackable cluster rack with lockable lid (Abgene cat No. AB-1047).
The individual 2D barcode scanners used in the confirmatory testing laboratories (CTLs) are from Matrix. The Vision-Mate1 is used to read single tubes and the VisionMate96 is used to read racks of 2D tubes.
The individual 1D rack barcode scanners used in the CTLs standard handheld laser scanners such as the Data-logic DLL5010.
The LIMS used is SampleManager 2004 R2 (Thermo Corp) and Oracle Gi database, but this is largely customized at VLA to meet the requirements of this project.
The particular equipment, reagents, and consumables used in each test are frequently different in each test and can be found under references or would be available on request from the laboratory.
System Overview
Figure 2 shows two simplified flow diagrams. The diagram on the left describes, for each sample received, the flow of information into and out of LIMS. The diagram on the right describes the physical processes of sample handling and testing. Specific points within these processes have been numbered and are referred to in a more detailed description in the Detailed Process Description section below.
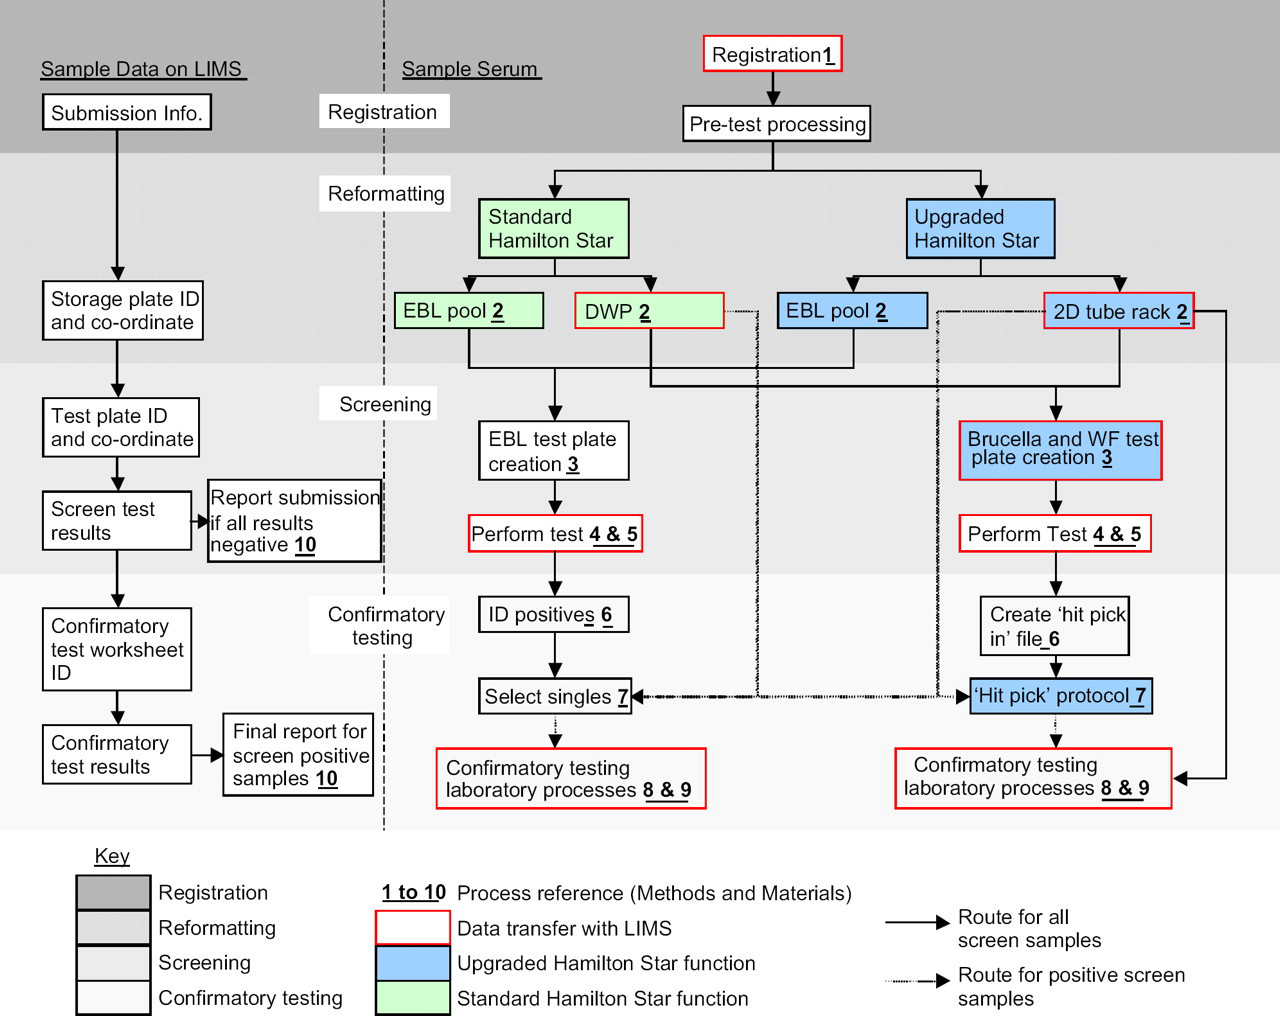
Flow diagram of sample and data handling. The diagram on the left shows the flow of sample-related data into and out of LIMS. The right hand diagram shows the physical processes of sample handling and testing.
These processes have been grouped into four sequential phases to reflect the process occurring. The first is sample registration where details relating to sample are entered into LIMS and the sample is prepared for the next stage. The next stage is reformatting. Dependent on the testing requirements for each sample they are processed either on one of the standard Hamilton Stars or to the upgraded Star, and into either one of three storage formats.
The third stage is 2screening after which the reformatted samples are passed to the appropriate testing laboratory for screening for the required tests.
The final step in this overview is the confirmatory testing stage. This is less automated due to the increased complexity of the confirmatory testing, the lower number of samples tested at this stage, and the subjectivity of some of the tests.
Detailed Process Description
Each step takes place at the points indicated in the left hand side flow diagram in Figure 2.
The samples are received in the laboratory and for each submission a unique submission ID is created on the LIMS, the details for the submission are added against that ID. Each individual tube is logged into LIMS against the specific submission ID by scanning the barcodes. The specific test profiles are automatically assigned based on the submission details.
The samples are then passed on for pretest processing. This is a three-step process. A separate equipment is used to automate bung removal. Blood declotting is performed by hand. Once the clot has been removed and only serum is left, the samples are racked into Hamilton strips which hold 32 samples each.
Most samples in their original field tubes are loaded onto a standard eight-channel Hamilton Star in a 32 times sample rack. Up to 800 samples can be loaded on any one machine at a time. The barcode of each sample is scanned by the Hamilton as it is autoloaded onto the deck. Up to 10 DWPs are also loaded on the robot each time. Each DWP is bar-coded with a unique laboratory assigned incremental number which is scanned by the Hamilton Star as it is autoloaded onto the deck.
The protocol aspirates 950 μL from the field sample tube and dispenses this into the next available well in a DWP. Two outputs are always created, a DWP with serum and a data file listing the barcode ID of each serum that is in each well of a specific bar-coded DWP, which is copied onto the network server with the file named as the DWP ID that can then be individually tested.
A third optional output from this protocol is a pooled EBL serum sample containing 80 separate sera (50 μL of each). This tube is identified with the same barcode as the DWP as it contains the same samples. If this pool proves positive in testing the barcode of the pooled sample identifies the DWP that contains the contributing unpooled samples.
A small percentage of brucellosis surveillance samples require confirmatory testing regardless of the outcome of the screening iELISA because as they are ‘higher risk’ samples where sampling has been targeted due to clinical or epidemiological circumstances. These samples are aliquoted into 2D tubes within bar-coded racks using the upgraded Hamilton Star with the integrated 2D tube scanner. The protocol used is similar to that described above but with an additional scanning action for the 2D tubes. The racks are picked up from the deck by the CO-RE grips and placed on the scanner. This is operated via steps within the Hamilton Star protocol and scans each tube within the rack. The racks are then placed back on the deck. All samples are pooled for EBL testing. For these samples, the data export file also contains the 2D tube barcode IDs as shown in Table 1.
‘Higher risk sample’ export file
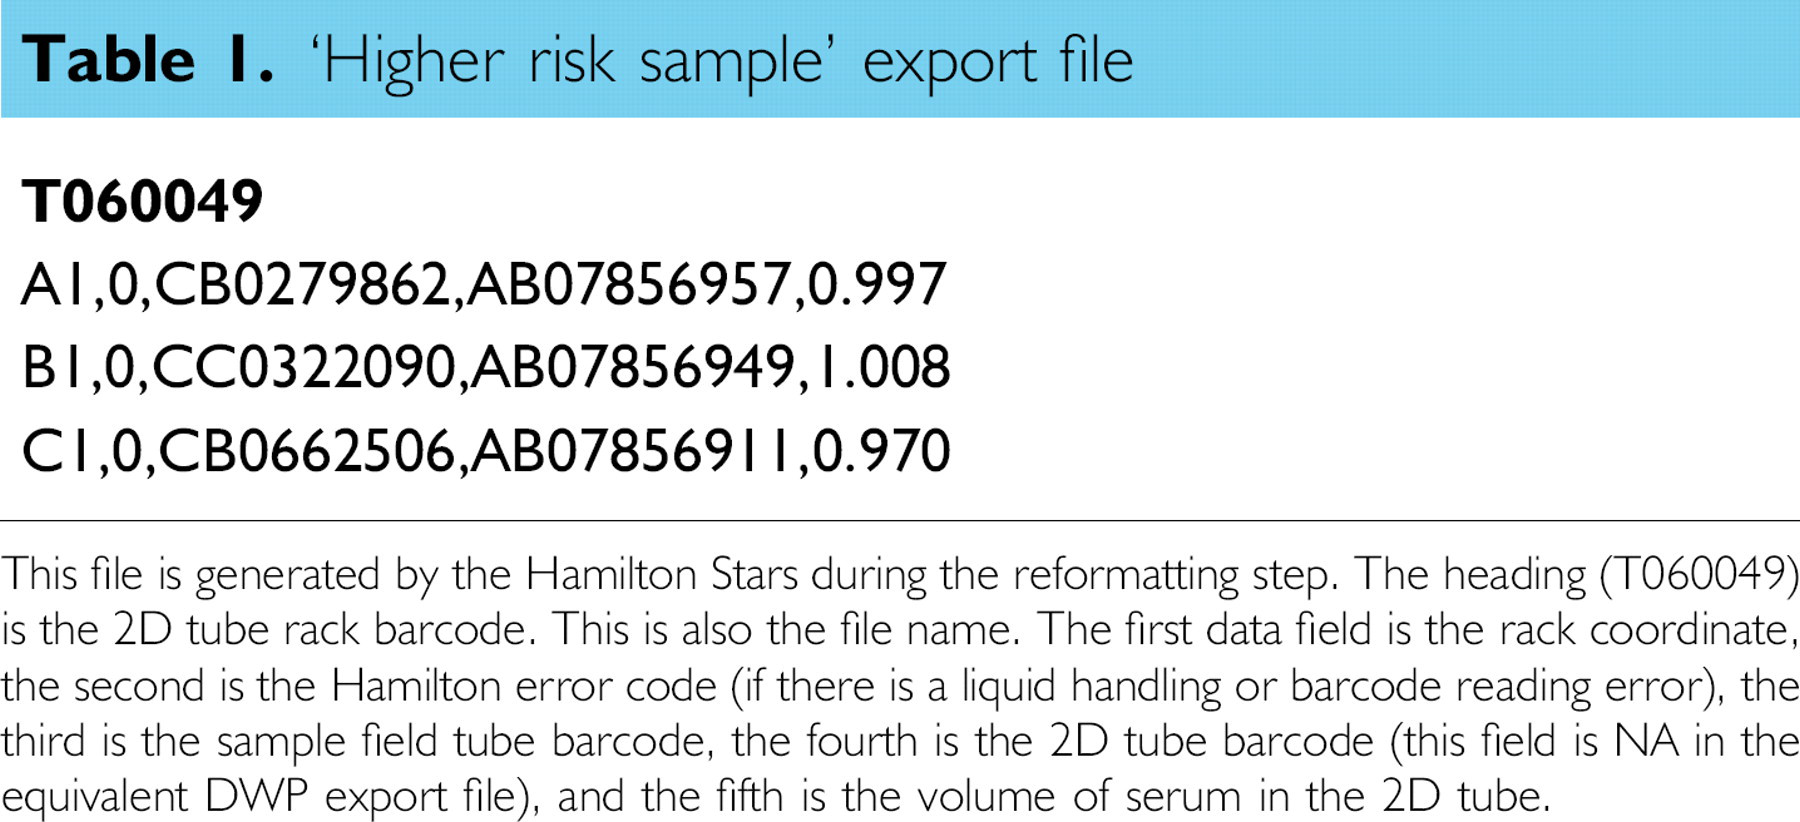
This file is generated by the Hamilton Stars during the reformatting step. The heading (T060049) is the 2D tube rack barcode. This is also the file name. The first data field is the rack coordinate, the second is the Hamilton error code (if there is a liquid handling or barcode reading error), the third is the sample field tube barcode, the fourth is the 2D tube barcode (this field is NA in the equivalent DWP export file), and the fifth is the volume of serum in the 2D tube.
The 96 head then aspirates sera from columns 1–10 of the DPWs/2D tube racks and dispenses this into the Brucella test plate in columns 1–10. This is then repeated into the same columns of a WF predilution plate. The test plates are matched to the DWPs/2D tube racks by a barcode with a common prefix but a different suffix to denote an increment in test plate retest number if required. The Hamilton checks the match of the barcodes during the protocol to ensure that the correct samples are dispensed into the correct plates and that the process remains fully traceable.
During this protocol, the upgraded Hamilton imports the DWP/2D tube rack file created in step 2 from the network using the barcode ID as the link. It uses these data to create a unique test plate file on the network server which holds all the control and sample IDs and coordinates against the barcode ID of the plate.
The WF test plates are further diluted to test dilution using a Hamilton AT processor. This protocol adds the controls and checks to ensure that the mother and daughter plates have a matching barcode identity before proceeding.
EBL pooled samples are added to the test plate manually and traced by hand. Due to pooling, over 7000 samples can be tested on one 96-well plate.
The results for each plate are held on a parser for final manual inspection before being uploaded onto LIMS as approved test results.
The EBL test plates are read by manual operation of an ELISA plate reader and the data pasted into a protected Microsoft Excel spreadsheet that performs the plate validation and result interpretation. The test results are entered into LIMS manually.
Positives are identified manually for EBL testing.
The protocol loads all the DWPs and 2D tube racks onto the deck of the robot, scanning each barcode as it goes. It then picks up the 2D tube racks and places them individually onto the integrated scanner. The Hamilton protocol opens the ‘hit pick in’ file from the network. It then calculates where each sample in that file is on the deck of the robot, the order in which they will be picked out and the next free coordinate of the 2D tube rack that they will be dispensed into. The protocol creates a new network ‘hit pick out’ file for each 2D tube rack named with the barcode ID of the rack. The samples are listed in coordinate order with the appropriate 2D tube barcode ID added to a field next to the sample ID as shown in Table 2.
‘Hit pick out’ file
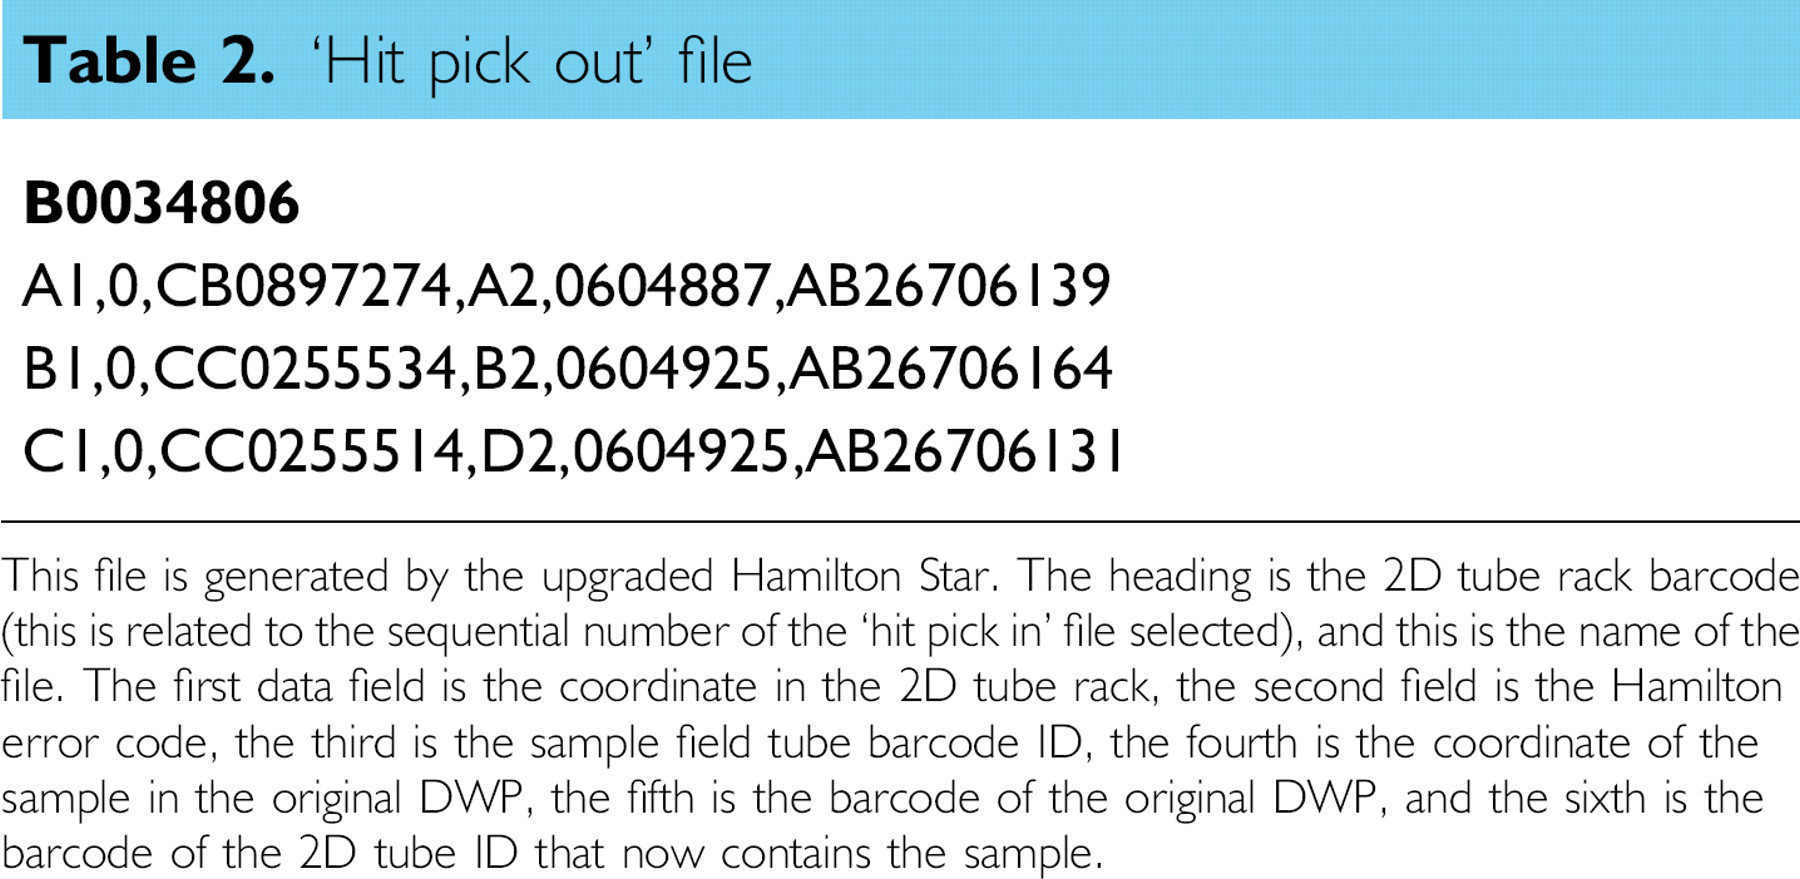
This file is generated by the upgraded Hamilton Star. The heading is the 2D tube rack barcode (this is related to the sequential number of the ‘hit pick in’ file selected), and this is the name of the file. The first data field is the coordinate in the 2D tube rack, the second field is the Hamilton error code, the third is the sample field tube barcode ID, the fourth is the coordinate of the sample in the original DWP, the fifth is the barcode of the original DWP, and the sixth is the barcode of the 2D tube ID that now contains the sample.
Once the Hamilton has scanned all the 2D tube racks and placed them back on the deck it aspirates the positive serum from the particular locations within the DWPs and dispenses them into the appropriate coordinate and 2D tube within the 2D tube rack.
When the 2D tube racks arrive in the CTL, their receipt is confirmed using a customized receipt utility on LIMS. The rack barcodes are scanned and then the 2D tubes are scanned together within the rack. LIMS compares the result of this scan to the content in the ‘hit pick out’ file to ensure that all the samples have been received and that they are in the correct order. If this is not the case, LIMS flags this up, identifies the errors, and the operator must then intervene. The rack, and all the samples in it, can only be electronically received once the scan and the ‘hit pick out’ file match.
Test results are written down on the LIMS-created worksheet and subsequently entered into LIMS manually for test read by eye by recalling the worksheet on LIMS entering the results in the order in which they appear on the worksheet.
Confirmatory tests performed by ELISA are read with ELVIS using bar-coded plates and the ‘hit pick out’ file to match the results to the samples as described previously.
The reports can be printed and posted or faxed, they can be e-mailed, or they can be copied to a shared network destination for customer access. Currently, brucellosis reports are being dispatched in hard copy as per the current customer requirement.
Reports for the WF and EBL are produced monthly and are broken down into geographical regions relating to each UK Animal Health Office. In the rare event that a sample is positive to confirmatory tests, submission-specific results are reported immediately.
The accuracy of the liquid handling is crucial to maintain the quality of the testing. The speed at which the process occurs determines whether throughput targets can be met. The efficiency of the process is essential to ensure that it presents good value. Accurate data transfer from sample registration to test reporting is keystone of the project. The four key elements of the process are described in more detail below and in subsequent sections.
Liquid Handling
The quality of the liquid handling at the test plate creation stage was compared against the quality achieved by hand pipetting. The manual pipettes used in this comparison were all calibrated to meet ISO 17025 standards. The allowable tolerance in the calibrated pipettes is a mean deviance from the specified volume of less than 5% and a coefficient of variation (CV) of less than 5%. The pipettes used had a mean deviance of less than 2% from the target and less than 2.5% CV. Double dilutions, in negative serum, of a Brucella positive sample from neat to 1/128 were performed by hand. The diluted serum was then added to a DWP with eight wells for each dilution. Two dilutions of International Standard Sera were also prepared: the OIEELISASPSS was diluted in negative serum and added to eight wells at 1/16 and to a further eight wells at 1/64 dilutions. These and the working standard Brucella iELISA controls were then added to six test plates, three by hand pipette, and three using the 96-channel head on the upgraded Hamilton Star. All other procedures remained the same for all plates. However, separate preparations of conjugate and substrate had to be used for each group. This was due to different preparation times that were made necessary due to the sharing of serum for both methods.
Throughput
The time taken, and the number of samples processed, for the reformatting and test plate creation steps was recorded.
Efficiency
The time taken to perform the described processes manually was recorded to compare against the automated method as described above and previous methods of automation used. The manual times recorded included administrative tasks that are now handled by the integration of the Hamilton Stars, the Multiscan Ascent plate reader, and LIMS.
Data Transfer
The initial data transfer occurs during the registration process between submission paperwork and LIMS as described above. Subsequent communication between the Hamilton Stars and LIMS occurs through a series of CSV file formats.
Results
Liquid Handling
The results shown in Figure 3 show that both test methods satisfy the criteria defined for the use of the International Standard serum. The International Standard Sera used (OIEELISASPSS) should provide the results as described in the EEC Council Directive 64/432/EEC. 9 These are that the 1/16 dilution should provide a positive test result and the 1/64 dilution a negative result. For both techniques, all 24 wells for each standard dilution were correctly classified. The results for the serial double dilutions of a positive sample show that the results from the two methods were similar. The average difference between the two techniques was 4.4%, the automated technique being higher.
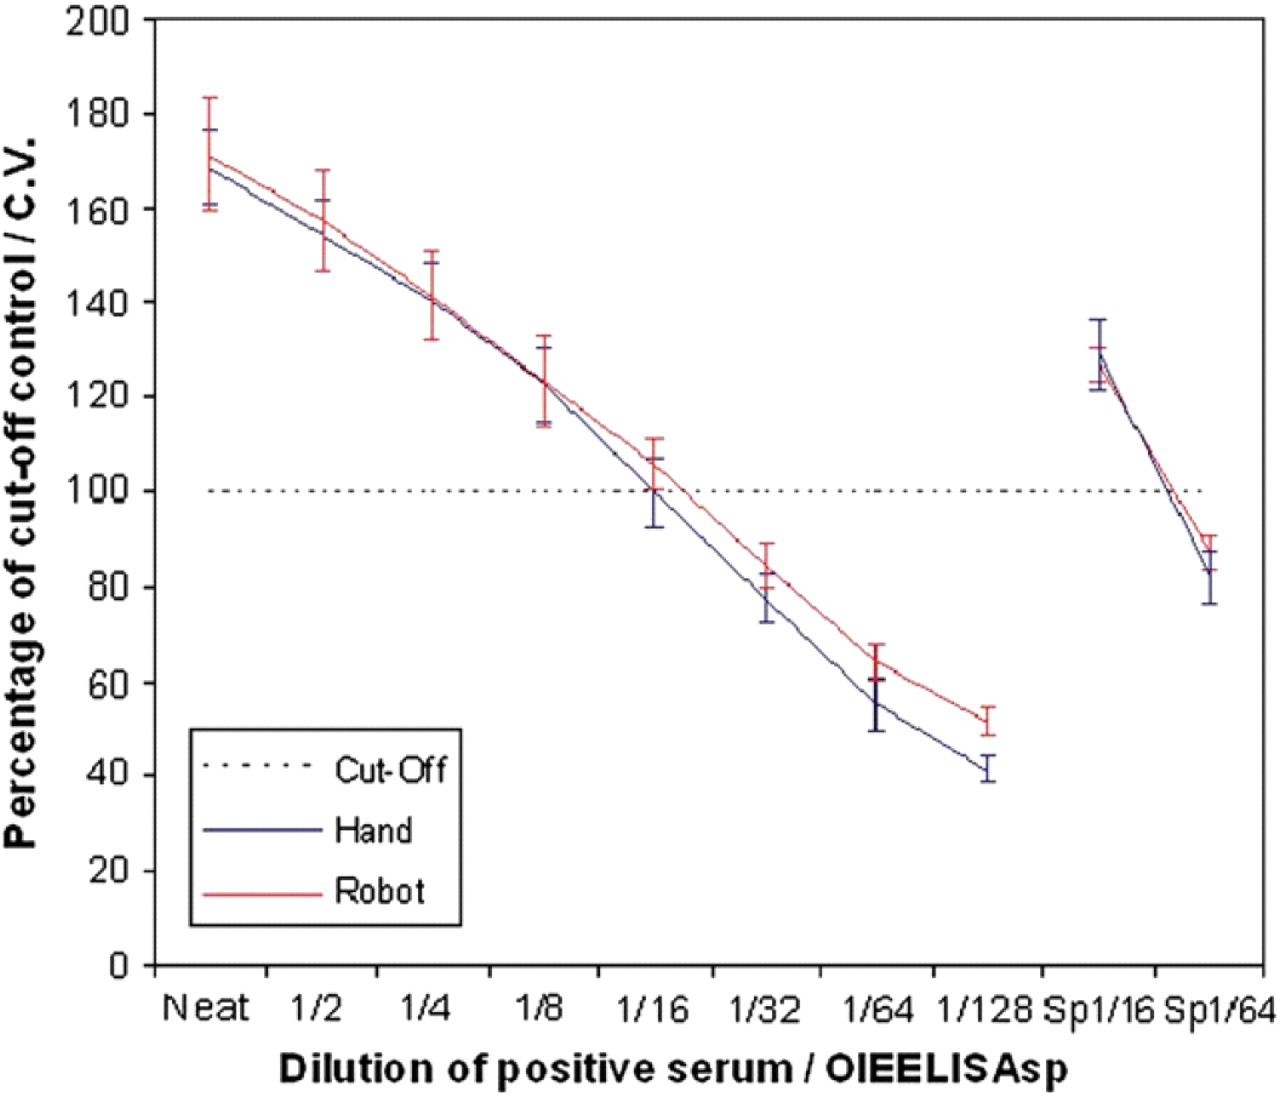
Concordance of serology results for samples tested for Brucella iELISA manually and by the upgraded Hamilton Star. The positive negative cutoff is 100%. Samples greater than this are classified as positive, and those lower as negative.
Throughput
The reformatting of samples into DWPs takes 110 min per 800 samples. With four robots to perform this task, in an 8-h period 14,000 samples can be processed. When the EBL pooling option is selected, this adds a further 75 min per 800 samples to provide a maximum throughput of 8300 samples per 8-h period. These data are presented graphically in Figure 4.
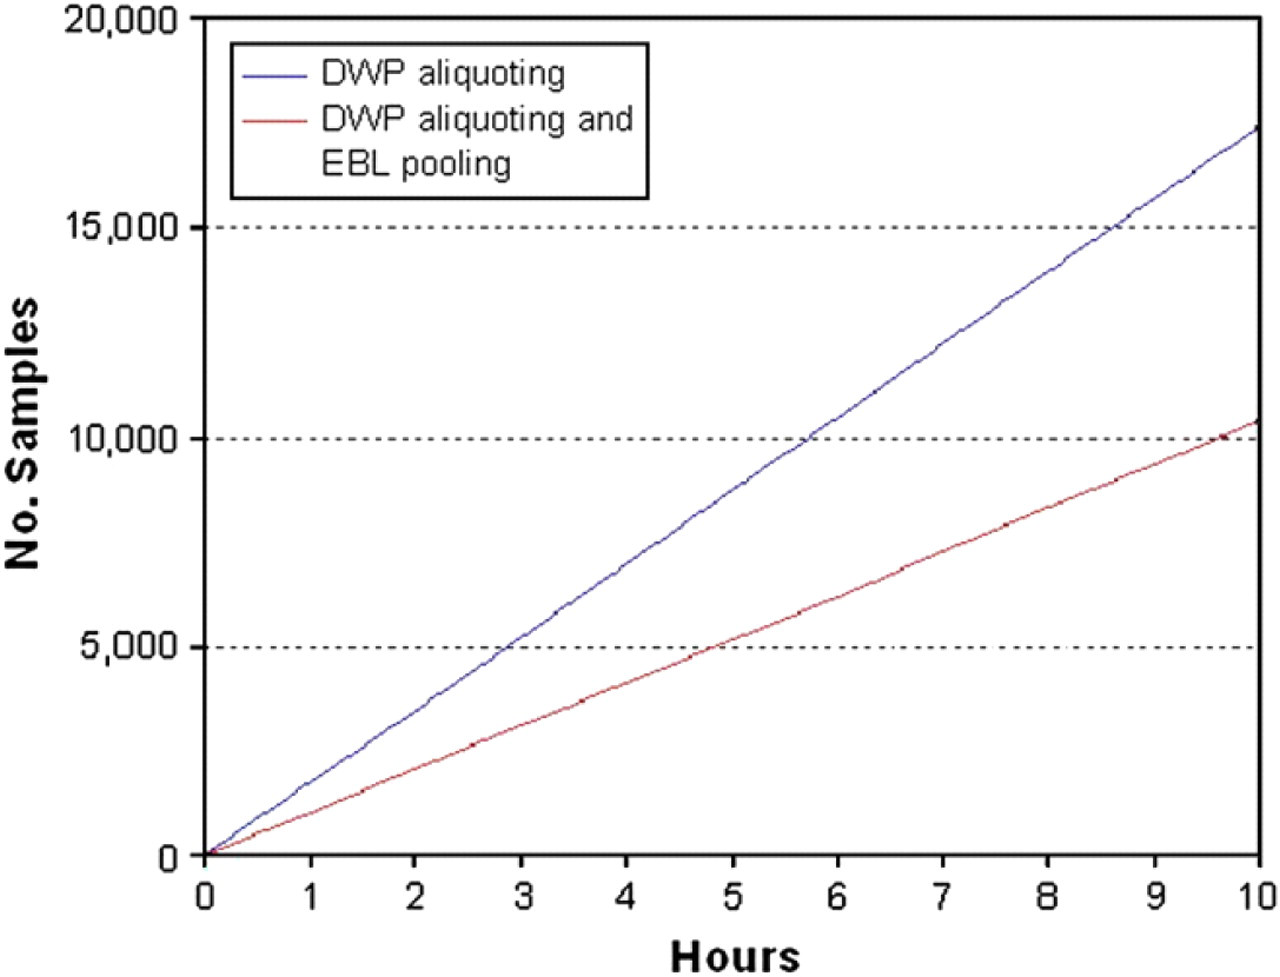
Sample reformatting throughput times. Reformatting is defined as the process of extracting serum from the field tube and dispensing it into a 96 times well format for Brucella and WF testing (DWP aliquoting), with an option to additionally create pools of 80 samples for EBL testing (DWP aliquoting and EBL pooling).
The creation of brucellosis test plates takes 40 min per 20 plates enabling 19,200 samples to be tested in an 8-h period. This excess capacity allows for the upgraded Hamilton to be used for hit picking and the reformatting of the high-risk Brucella samples. When Brucella test plates and WF plates are being created from the same samples during the same run, it takes 50 min to create 20 plates of each type. This gives a throughput figure of 15,360 samples for Brucella per 8-h period. In practice no more than 80 WF predilution plates are created in any one day. This pushes the throughput figure back up to 17,280 samples per day. Figure 5 displays these figures graphically.
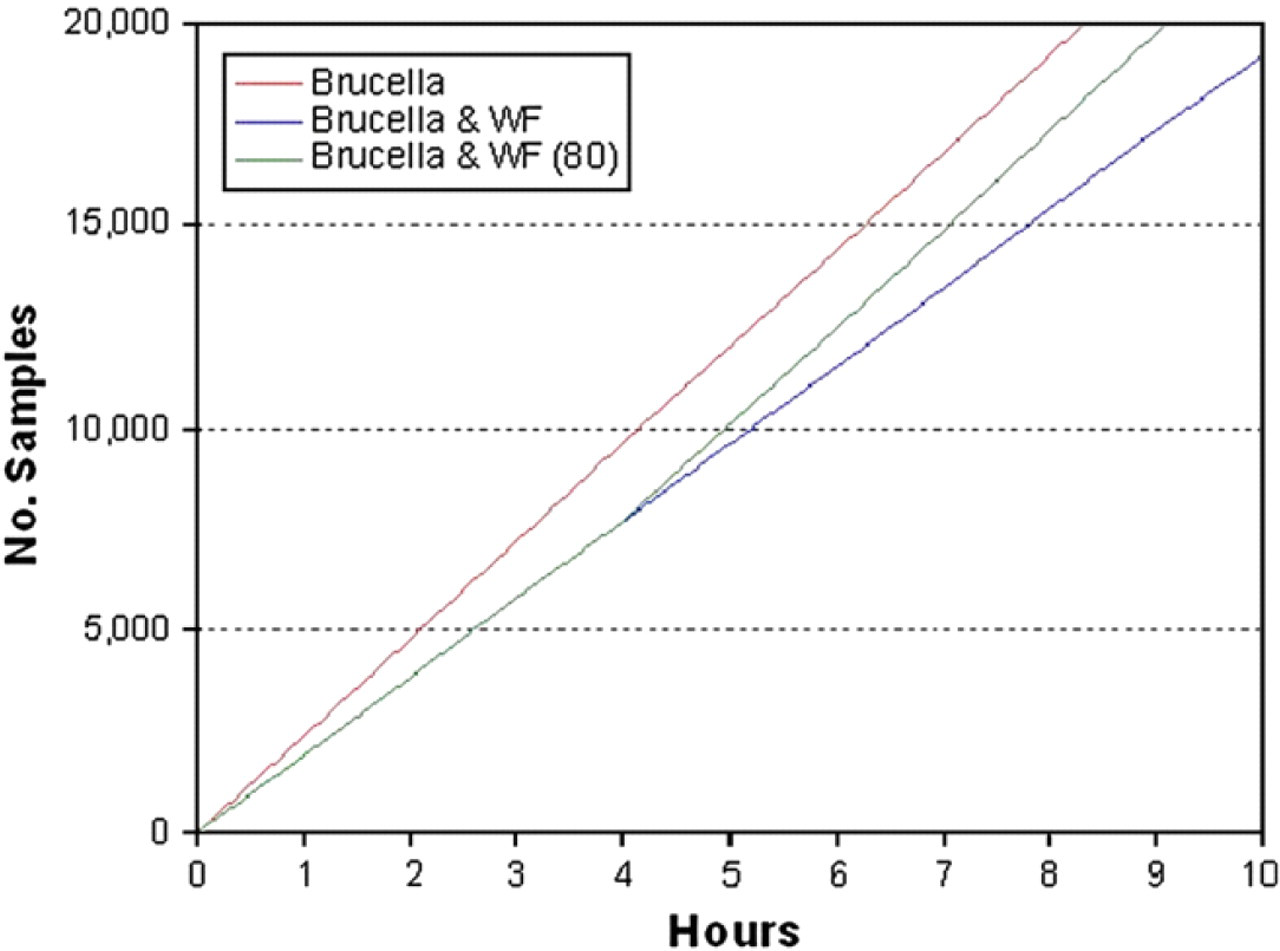
Test plate creation throughput. The graph shows the number of samples that can be added to test plates throughout a 10-h period. The three lines demonstrate outputs from three different scenarios, creating Brucella test plates alone, Brucella, and WF predilution plates on the same protocol, and the daily throughput if a maximum of 80 WF predilution plates are created.
Efficiency
The time taken to perform the automated tasks by hand revealed that across all three surveys it would take approximately six people working full time to perform the functions currently performed by the Hamilton Stars. This manual work includes all the liquid-handling functions and a basic level of administration that would enable the production of a paper report indicating on the submission form which samples were positive for the screen and what (if any) the confirmatory test results were. A modest estimate is that it would require a minimum of three additional members of staff working full time year on year to enter tube ID against plate ID and coordinate, plus at least another member of staff to enter result data onto a database for brucellosis testing alone.
It currently requires two people to effectively operate all the Hamilton Stars, a saving of four people over a fully manual method. In this situation, over a three-year time scale, the money saved in staff costs would be greater than the investment and running costs for the automation. In the overall testing and reporting process, eight people are required to effectively run the new system. A manual system would require a further eight people to recreate anything near the quality of the work. This represents a doubling of efficiency.
As described in the Introduction, a level of automation had been in place for each of these surveys beforehand. Timings taken for the upgraded automation show that on average it takes 14% more time per sample to complete the surveys with the previous automated method. If the effect of EBL pooling is removed from the calculation (EBL pooling would only be performed when time is available – not on demand), then there is no difference. Savings in labor costs made in the laboratory have been eroded by increased labor costs during sample registration.
Data Transfer
Hamilton Data Exports in CSV format (Microsoft Excel CSV File) are presented in Tables 1 and 2.
The transfer of data was checked and validated through component testing followed by system testing where the automated output was comprehensively cross-checked manually. Rare errors in data transfer are identified and investigated. Each of these occurrences has been traced back to human error and measures are then put in place to eliminate recurrence.
Performance Verification
Final user acceptance testing was completed after running the fully automated system (including data transfer) in parallel with the manual system and cross-checking the results as described above. The results of this process were documented to satisfy the data traceability requirements of ISO 17025.
Discussion
The methods section describes the successful development of an integrated and automated process for the efficient conduction of three high-throughput serological surveillance programs. The key to the success of this project has been the strategy used. This was the use of barcodes and barcode scanners to hold all the traceability aspects of the testing together from registration through to reporting; the creation of ‘islands’ where automation was more effective rather than fully automating the whole process; and the third was to conduct a single reformatting step for all the samples to avoid repetition of this task. The use of DWPs provided opportunity to do this to create a reduction in cold storage requirements. This strategy coupled with the tools to do the job, such as the Hamilton Star robots and the customized LIMS system, created a seamless data transfer process and an efficient testing process.
The rationale behind the automation of specific processes rather than tests as a whole was to automate areas where data transfer occurred such as reformatting and test plate creation and areas of highly repetitive but relatively simple tasks. Automating the data handling removed human error for these parts of the process and improved the standard of traceability. Automating additional processes on one system could create bottlenecks whereas one of the main priorities in this project was to minimize these and maximize throughput. A cost-benefit analysis identified the point at which the law of diminishing returns applied and further automation of the testing process was not deemed beneficial.
However, areas for development are still apparent. The registration and sample preparation process remain highly labor intensive. This is partly due to difficulties in dealing with sample packages, contents of which do not have standard structure. It is also due to difficulties in automating clot removal due to their heterogeneous structure. These areas are currently being addressed in a separate project. An LIMS-linked automated system of sample storage and retrieval is also under consideration. 10
Confirmatory testing is a more manual process due to the nature and complexity of the tests, due to the subjective manner in which some of them are read, and because the sample throughput is far lower (most samples have been screened out). However, the use of 2D tubes and LIMS ensures that the required samples reach the CTL and reduces the administrative and sample handling requirements once there. The system has been designed to improve the efficiency of the confirmatory testing and to reduce the possibility of transcription errors.
The customization sample management system (SMS) LIMS presented many challenges to the IT team. The incorporation of 2D tubes required extensive development but improved material transfer between laboratories. The customization to create worksheets or the CTLs provides a valuable tool to the laboratory technicians and serves to reduce transcription errors. The customization of sample registration procedures and of the test report formats provided system users with additional clarity. However, the biggest challenge was to future proof the design so that new test methods could be managed by the system with only minor development. It is not known what the next outbreak of disease will be, but the system must be able to cope with its serological test particulars. A big step toward ensuring this capability has been the creation of ELVIS as a customized feature within LIMS as this contains the functionality to correctly assign and interpret any test layout.
During the system build, the initial project design underwent some modification as each of the technical partners (the robotics team from Hamilton, the LIMS team, and the laboratory managers) became more aware of the technical capabilities, limitations, and requirements of the others. A successful project should include these partners in the design stage as early as possible, although it is likely that some modifications will always be required in a large project.
Liquid Handling
Liquid-handling issues revolved mainly around the problems caused by blood clots, which are still handled manually during pretest processing. Once the correct Hamilton Star liquid-class settings had been identified, there was good accuracy of liquid handling.
The crucial step in the automated liquid-handling process is the addition of serum to test plates. This is the step that requires the most accuracy, the other operations performed by the Hamilton's are reformatting and storage steps where a high level of accuracy is not a requirement.
The results from the experiment on dispensing serum to test plates demonstrated conformation with the testing requirements of the International Standard serum and the external quality assurance (EQA). The hand pipettes used in the laboratory are regularly calibrated to a minimum of 5% CV degree of accuracy over repeated measures and results using these were also used as a benchmark to assess the performance of the 96-channel Head on the upgraded Hamilton Star. The dose–response curves from both methods for the serial dilution series were similar. The 4.4% average difference was within acceptable limits given possible variations in test results caused by differing reagent preparations and operator error. If the 96-channel Head was used other than for a screening assay, then it may be prudent to repeat positive tests by hand before reporting.
Throughput
Throughout the development of this process, maximum throughput was always an overriding factor. Each aspect of the developed screening system for brucellosis (the emergency response model), for example, registration, preparation, reformatting, testing, and reporting, had to be able to routinely process 14,000 samples in any 8-h period. Any bottlenecks that reduced this capacity were not acceptable. This target was calculated on the basis of the routine brucellosis testing and the levels of testing during the FMD outbreak of 2001.
The undulating nature of brucellosis submissions means there is often spare capacity within the system when if used for brucellosis testing alone. This excess capacity is used to test samples for the WF and EBL surveys. Performing three tasks in one area and more frequently maximizing the automation and personnel workload—but rarely exceeding capacity—provide a more efficient solution than having three areas all using full-time staff (and robots) to perform the functions separately.
Efficiency
The developed automation demonstrated considerable efficiency savings over the performance of these tasks manually. The described upgrade to the automation over what was previously in place has enabled the VLA to meet its objectives in providing a superior data handling capacity and service. It has also provided automation platforms that are far more resistant to instances of cross contamination between samples than robots in use previously.
Conclusion
The objectives of the project were to improve the traceability of the testing and develop a database of results suitable for rapid reporting of results and for epidemiology. The improved data handling is based on a system of barcodes, each relating to specific samples and their locations within test plates, and a series of networked stations to perform sample registration, handling, and reporting. The ability to electronically track the sample from registration to reporting removed a considerable administrative burden and added a high degree of fidelity to the process of matching samples to test results. It also created a large database of detailed information that could be used for epidemiological purposes.
In summary, the developed system has improved efficiency in the testing laboratory and reporting facility over a manual system by approximately 100%. This labor saving will cover the entire equipment and labor costs for the project development within three years. This has been achieved while maintaining target throughput figures of 14,000 tests per 8 h. No errors in the electronic data transfer have to date been found. Future improvements in automating areas such as registration and in dealing more effectively with blood clots should help to reduce costs further.