
Abstract
How does co-optation of oppositional party elites influence their protest behavior in times of cross-societal protest mobilization? Rational-Choice theories of authoritarian stability postulate that opposition elites receive material incentives in parliaments that motivate them to demobilize their radical supporters, which leads to increased regime stability. Based on a novel dataset, this article examines the protest behavior of the Russian parliamentary opposition parties (the CPRF, the LDPR and JR) and their activists during the protest wave of 2011/12 as a function of each party's co-optation in the regional parliaments. Co-optation is measured by the number of leadership posts that a party holds in the regional legislature. Protest mobilization is captured by (1) the number of protest events organized by each party and (2) the aggregate number of party activists present at protest events per region. The results show clear differences between the parties: Whereas the protest behavior of the communist CPRF is not influenced by regional elite co-optation, the analysis shows negative correlations for the LDPR and JR. The results suggest that co-optation may indeed be effective in reducing protest in contentious times – but that its effect varies for different actors.
Introduction
When protests broke out after the Russian parliamentary elections in December 2011, observers spoke of an “awakening” of Russian society (Trenin et al., 2012) and asked whether there could be a “colored revolution” (Wolchik, 2012). However, as impressive as the pictures from Bolotnaya Square and Prospekt Sakharova were, the protests slowly but steadily died away facing a mixture of targeted repression, a few policy concessions by the regime and disunity on the side of the opposition. Although the immense creativity and solidarity that the movement had spurred did not leave the country unchanged (Gabowitsch, 2016; Zhuravlev, forthcoming), the “snow revolution” (Field, 2011) clearly was no revolution.
But why was there no immediate result? Why could the opposition not pressurize the
government into recalling the elections or initiating meaningful reforms? Some say
that the reason lies not only in the state's repressive reaction and the ideological
differences among the protestors, but also in the fact that during the 2000s large
parts of the Russian opposition have been turned into pillars of the regime
(Turovsky, 2015). In less than a decade, a dominant party regime was erected on both
the federal and the regional level, coupled with an electoral law designed to keep
contenders out of the political arena (Golosov, 2011). Parties that wanted to retain
their ability to win seats in the legislatures had to adapt to the new implicit
rules, which boiled down to a choice between
This article contributes to a systematic discussion on how these parties of the parliamentary opposition related to the protest movement of 2011/12. Based on rational-choice institutionalist theories of the functioning of authoritarian regimes, the article examines the question how co-optation schemes in the regional legislatures affect protest mobilization by regional opposition parties. In contrast to existing studies it not only addresses the correlation of co-optation and protest events but it differentiates between the organization of protest and the participation of party activists. As a second novelty, it captures a period of protest mobilization across ideological boundaries, which is most dangerous to regime stability (see e.g. Bunce & Wolchik, 2011) and therefore a period when the protest-reducing capacity of co-optation matters most for outcomes. The study proceeds as follows. First, the theoretical foundations are laid out. After that, the state of research is summarized and important gaps are identified. The next section sketches the most important aspects of the empirical background – the transformation of the Russian party system in the 2000s and the protest movement of 2011–2012/13. After that, the empirical analysis is conducted.
Theoretical background
The literature that deals with stabilizing effects of democratic institutions in authoritarian settings is based on rational-choice institutionalism (see Hall & Taylor, 1996). It assumes that political outcomes are an aggregate of strategic individual choices based on considerations of personal utility. These choices are often made within an institutional environment that opens up pathways for strategic action and closes down others. Hence, if designed consciously, institutions can be used to shape patterns of individual behavior and thus to manipulate political outcomes (Peters, 2011, 61). This type of reasoning was developed for democratic contexts, but its general appeal has inspired scholars to transfer it to authoritarian settings (see Gerschewski, 2013, 16). In this school of thought, autocrats are conceptualized as rational designers of incentive-generating institutions. Ideally (from the autocrat's perspective), these incentives produce outcomes that are in his 1 pre-defined interest – namely to stay in power and reap the fruits of office.
As Gandhi and Przeworski (2007, 17) show, the overwhelming majority of
authoritarian leaders in recent history have been men.
There is consensus in the literature that autocrats face two challenges to their rule (Gandhi & Przeworski, 2007; Svolik, 2012). First, they may be overthrown by members of their inner circle in a coup d'état. Second, their rule may be challenged by a mass uprising. Consequently, autocrats have to adopt measures to guard against either of these threats. Svolik (2012) dubs the first one a “problem of authoritarian power-sharing” and the second a “problem of authoritarian control” (Svolik, 2012, 7–10). The first problem may be countered with the creation of institutions that limit the dictator's ability to rule arbitrarily but that in exchange introduce transparency. This leads to more predictable politics inside the inner circle, reducing the risk of coups (Svolik, 2012, 94, see also Boix & Svolik, 2013). The second problem can be divided into two challenges: First, vital tasks such as political mobilization and the recruitment of loyal and competent administrators require access to a broad section of the population (Svolik, 2012, 164). Pro-regime parties that offer long-term benefits for sustained participation have been identified as ideal instruments to generate a large and loyal base of followers (Brownlee, 2007; Magaloni, 2008; Svolik, 2012). Here, we focus on the second challenge, namely to prevent oppositional groups from staging a joint protest campaign to oust the autocrat or significantly alter the distribution of power.
In this context, institutions are used to incorporate oppositional groups into the regime in order to weaken their revolutionary drive. This process is called co-optation, which shall be defined as “the capacity to tie strategically relevant actors […] to the regime elite” (Gerschewski, 2013, 22). It may come in various forms, including the selective distribution of resource flows and employment opportunities to selected individuals or groups (Svolik, 2012, 11–12). In exchange for such privileges, the autocrat expects the targeted actors not to “exercise [their] power to obstruct” (Shleifer & Treisman, 2000, 8 9) and to use their resources in the interest of the regime (see McFaul, 2001 for the Russian case).
Ezrow and Frantz (2011, 4) maintain that regime-sanctioned opposition parties are controllable channels that supply politicians of the opposition with career opportunities, motivating them not to rebel. Lust-Okar (2006, 6) follows the same reasoning when she maintains that parliaments provide short-cut access to the executive and to jobs for their members. Being part of an officially approved institution may thus translate into direct economic benefits. Since office holders are close to the centers of decision making, they “are more likely to obtain permits and licenses expediently, to bid successfully on public contracts, and to circumvent government restrictions” (Gandhi & Lust-Okar, 2009, 410). Reuter and Robertson (2015) add that the presence in parliament allows oppositional actors to lobby for their own business interests and secures them immunity from criminal prosecution.
Although such arguments are plausible, precise empirical tests are rare – partly because authoritarian politics “tend to play out behind closed palace doors” (Ulfelder, 2005, 315). Therefore, many cross-national studies have found statistical associations between the existence of democratic institutions and authoritarian stability (e.g. Ezrow & Frantz, 2011, Gandhi, 2008, Gandhi & Przeworski, 2007, Svolik, 2012), but few have scrutinized the concrete causal mechanisms behind such findings.
A second problem in the existing literature is its implicit elite-bias. Most authors
who postulate stabilizing effects of authoritarian institutions assume that party
elites are crucial in mobilizing protest. Institutionalist co-optation theory
implicitly postulates that if elites are prevented from engaging in protest, threats
to the regime can be minimized. From this perspective, individual protestors can be
mobilized or demobilized according to the calculations of party elites. However, it
can be argued that this view of protest mobilization is slightly outdated. Digital
technologies facilitate the horizontal dissemination of information and mobilizing
appeals (e.g. Gerbaudo, 2012). In turn, despite their greater resources and
information, party elites become less important in pulling protesting crowds
together. The fact that most protest events during the
If elite-co-optation is studied as a potential mechanism to keep protest low, one
thus has to devise indicators that measure whether hypothesized mobilizing or
demobilizing efforts of party elites indeed reach down to the activists. Simply
counting the number of protest events officially conducted by a respective party
(Reuter & Robertson, 2015) does not seem to be the most appropriate
operationalization. It measures elite actions better than it measures actual protest
behavior by activists. This appears particularly problematic in situations of
cross-societal political discontent and protest mobilization such as the
The early 2000s in Russia were a period of political and administrative (re)centralization. The strengthening of the central state and the establishment of tight top-down political control were among the most important objectives of Vladimir Putin's first two terms as president (Sharafutdinova, 2013). Welcomed initially as an important step to stabilize the highly fragmented political sphere, the reforms pushed the “pendulum” toward authoritarian consolidation (Gel'man, 2006). One of the most decisive elements in this transformation was the creation of a “party of power” 2 loyal to and controlled by the central executive that gave it the ability to control the legislative agenda.
Parties of power are conceptualized as organisations that (1) are established
by the central executive, (2) are largely non-ideological, and (3) receive
massive support from state resources (Gel'man, 2006, 551).
The term “power vertical” usually refers to the highly centralized
decision making structure that was established in the 2000s and was
decisively strengthened with the abolition of gubernatorial elections in
2004 (Pomeranz, 2009, 179).
Until 2007, UR was established as a dominant force also in the periphery (Gel'man, 2008, 919). Gaining control over the political landscape of the regions was a major step in the consolidation of authoritarianism (Sharafutdinova, 2013, 360). A few measures introduced by the central executive that served to tame the once all-powerful governors deserve special mention. First, in 2000, an intermediary level of seven (later eight) federal districts was introduced to systematize Moscow's oversight of the governors’ activities (Orttung, 2004). Second, the government cut the region's fiscal independence by shifting tax income back to the center (Orttung, 2004, 44). Third, the upper house of parliament, where governors had often vetoed federal law (Slider, 2014, 159), was reformed in 2002 to impair the governors’ destructive potential (Remington, 2010). Governors, structurally weakened by these measures, were finally deprived of their independent source of legitimacy when Putin abandoned direct gubernatorial elections in 2004 (Slider, 2014, 160). The removal of direct elections produced incentives for governors to join UR (Gel'man, 2008, 919). And indeed, Reuter and Robertson (2012) show that over-performance in generating votes significantly decreases a governor's likelihood of being replaced.
The centralizing measures, combined with UR's growing electoral appeal due to economic recovery and Putin's personal popularity (Hale, 2011, 265), produced a staggering level of electoral dominance: at the end of the 2000s – in addition to UR's absolute majority in the federal parliament – 90% of governors and 84% of mayors in regional capitals were UR affiliates and the UR faction controlled the majority in 80 out of 83 regional assemblies (Panov & Ross, 2013, 738). This shows that, although initially a costly investment, UR proved worthwhile for the integration of elites (Gel'man, 2006, 553) and thus for securing nationwide electoral support. However, ensuring elite loyalty was only half of what it took to establish such a level of dominance. Political challengers had to be controlled or kept out of the political arena altogether.
The entry to the political playing field was the subject of important institutional changes. In 2004, the law for the registration of new parties was amended. The minimum number of members was increased from 10,000 to 50,000 and a majority of regions each had to provide at least 500 members (up from 100) (Chaisty, 2012, 283). Regional party branches had to exist in two thirds instead of 50% of regions (Gel'man, 2006, 552). The law not only effectively barred new actors from entering the political arena, but it also forced existing parties to re-register under the new conditions (Gel'man, 2008, 919). Accordingly, between 2005 and 2009, the number of officially registered parties decreased from 37 to 6 (Golosov, 2014, 277). Furthermore, the participation in elections through electoral blocs was prohibited in 2005 and the threshold for national elections was raised from 5% to 7% of the vote (Gel'man, 2006, 552).
The opposition parties that survived these changes faced increasingly unfair conditions of competition. Media coverage greatly benefited UR, state employees and students in many cases received voting instructions (White, 2014, 68–69), regional and local administrators engaged in large-scale vote buying (Golosov, 2013) and vote fraud greatly increased between 2003 and 2007 (White, 2014, 69), also in regional elections (McFaul & Stoner-Weiss, 2008, 71). While some observers in the early 2000s had initially welcomed institutional restructuring to reduce the fragmentation of the party system (Gel'man, 2006, 546), it soon became clear that stability came at the price of political dominance. The subjugation of regional executives under the president's “power vertical” and the deliberate cutback of party competition cemented the central executive as the single locus of political initiative.
What role for the opposition?
Although the electoral process was largely brought under the control of the
central executive and from the mid-2000s no oppositional victories above the
local level were to be expected (Levitsky & Way, 2010, 200), oppositional
parties continued to participate in the political process. By the end of the
2000s, observers usually grouped oppositional actors into one of two camps: the
first is the
Studies of protest and contentious politics in Russia rarely deal with the systemic opposition (Semenov, Lobanova, & Zavadskaya, 2016 is a welcome exception). Although some differentiate between the CPRF on the one hand, representing an “enemy” of the regime, and the LDPR and JR on the other, representing “satellites” (Gel'man, 2008), the three parties are generally thought of as “pillars” of the regime (Turovsky, 2015): they enjoy their privileges of parliamentary representation and bestow the decreasingly democratic institutions with legitimacy through their continued participation. For this reason that echoes the arguments of co-optation theory outlined above, they are disregarded as serious protest forces – with the partial exception of the CPRF.
There are three reasons to be skeptical of such a wide-ranging conclusion. First, it is based on surprisingly little empirical evidence. Indeed, all aspects of the three parties’ behavior are heavily understudied, especially in the regions (March, 2012, 242). Second, the dominant perspective of a co-opted party is highly elite-centered. However, while their leadership may have chosen not to threaten the political status quo, their electorate does not vote for them to express support for UR or Putin. Colton and Hale (2014) provide survey data of voters of the “systemic opposition” in the 2011 election. For all three parties, significant shares of voters reported that they cast a protest vote (CPRF: 23%, LDPR: 38%, JR: 23%). Therefore, even if party elites are tamed by the benefits of participation, at least part of the systemic opposition's electorate should be understood as potential allies of protest campaigns. 4 Third, elite calculations may change. As March notes, the growing protest mood in 2011 set incentives for the opposition to capitalize on the protest vote (March, 2011, 10). In other words, although Russian parliamentary parties might not want to overthrow the system in which they have found a relatively comfortable space, it is plausible that they try to use widespread anti-regime sentiments to extract better conditions for their existence.
Indeed, even if the parties are understood to be instruments of the
regime (Turovsky, 2015), we must assume that at least a portion of its
supporters are dissatisfied with the political reality and want to
change it: to fulfill their function as buffers, the parties need to
attract voters that without them would turn to more radical
alternatives. It thus follows from conceptual reasons that we must
assume that a significant number of voters has good reason to take part
in protests.
For these reasons we are well-advised not to disregard these parties as political actors. Instead, we should devote more attention to the actual conditions under which party elites and activists engage in protest and under which elites diffuse protest sentiment among their followers (see Semenov et al., 2016).
The resilience of the carefully redesigned political system was tested in late 2011, when hundreds of thousands of protesters took to the streets. Thanks to a massive voluntary election monitoring campaign and advanced online technology, instances of electoral fraud during the parliamentary elections on 4 December 2011 could be detected and communicated on an unprecedented scale (Reuter & Szakonyi, 2015). Hence, when it was announced that United Russia had managed to secure an absolute majority in the Duma, several thousand protesters and many prominent opposition figures gathered in Moscow on 5 December to complain about what they thought was an illegitimate election result (Greene, 2013, 42).
In the following months, a wave of unexpectedly creative protest swept the country (Gabowitsch, 2016). In terms of absolute numbers, Moscow was the epicenter. Several thousand protested on 5 December, followed by a mass rally on 10 December, in which between 25,000 (police estimate) and 80,000 (organizers’ estimate) took part. On 24 December and 4 February, two more mass rallies took place with up to 120,000 and 160,000 participants respectively (Robertson, 2014, 124–5). In Moscow, the majority of participants were young or middle-aged and the gender-balance was skewed toward the male side. Over 60% of demonstrators identified their political outlook as “democratic” or “liberal”, 80% of those polled had higher education and around 70% came from higher-income groups (Volkov, 2012, 74–5). These numbers show that the early protest in the capital was dominated by a relatively well-off middle class (see also Magun, 2014).
Regional protest was less middle-class centered (Hagemann & Kufenko, 2016). Indeed, comparatively poor towns in Western Siberia were among those with the highest protest turnout per capita (Gabowitsch, 2013, 82). Other than that, little is known about systematic variation of protest organization and turnout across Russia's regions during the protest cycle of 2011/12. Sobolev (2012) finds positive effects of population concentration and the regional level of democracy on the size of the biggest protest demonstration in the given period – a finding supported in Lankina's (2015) investigation of regional protest between 2007 and 2012. Hagemann and Kufenko (2016) stress that regional income-inequality was a significant predictor of the likelihood of protest emergence and add that the level of education was as important for protest turnout in the regions as it was in Moscow.
Both in the metropoles and in the regions, the first three months were the most intense phase of the protests. After the presidential elections on 4 March, participation in rallies and other forms of protest gradually declined. Organizational weakness and ideological differences among the opposition were important factors, but the Kremlin had also recovered from its initial shock (Robertson, 2014, 125). It organized several counter-demonstrations of UR supporters (Smyth et al., 2013), engaged in discrediting campaigns, tightened street protest regulations and increased repression (Wolchik, 2012, 68). 5
At a Moscow demonstration in May 2012, dozens of people were detained and
several first-time protesters received multi-year prison terms after
doubtful court proceedings (Lipman, 2014: 184–5). The message was clear:
anti-regime protest is a dangerous undertaking (Robertson, 2014,
126).
Therefore, the period between December 2011 and early March 2012 seems like a sensible period to choose if one is interested in anti-regime protest that transgresses socio-demographic and ideological milieus. For an investigation of the parliamentary opposition, the period bears two additional conceptual advantages. First, with the presidential elections ahead, the parties needed to mobilize support for their respective candidates. They thus had an incentive to capitalize on the widespread discontent by echoing the claims of the protesters and supporting the movement with their own resources (see Gabowitsch, 2013, 169). This incentive is constant for all regional party branches because the whole party should benefit from a better result at the presidential elections. Under such conditions, it is more plausible to assume that reduced regional protest activity of a party is really attributable to region-specific factors. Second, the literature on colored revolutions has shown that periods of protest mobilization across societal and ideological boundaries are most dangerous to electoral authoritarian regimes (Bunce & Wolchik, 2011). In such instances, regimes are especially keen to keep protest low and prevent oppositional forces from uniting. Therefore, this period of high mobilization serves as a test case for the effectiveness of co-optation mechanisms.
What roles did the parliamentary opposition parties play in the protest movement? Before the elections, parties had recognized that they stood to benefit from the growing dissent and spoke out more clearly against the regime (Gel'man, 2013, 8). Yet, in the immediate aftermath of the elections, parties seemed as surprised by the upsurge of protest as the governing elite. Some pre-arranged demonstrations on 7 December by Yabloko and the CPRF were seized by non-affiliated protesters (Gabowitsch, 2013, 168). That aside, protest rallies in the big cities were organized to a large extent on an ad-hoc basis. Many people who would normally abstain from political activities took central organizational roles (Volkov, 2015, 41–2). Mobilization took place almost exclusively through online channels (Yanitzky, 2013, 13). While they did try to channel the political mobilization in their direction, parties thus played a secondary role at best – at least in Moscow and St. Petersburg.
In the regions, parties were late joiners, but since the second wave of big rallies starting on 24 December, they were more actively involved. The CPRF was generally the most active of the three. In many places, it tried to adapt to the rhetoric of liberals and nationalists, presenting itself as a unifying force (Gabowitsch, 2013, 168). Furthermore, it also engaged in protest activities in poor regions where the non-parliamentary opposition and spontaneous apolitical activists failed to mobilize. In the case of JR, the protests caused increased factionalism inside the party: some deputies took on an active role in the protests, providing the events with extra legitimacy and media coverage, while others abstained (Volkov, 2015, 38).
And indeed, the parliamentary elections presented the opposition parties with a dilemma. On the one hand, they could align with the protest movement to try and reap the fruits of public discontent in the presidential elections. On the other hand, they had something to lose: not only did they fear to be stripped of their spoils of co-optation arrangements in federal and regional institutions. They also had just secured a tremendous success at the polls – in spite of all falsifications. Whether and under what conditions parliamentary opposition parties engaged in the protest movement or abstained was thus an open question.
Hypotheses and operationalization
Recalling the theoretical arguments, I expect less protest mobilization by opposition parties in those regions where their elites are co-opted through the regional political institutions. In order to test the elite-centered arguments of rational-choice-institutionalism I also assume that party elites are able to “demobilize their supporters” (Reuter & Robertson, 2015, 235). This assumption will be tested by providing two different indicators for protest mobilization. We therefore expect:
(H1).
(H2).
Additionally, we expect the different organizational structure of two of the parties to have an effect of the parties’ behavior in the given context. The CPRF's local branches can act relatively independently of the regional structures (March, 2002). 6 The LDPR, by contrast, is organized in a tight top-down structure, leaving little maneuver space for local party organizations (Hutcheson, 2003, 60). If co-opted regional elites do not want protest to arise, it is assumed that they do not engage in protest activities themselves and, additionally, give orders to the local branches to keep activists off the streets. If regional elites, in turn, hope to gain from protest, they will provide their resources for protest activities and will try to mobilize their local activists. In the case of the hierarchically structured LDPR, such orders should have a greater effect on the activists’ behavior. We thus expect:
(H3).
In contrast to most other parties, the (re-)foundation of the CPRF was to
a large extent based on the work of grassroots activists. This resulted
in significant autonomy of regional and local party bodies, which was
subsequently laid down in the party statutes (March, 2002, 144).
Because little is known about the organizational structure of JR, it is
not possible to make a prediction for JR concerning the third
hypothesis. This part of the empirical analysis therefore has
explorative character.
Since the regional executive is in most regions closed off from members of the formal opposition, the legislative branch is where co-optation usually takes place (Turovsky, 2015, 128–129). Already in 2001, McFaul argued that (limited) access to power structures and the material benefits that came with legislative seats induced the CPRF's national leadership to abstain from radical anti-parliamentary action (McFaul, 2001, 270). On the regional level, Reuter and Robertson (2015) have shown that the number of protest events organized by the CPRF is negatively associated with the number of high-profile offices in a regional legislature held by the CPRF. This analysis follows their operationalization of co-optation arrangements in regional parliaments. The authors count the number of leadership positions that a party controls in the regional legislature. Leadership positions are conceptualized as the offices of speaker, vice-speaker and the chairs of standing committees, since those positions offer increased control over the agenda, greater rent-seeking opportunities and more staff (Reuter & Robertson, 2015, 237). Moreover, in Russia's legislatures, these positions are assigned by simple parliamentary majority (Reuter & Robertson, 2015, 239) and are not tied to the term period. Therefore, in contrast to simple mandates, holders of such positions benefit from their offices solely at the mercy of the parliamentary majority. As rational choice institutionalism suggests, they should be keen not to provoke their own dismissal and thus abstain from potentially destabilizing actions such as protest mobilization. 8
It must be noted that a connection between leadership posts and
demobilization efforts need not reflect simple co-optation of otherwise
sturdy opposition elites but may denote the existence of informal elite
groups spread across several parties. These arrangements have been
documented for Russia's regions (e.g. Kynev, 2010). However, if such
power-sharing reduces contention, this effect would still prove the
taming influence of democratic institutions (parties and parliaments) on
opposition actors in electoral authoritarian settings.
As the differentiation in
To this end, photographic and video material from the protest events is coded to capture the approximate number of present activists who are recognizably affiliated with a political party. 9 Party affiliation is assumed when a demonstrator displays unambiguous markers that associate him or her with a given party – i.e. scarfs, overcoats, hats, banners or flags with party symbols or slogans. If several photos of a protest event are available, only one image is used for coding in order to avoid double counting of the same person. Each event is assigned an approximate number of recognizable party activists: 1–2, 5, 10, 20 or 50 activists. The numbers for each protest event are then aggregated to obtain a number for each party in any given region. This measure has obvious limitations, which will be discussed below. However, since its inaccuracies are unlikely to vary systematically across the regions, it provides a rough but utilizable indicator of party activists’ protest.
For a positive assessment of the use of visual materials in protest
research see Oleinik (2015).
In the statistical analysis, it is advisable to control for several factors that could themselves influence the size of party protest in a given region. Two of these factors will be controlled for by case selection: First, all regions in which UR does not have a majority in the regional parliament are removed from the sample. Second, the city of Moscow is excluded: here, the central party organs are most certainly involved in protest mobilization, which would confuse the picture. The rest of the potentially influential factors are controlled for by adding variables to the statistical model. These factors can be grouped in two categories: demographic or socio-economic variables and characteristics of the political process.
Concerning the first group, I include four variables. First, the
Russia has a number of “ethnic republics” with a high share of
inhabitants of non-Russian ethnicity. Many of these regions bargained
for higher independence from the center in the 1990s (Sharafutdinova,
2013) and established regional authoritarian regimes with high degrees
of repression. Despite re-centralizing policies under Putin, repression
is still higher in ethnically defined regions (see Zubarevich, 2012).
Reuter and Robertson (2015) therefore use the ethnic composition of a
region as a measure for repression, which may negatively affect protest
behavior. This study follows their suggestion.
The second group of control variables concerns the specificities of the regional
political context. First, regional parties may more actively mobilize for
protest when they expect to gain from it in upcoming elections (Trejo, 2014).
Therefore, we include the
Some regions had elected their parliaments as early as 2007. In order to
capture the latest mood in the electorate, the regional share in the
2011 national parliamentary elections was therefore given preference
over the vote share of the party in the last regional elections.
Data on the distribution of leadership posts in the regional parliaments were gathered by the author. First-hand information from online databases of regional legislatures was used wherever possible. In case of dysfunctional or lacking databases, a time-restricted online search of regional newspaper articles and other dated documents was conducted. Searching specifically for documents that dated from the exact period under study ensured that any change of position was noticed. 12
For backup, a dataset from Rostislav Turovsky from the Higher School of
Economics, Moscow, on the distribution of leadership posts in April 2013
was used.
Data on the number of protest events organized by each parliamentary opposition party are taken from a dataset compiled by Gabowitsch and Sveshnikova (used in Gabowitsch, 2013, 2016). The authors included all collective public events that were linked to the protest against the outcome of the parliamentary elections. The database includes marches, rallies, car processions, spontaneous gatherings and “nano-meetings”. The latter were excluded. 13 The authors of the dataset drew from several types of sources in order to circumvent media bias: they included information not only from regional press reports, but also from blogs and party websites. The dataset contains information on 547 protest events in the studied period, with 481 events in the 76 regions of the sample. It lists date, place, type and, in 44% of cases, also the organizer of the event. The number of missings in the category of the organizer is thus relatively high. Yet the question whether or not the information on the organizer was included in the respective sources is a matter of chance and should not vary systematically across regions. While the data may underestimate the absolute number of protest events organized by political parties, I argue that it is still a useful indicator of regional variance.
These toy demonstrations do not feature human beings – instead, single
activists put up a number of toy figures with protest banners and post
pictures of the “demonstration” on social media.
The same counts for the second dependent variable – the aggregated number of
party activists at protest events per region. The variable was coded relying on
the same dataset. The authors archived all original reports on the protest
events. A fresh consultation of these sources combined with additional online
research provided usable visual coverage of 91% of the listed events. The
material of each event was coded as described above, and the obtained numbers
were aggregated to obtain an approximate figure of party activists present at
protest events per region in the given period. Naturally, the resulting figure
is not to be taken as the real number of participating party activists – for two
reasons. First, there are obvious limitations in the quality of the visual
material. The camera angle or the timing of the shot may hide significant parts
of the crowd – for various reasons. Second, everybody who shows party insignia
can be plausibly thought of as a party activist but certainly not all activists
who are affiliated with a party display its symbols. Therefore, we can assume
that the indicator significantly underestimates the real number of protesting
party activists. For both reasons, the indicator is not a representation of the
absolute number of party activists – rather, it should be understood as a
The study uses data that are partly based on press reports. Newspapers are commonly used as the “basic material” in quantitative protest research (Hutter, 2014, 349) – although it is known that press reports introduce bias of various sorts. Earl, Martin, McCarthy, and Soule (2004) differentiate between selection bias (the fact that newspapers and online sources selectively report on particular types of protests and fail to report on others) and description bias (the fact that existing coverage often misrepresents the events). These biases may be reduced by using multiple types of sources and triangulation (Earl et al., 2004), which is what the authors of the dataset practiced whenever possible. However, bias cannot be ruled out completely. Results therefore must be interpreted with due caution.
This study uses regions as the units of analysis. Such a sub-national approach has several methodological advantages compared to a cross-national comparative design. First, it mitigates the “whole-nation bias” so present in the comparative literature, which often subsumes a heterogeneous landscape in a single number (Snyder, 2001: 94). Second, and more importantly, it serves to control for various potentially influential factors such as national political culture, the legal environment and national historical trajectories by holding them constant. This way, a most similar systems design is approximated, facilitating the attribution of the outcomes of interest to the independent variables put forward in the theory (Snyder, 2001: 96).
For all its merits, certain conditions must be respected if the sub-national approach is to be employed successfully. Most importantly, the assumed causal processes should take place on the sub-national level as well (Snyder, 2001: 95). When transferred to the present case, this condition results in two problems. First, do regional legislatures have enough policy influence to provide office holders with decisive advantages for rent-seeking? Reuter and Turovsky (2014) find that regional legislatures in 2011 were attractive lobbying targets for local businesses: 30% of firm directors who conduct face-to-face lobbying preferred the regional legislature for their endeavors (Reuter & Turovsky, 2014, 666). Moreover, another study found that between 2001 and 2010, 48% of regional deputies themselves were businessmen (see Reuter & Robertson, 2015, 238). Both findings suggest that legislation passed in the regions does affect businesses considerably, bolstering the assumption that privileged access to that legislation can indeed be used for rent-seeking purposes.
Second, the design assumes that party branches carry out protest mobilization
without interference from the central party headquarters. This assumption
follows from the research design, which treats all units of analysis as
independent cases, but it seems questionable. Based on the region as a unit of
analysis, the research design cannot accommodate the potential influence from a
higher administrative level. However, it can be argued that orders to increase
or decrease protest are given out equally to all sub-national branches of a
party. If the central party elite seeks to achieve a certain goal it would not
make sense to restrict their instructions to a subset of regions. If that
assumption is made, one can argue that factors, which cause regional party
elites to neglect or follow central orders, are indeed
Results
Absolute and relative numbers of party protest
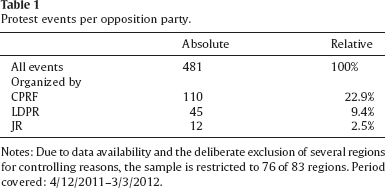
If we look at the absolute numbers of organized protest events between 4 December 2011 and 3 March 2012 (Table 1), two observations emerge. First, the three parties participated in the organization of approximately a third of all protest events held in the given period. This is systematic evidence for Gabowitsch's conclusion that parties were more important for regional protest than previously thought (Gabowitsch, 2013, 168–69). Second, the difference between the three parties is striking. The CPRF is by far the most active of the three. It is involved in the organization of 23% of all recorded events. The LDPR is substantially less active, being responsible for only 45 events – 9.4% of the total number. Lastly, JR participated in the organization of twelve protest events which comes down to 2.5% of the total protest recorded.
Protest events per opposition party.
Notes: Due to data availability and the deliberate exclusion of
several regions for controlling reasons, the sample is restricted to
76 of 83 regions. Period covered: 4/12/2011–3/3/2012.
Protest events per opposition party.
Notes: Due to data availability and the deliberate exclusion of several regions for controlling reasons, the sample is restricted to 76 of 83 regions. Period covered: 4/12/2011–3/3/2012.
Looking at the descriptive statistics of the three parties (Table A1 in the Appendix), it is evident that regional variation of their protest activities is immense. In several regions, the parties do not engage in protest at all. In other regions, they organize several protest events in the three months under study. Concerning party activists, the regional differences are as pronounced: Maximum numbers of aggregated protesters per region vary between 0 and 126 in the case of the CPRF, between 0 and 35 in the case of the LDPR and between 0 and 70 for JR.
In all, the figures demonstrate a relatively high regional variation of party protest that calls for an explanation. Even in the case of JR, which generally appears as an insignificant force when it comes to the organization of protest, we find considerable regional variation in its protest activity – with few hot spots of relatively high protest mobilization and many regions with almost no protest at all.
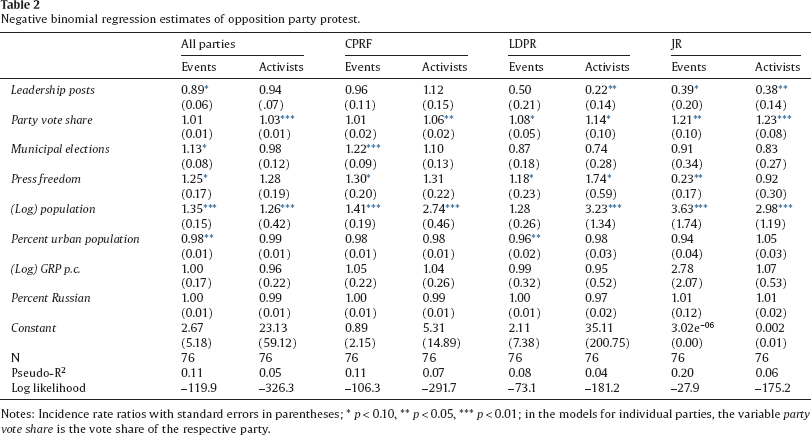
Table 2 shows the results of the statistical analysis. Since the dependent variables consist of count data, which displays overdispersion 14 throughout, I use negative binomial regressions (see Allison, 2009). 15 For ease of interpretation, incidence rate ratios (IRR) are displayed. IRRs can be understood as factor changes: they denote the expected rate of change in the dependent variable (DV) for each one-unit increase of the respective independent variable (IV) – holding all other variables in the model constant (Costello, Jenkins, & Aly, 2015, 97–98). An IRR between 0 and 1 indicates a reduction in the value of the DV with a one-unit increase of the IV, while an IRR above 1 indicates an increase in the DV with a one-unit increase of the IV.
Negative binomial regression estimates of opposition party protest.
Notes: Incidence rate ratios with standard errors in parentheses;
p < 0.10,
p < 0.05,
p < 0.01; in the models for individual parties,
the variable party vote share is the vote share of
the respective party.
Negative binomial regression estimates of opposition party protest.
Notes: Incidence rate ratios with standard errors in parentheses;
The term overdispersion denotes that the variance of a variable is
greater than its mean. This is the case for all dependent variables in
the study (see Table A1 in the Appendix).
This procedure is often used in quantitative studies that deal with
protest data (see e.g. Hendrix, Haggard, & Magaloni, 2009, Meyer
& Minkoff, 2004, and also Reuter & Robertson, 2015).
I first discuss the results of the two models that group all three opposition
parties together (“all parties” in Table 2). Leadership posts have a
significant negative effect on protest organization, while the effect on party
activists is smaller in substance and not statistically significant. The IRR for
the first dependent variable (0.89,
Concerning the control variables, the combined vote share of the three opposition
parties has no effect on the number of organized events but is highly
significant if the number of activists is concerned, suggesting that that
The findings are more plausible if the index of press freedom is treated
as an indicator of regional authoritarianism: In more liberal regions,
more protest events can be organized because the authorities are more
willing to grant their permission. Such an interpretation, however,
would require a more sophisticated theoretical and empirical foundation
than it is possible to offer at this point.
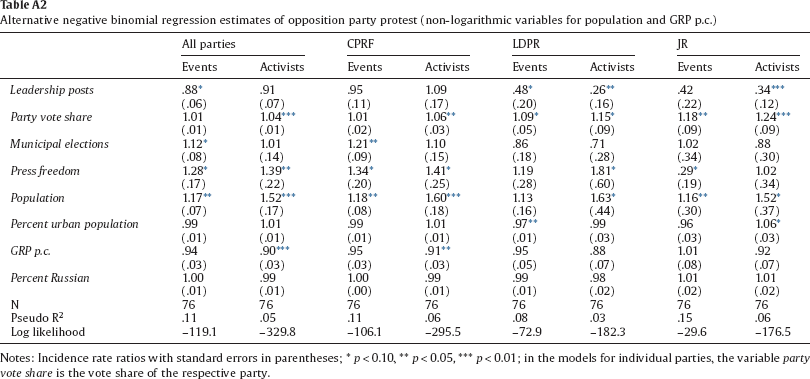
Since the variable has been log-transformed in order to reduce the effect
of extreme cases, IRRs cannot be interpreted similarly to the other
variables. As far as the effects of leadership posts are concerned,
models with non-transformed variables for population and GRP yield very
similar results (see Table A2 in the
Appendix).
We now investigate each party individually. First, the effect of the main
independent variable,
McFaul (2001) argues that in the 1990s parliamentary co-optation tempted
the CPRF to abstain from revolutionary moves. I argue that both findings
go well together, since the context is vastly different. In the 1990s,
the CPRF voluntarily integrated itself into a flawed but functioning
representative democracy and accepted its rules in exchange for
resources on which to build up its network (March, 2002). In the present
case, by contrast, protest was mounted as a response to the hollowing
out of the parliamentary system. Indeed, it was the idea of a “stolen
election” (i.e. a violation of a basic principle of representative
democracy) that united protest forces of various political inclinations,
including CPRF activists.
By contrast, in the case of the LDPR, co-optation appears to work. Leadership
posts have a substantive effect on both protest variables. An increase in one
post reduces the number of protest events by 50% and the number of protesting
activists by 78% (holding all other factors constant). The first correlation
barely fails to reach statistical significance (
This is the sole model that fails to reach statistical significance in a
Wald test that tests the model against the null hypothesis that all
coefficients are simultaneously equal to zero, by very close margins.
However, when the two variables that were consistently shown to have no
effect on any of the parties’ protest –
For JR, a similar picture emerges. Holding constant other influence factors
allows discerning the effect of leadership posts on protest organization even in
this case of a highly skewed distribution. The results show that an increase in
one leadership post is associated with a reduction of 61% of protest events
(
Next, we briefly turn to the controls to discuss the most important results.
First, unsurprisingly,
H1 – leadership posts and protest organization
When all parties are taken together, the data support the first hypothesis.
An increase in the number of leadership posts is associated with a moderate
and statistically significant reduction of the number of organized protest
events in the period under study. This could be considered proof for the
validity of the theoretical argument that co-optation moderates the behavior
of oppositional forces. However, one should not leap to conclusions. If the
parties are studied individually, marked differences among them come to the
fore. It turns out that the reduction of organized protest per additional
leadership post in the case of the CPRF is small and statistically
insignificant. For the CPRF,
H2 – leadership posts and protesting party activists
The general model reveals no effect of leadership posts on the number of
protesting party activists. This could be interpreted as showing a real
difference between the indicators used: While co-opted party elites indeed
refrain from organizing protest, their activists still take to the streets.
Again, one should be cautious with such an interpretation. Disaggregating
the parties shows even more striking differences between them than in the
case of
H3 – a stronger negative effect on activists’ protest for the LDPR than for the CPRF
The results give empirical support to
Concerning the model fit, low to moderate pseudo-R2 indicates that there is much more to learn about why parliamentary opposition parties and their activists take part in or abstain from protest generally. However, it has to be noted that values of the pseudo-R2 used here are lower than the values of the common R2 used in OLS-regression, with values between .2 and .4 representing very good model fit (Backhaus, Erichson, Plinke, & Weiber, 2006, 449). 20 Nevertheless, indicators could and should be improved. For instance, the measure of co-optation could be extended to instances of institutional incorporation beyond parliamentary posts. This would require elaborate qualitative research but it could yield more specific hypotheses, leading to more secure conclusions. Also, the connections between parties and non-parliamentary groups in a region should be considered more seriously, as better connections may increase participation of party-activists at non-party events. In general, the results shown in this analysis provide important first insights on the protest behavior of systemic opposition forces, but should be corroborated by further research – both qualitatively and quantitatively.
This characteristic was confirmed in an analysis of the performance
of various pseudo-R2-measures (UCLA: Statistical
Consulting Group, 2011).
The findings of this analysis can be summarized in three points. First, in absolute terms, the CPRF was much more engaged in the protests than the other two parties. Second, one reason for this difference may be the diverging susceptibility of the parties to the incentives of co-optation in the regional legislatures. Where LDPR and JR are co-opted, their protest decreases markedly, which is not the case for the CPRF. In light of these differences, applying the label of “systemic opposition” equally to all three parties appears to be misleading. Instead the results support Gel'man's categorization: while the CPRF is seen as the most serious parliamentary opposition party, the LDPR and JR conform to their labels as largely harmless “satellites” (Gel'man, 2008), whose elites can be kept from mobilizing against the regime with the help of material incentives.
Third, the results have shown that differences between the parties seem to be more important than differences between the two indicators. It was expected that activists would use protest events of other groups to show their discontent on the streets even when their regional party elites chose not to participate in protest activities. For the LDPR and JR, both indicators largely show the same results respectively. For these parties, the data thus refute such speculations, suggesting that party elites successfully mobilize and demobilize their activists according to their calculations. Yet, in the case of the CPRF, there is greater variance between the two indicators, with some variables affecting the first, others affecting the second dependent variable. Judging on the basis of these data, the CPRF therefore not only looks more like a serious protest force but also seems to have more autonomous activists. Supplying two separate indicators for party protest has therefore proven useful because it allowed gathering evidence that points to differences between the parties concerning the relationships between their regional elites and their activists.
The analysis provides first systematic evidence to the mostly anecdotal insights put forward by some existing research (Gel'man, 2008; March, 2012). Although the CPRF is sometimes regarded as virtual opposition, most authors take it more seriously than the other two parties. The results provide strong systematic evidence for this position. Furthermore, we can assert that co-optation in regional legislatures is indeed useful to the regime: Reducing protest by two of the three in-system forces, it helped to hamper a negative consensus among the Russian opposition, potentially impeding a stronger joint protest campaign. Finally, concerning the underlying rational-choice theory, the results call to study the conditions of stabilizing authoritarian regimes through democratic institutions in a more nuanced fashion: If different groups react differently to the same incentives, more research into the precise factors that lead parties to disregard such arrangements will certainly boost our knowledge on the stability of authoritarian regimes.
Funding sources
This research was carried out within the framework of a research project funded by the Volkswagen Foundation (not related to the carmaker of the same name).
Conflict of interest
The author confirms that there are no known conflicts of interest associated with this publication and there has been no significant financial support for this work that could have influenced its outcome.
Footnotes
Acknowledgements
An earlier version of this paper was presented at the ECPR Graduate Conference in Tartu, 2016. The author thanks all commentators for valuable suggestions. In addition, thanks go to Heiko Pleines, Edeltraud Roller, Mischa Gabowitsch and the anonymous reviewers for their comments, which significantly improved the manuscript. Special thanks go to Mischa Gabowitsch and Olga Sveshnikova for granting access to their PEPS database and to Rostislav Turovsky for valuable back-up information on leadership posts in Russian regional parliaments.
Appendix
Alternative negative binomial regression estimates of opposition party protest (non-logarithmic variables for population and GRP p.c.)
| All parties |
CPRF |
LDPR |
JR |
|||||
|---|---|---|---|---|---|---|---|---|
| Events | Activists | Events | Activists | Events | Activists | Events | Activists | |
|
|
.88 * | .91 | .95 | 1.09 | .48 * | .26 ** | .42 | .34 *** |
| (.06) | (.07) | (.11) | (.17) | (.20) | (.16) | (.22) | (.12) | |
|
|
1.01 | 1.04 *** | 1.01 | 1.06 ** | 1.09 * | 1.15 * | 1.18 ** | 1.24 *** |
| (.01) | (.01) | (.02) | (.03) | (.05) | (.09) | (.09) | (.09) | |
|
|
1.12 * | 1.01 | 1.21 ** | 1.10 | .86 | .71 | 1.02 | .88 |
| (.08) | (.14) | (.09) | (.15) | (.18) | (.28) | (.34) | (.30) | |
|
|
1.28 * | 1.39 ** | 1.34 * | 1.41 * | 1.19 | 1.81 * | .29 * | 1.02 |
| (.17) | (.22) | (.20) | (.25) | (.28) | (.60) | (.19) | (.34) | |
|
|
1.17 ** | 1.52 *** | 1.18 ** | 1.60 *** | 1.13 | 1.63 * | 1.16 ** | 1.52 * |
| (.07) | (.17) | (.08) | (.18) | (.16) | (.44) | (.30) | (.37) | |
|
|
.99 | 1.01 | .99 | 1.01 | .97 ** | .99 | .96 | 1.06 * |
| (.01) | (.01) | (.01) | (.01) | (.01) | (.03) | (.03) | (.03) | |
|
|
.94 | .90 *** | .95 | .91 ** | .95 | .88 | 1.01 | .92 |
| (.03) | (.03) | (.03) | (.03) | (.05) | (.07) | (.08) | (.07) | |
|
|
1.00 | .99 | 1.00 | .99 | .99 | .98 | 1.01 | 1.01 |
| (.01) | (.01) | (.00) | (.01) | (.01) | (.02) | (.02) | (.02) | |
| N | 76 | 76 | 76 | 76 | 76 | 76 | 76 | 76 |
| Pseudo R2 | .11 | .05 | .11 | .06 | .08 | .03 | .15 | .06 |
| Log likelihood | –119.1 | –329.8 | –106.1 | –295.5 | –72.9 | –182.3 | –29.6 | –176.5 |
Notes: Incidence rate ratios with standard errors in parentheses;