
Abstract
A robot-assisted automated facility was established within a biosafety level 3 laboratory located on a university campus. A unique integration of a Genesis (TECAN) liquid handler into the SAGIAN Core System (Beckman-Coulter) enabled tube liquid handling and transfer of reagents from tubes to microplates. An automated enzyme immunoassay (ELISA) for detecting herpes B virus antibodies was developed. Repetition experiments of the automated ELISA and comparison to the manual ELISA demonstrated the efficacy and high reproducibility of the automated method. It is anticipated that research and education activities will benefit from the establishment of the automated diagnostic laboratory in an academic environment.
Keywords
Introduction
The B Virus (BV) Diagnostic Resource Laboratory has been serving the biomedical community since 1987. Since that time, over 200,000 tests have been performed to identify BV infected monkeys and humans. The laboratory is now part of the Viral Immunology Center at Georgia State University enabling daily interaction between the research and diagnostic laboratories. The diagnostic laboratory is currently relying on labor-intensive serological tests to detect BV infections in primates. All samples are screened for BV antibodies by a titration enzyme linked immunosorbent assay (tELISA) and positive results are then confirmed by competition ELISAs and by western blot analysis (Katz et al., 1986; Hilliard and Ward, 1999; Katz et al., 2002). The tELISA and the confirmatory assays are all based on virus-infected cell preparations that have to be prepared in large amounts in a biosafety level 4 (BSL4) facility. Virus antigens are prepared from the infected cells by detergent treatment followed by multiple quality control and standardization steps. This overall workload with potentially hazardous reagents and primate sera justified investment in an automated system for handling the laboratory's routine tasks.
Automation of assays can take different forms and principles, e.g., as in the simple lateral flow kits, in the more sophisticated and dedicated autoanalysers or in the form of integrated automated workstations assisted by robotics. Autoanalyzers are widely adopted by hospitals and many of them are applied for immunological assays. Roboticised workstations are widely used by pharmaceutical companies (Chan D.W., 1996).
In addition to solving safety issues for the BV laboratory it is hoped by applying automation, other benefits will be achieved that will increase accuracy and efficiency of the assays, reduce labor requirements, increase throughput, and reduce expenses and cost per assay (Chan D.W., 1996).
Here we report the establishment and performance of a unique setup of computer controlled integrated workstations for B virus diagnostic serology. To the best of our knowledge this is the first published report on a fully automated serological laboratory in an academic facility.
DESCRIPTION OF THE ROBOTIC-AUTOMATED SYSTEM AND PRELIMINARY VALIDATION STEPS
The robotic automated system was installed in a biosafety level 3 (BL3) laboratory. The negative pressure in the room ensures flow of air towards the absolute filters in the ceiling, thereby minimizing lateral aerosol spread. No other special containment measures were used since virus antigen preparations were considered non-infectious due to the detergent treatment. A spacious, 23'-1/2″x16'-15/8″ room accommodates the table with a 3 -meter robotic rail system and integrated workstations automated and controlled by a personal computer as outlined schematically in Figure 1. The system is unique since it is composed of a TECAN U.S. (NC) Genesis 150 liquid handler that was custom integrated into the BECKMAN-COULTER SAGIAN Core System by BECKMAN-COULTER (IN). All peripherals are linked together with the ORCA® Robotic Arm, SILAS™ Integration Software and SAMI® NT Method Development Interface. This unique integration of workstations enabled tube liquid handling and transfer of reagents from tubes to microplates.
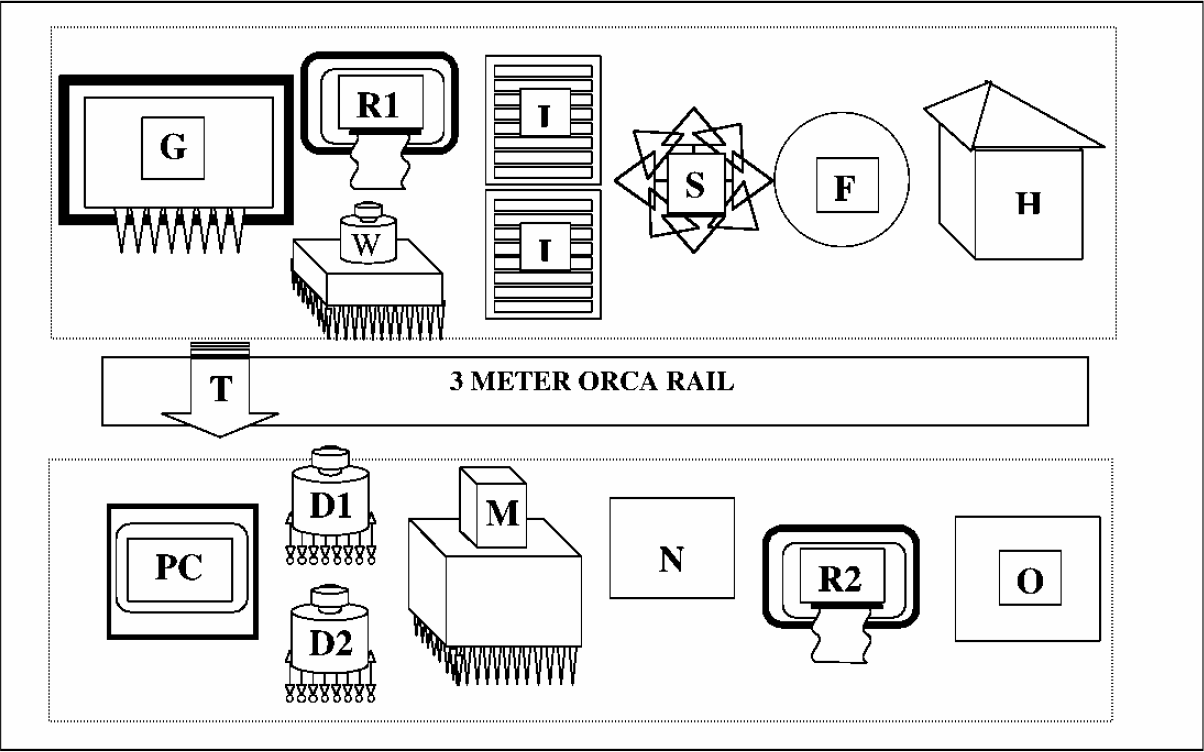
The custom integrated Tecan-Genesis Liquid Handler with Tube and Plate Bar-Code Readers (G) and the Beckman-Coulter SAGIAN integrated core components: The Wallac-Victor 1420 Multi-Label Microplate Reader (R1); The Elx405 Washer (W); Two 8-shelf Incubator (I); Microplate shaker (S); Microplate DeliddingStation (F); Hotels and Carousel (H) The 3 Meter ORCA Rail and the Robotic Transportation Arm (T); Personal Computer with NT-based software (PC); Multimek 96 pipettor (M); Two Mutidrop devices (D1 and D2); PolarStar Microplate Multilabel and Fluorescent Polarization Reader (R2); Tip Rack Delidding Station (N); A Multineck TipLift (O).
As part of the system set-up, validation procedures were carried out to assure that performance of each component on the deck is within the specification limits of the manufacturer. Since fixed tips were employed for the dilution and dispensing of standards and samples the accuracy of the Genesis liquid handling was considered to be the most important factor for determining the accuracy of the assay. The eight tips were used to dispense 15μl, 50μl and 100μl water per well to three separate plates. Plates were weighed before and after dispensing. The calculated theoretical weights of the volumes delivered were compared to the actual weights. The respective accuracies fort delivering 15μl, 50μl and 100 μl were: 96.53%, 98.96% and 99.35%. As expected lower volumes resulted in lower accuracy. The coefficient of variation (CV) between each of the eight tips was very low (μ0.28%) confirming the high accuracy of the TECAN-Genesis Liquid Handler.
Two basic programs, one for automatic coating of ELISA plates and the second for the automation of the titration ELISA (tELISA) were written using the SAMI NT (Beckman-Coulter) and the Gemini (TECAN) softwares. The programs were run successfully in model formats in which water was used instead of real reagents.
DEVELOPMENT OF THE ROBOT-AUTOMATED TELISA
1. AUTOMATION OF ANTIGEN ADSORPTION TO MICROWELLS
The current manual tELISA for detection of B virus antibodies is carried out in microplates coated with detergent-treated B virus antigens (BV) and detergent treated mock-antigens that are prepared from uninfected vero cells (UN). According to this routine (manual) procedure of the diagnostic laboratory, microplates are coated with antigens by using a 20 minute adsorption procedure that includes a short 12 minute centrifugation step in the presence of picric acid (Katz et al., 1986). Since the centrifugation step is not compatible with the automation system other ways to adsorb the antigen were explored.
In the following experiment, three types of adsorption procedures were compared to the routine manual centrifugation procedure: 1) 20 minute adsorption at room temperature (RT); 2) one hour adsorption at RT and 3) overnight (ON) adsorption at 4°C. All antigens were adsorbed in the presence of 60% picric acid. These three procedures were performed by the robotic-system. The adsorption efficacy was tested by running a titration of a standard anti-B virus serum pool on the adsorbed BV and UN antigens. Results for the anti-BV serum titration, summarized in Figure 2, indicate that the type of technique used for the antigen adsorption procedure had no significant effect on the outcome of the standard serum titrations.
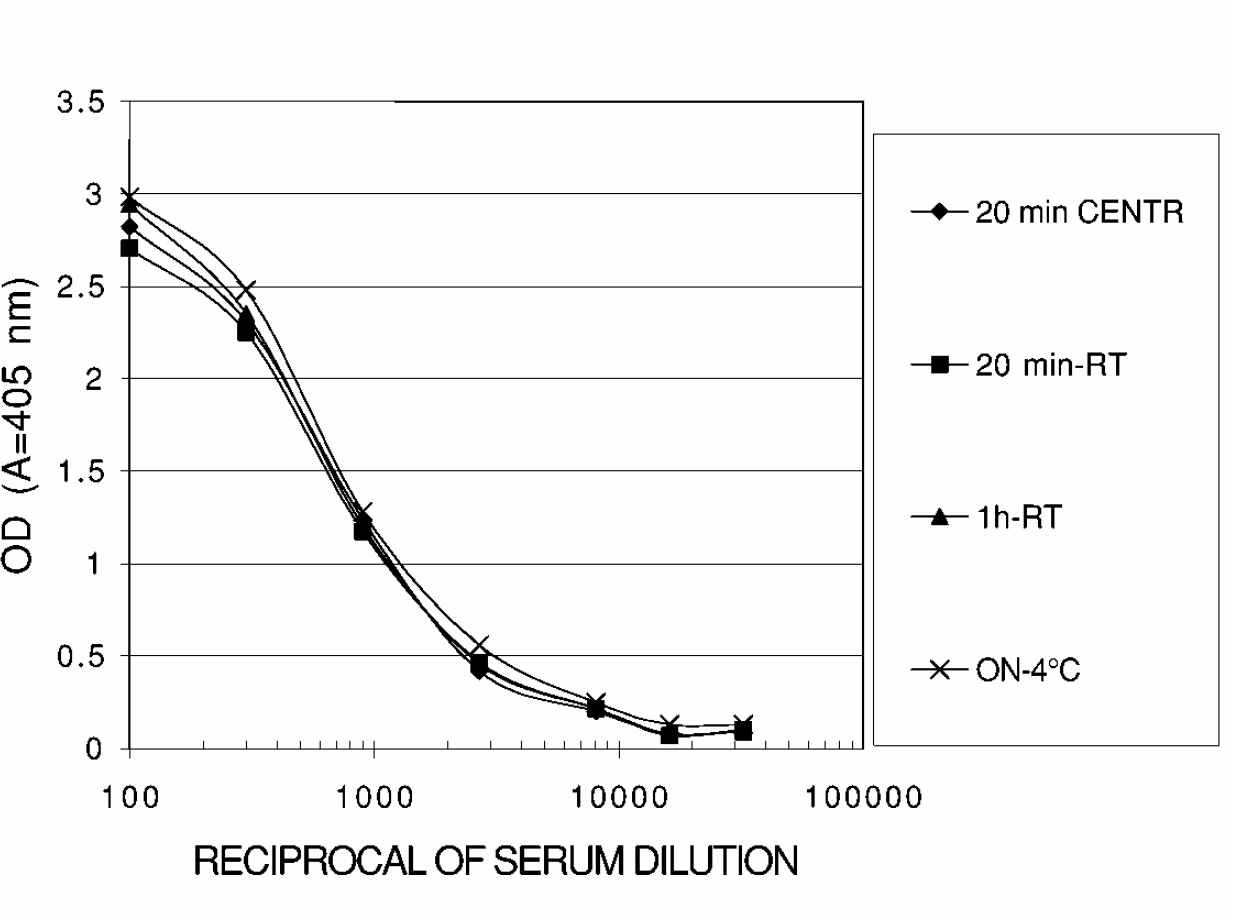
Comparison of microplate-coating procedures: A standard anti-BV serum was run on plates coated with BV antigens by four different procedures: 20 min centrifugation (CENTR), 20 min-room temperature (RT), 1h-RT and overnight (ON) at 4°C.
In addition, four standard control serum specimens, three with predetermined high, medium and low levels of anti-B virus antibodies and one “negative” with no antibodies to herpes viruses, were tested each at a 1:5 and 1:100 dilutions on the adsorbed BV and UN antigens. Results obtained with the “Negative”, “High”, “Medium” and “Low” control sera (not shown) indicate as well that the simple 20 minute incubation at room temperature is as efficient as the other adsorption procedures. It was therefore concluded that this method can replace the more complicated centrifugation method. The automated technique for preparing BV and UN antigen coated microplates was carried out as follows: The antigens were dispensed from separate troughs by the Gemini liquid handler to a microplate. The microplate was transported by the robot to the Multidrop for addition of picric acid and then transported to the shaker for 20 minute at room temperature. The plate was then transported to the washer and then to the Multimek-96 tip dispenser for dispensing the blocking solution. From there, the plate was transported to the “hotel” for ON incubation at room temperature. After this incubation period the plate was washed again, transported to the hotel and removed for storage at −70°C until used. Plates were lidded for transportation and incubation and delidded for liquid handling by the microplate lidding and delidding station. The automated procedure enables preparation of 50 coated microplates in less than six hours.
2. PREPARATION OF STANDARD CURVES AND TRANSFER OF REAGENTS FROM TUBES TO MICROPLATES USING AUTOMATION
An essential, time consuming and labor intensive part of the tELISA is preparation of the dilutions of the standard serum and their distribution to test plates. Another important step is the preparation of the 1:5 and 1:100 dilutions of test samples and of the “High”, “Medium”, “Low” and “Negative” controls and their distribution to the test plates.
In the next experiment the Genesis liquid handler was programmed to perform “tube to tube” dilutions (1:100, 1:300, 1:900, 1:2700, 1:8100, 1:16200, 1:32000) of the standard serum. The following automation steps were involved in this procedure: Dilutions in tubes were prepared by Gemini and transferred to the appropriate BV and UN coated wells of the pre-coated microplate. The microplate was then transported by the robotic arm for incubation at 37° C for one hour and then transported to the washer. Results for Figure 5 were obtained by adding goat anti-human IgG - alkaline phosphatase to the appropriate wells and by an additional incubation of the plate at 37° C for one hour. The plate was washed, transported to Gemini for the addition of the substrate and then transported to the hotel for 30 minutes incubation at room temperature. After stopping the reaction at the Gemini workstation by adding 5 N NaOH, the plate was transported to the ELISA colorimetric reader for reading results. Plates were lidded for transportation and incubation and delidded for liquid handling and reading by the microplate lidding and delidding station.
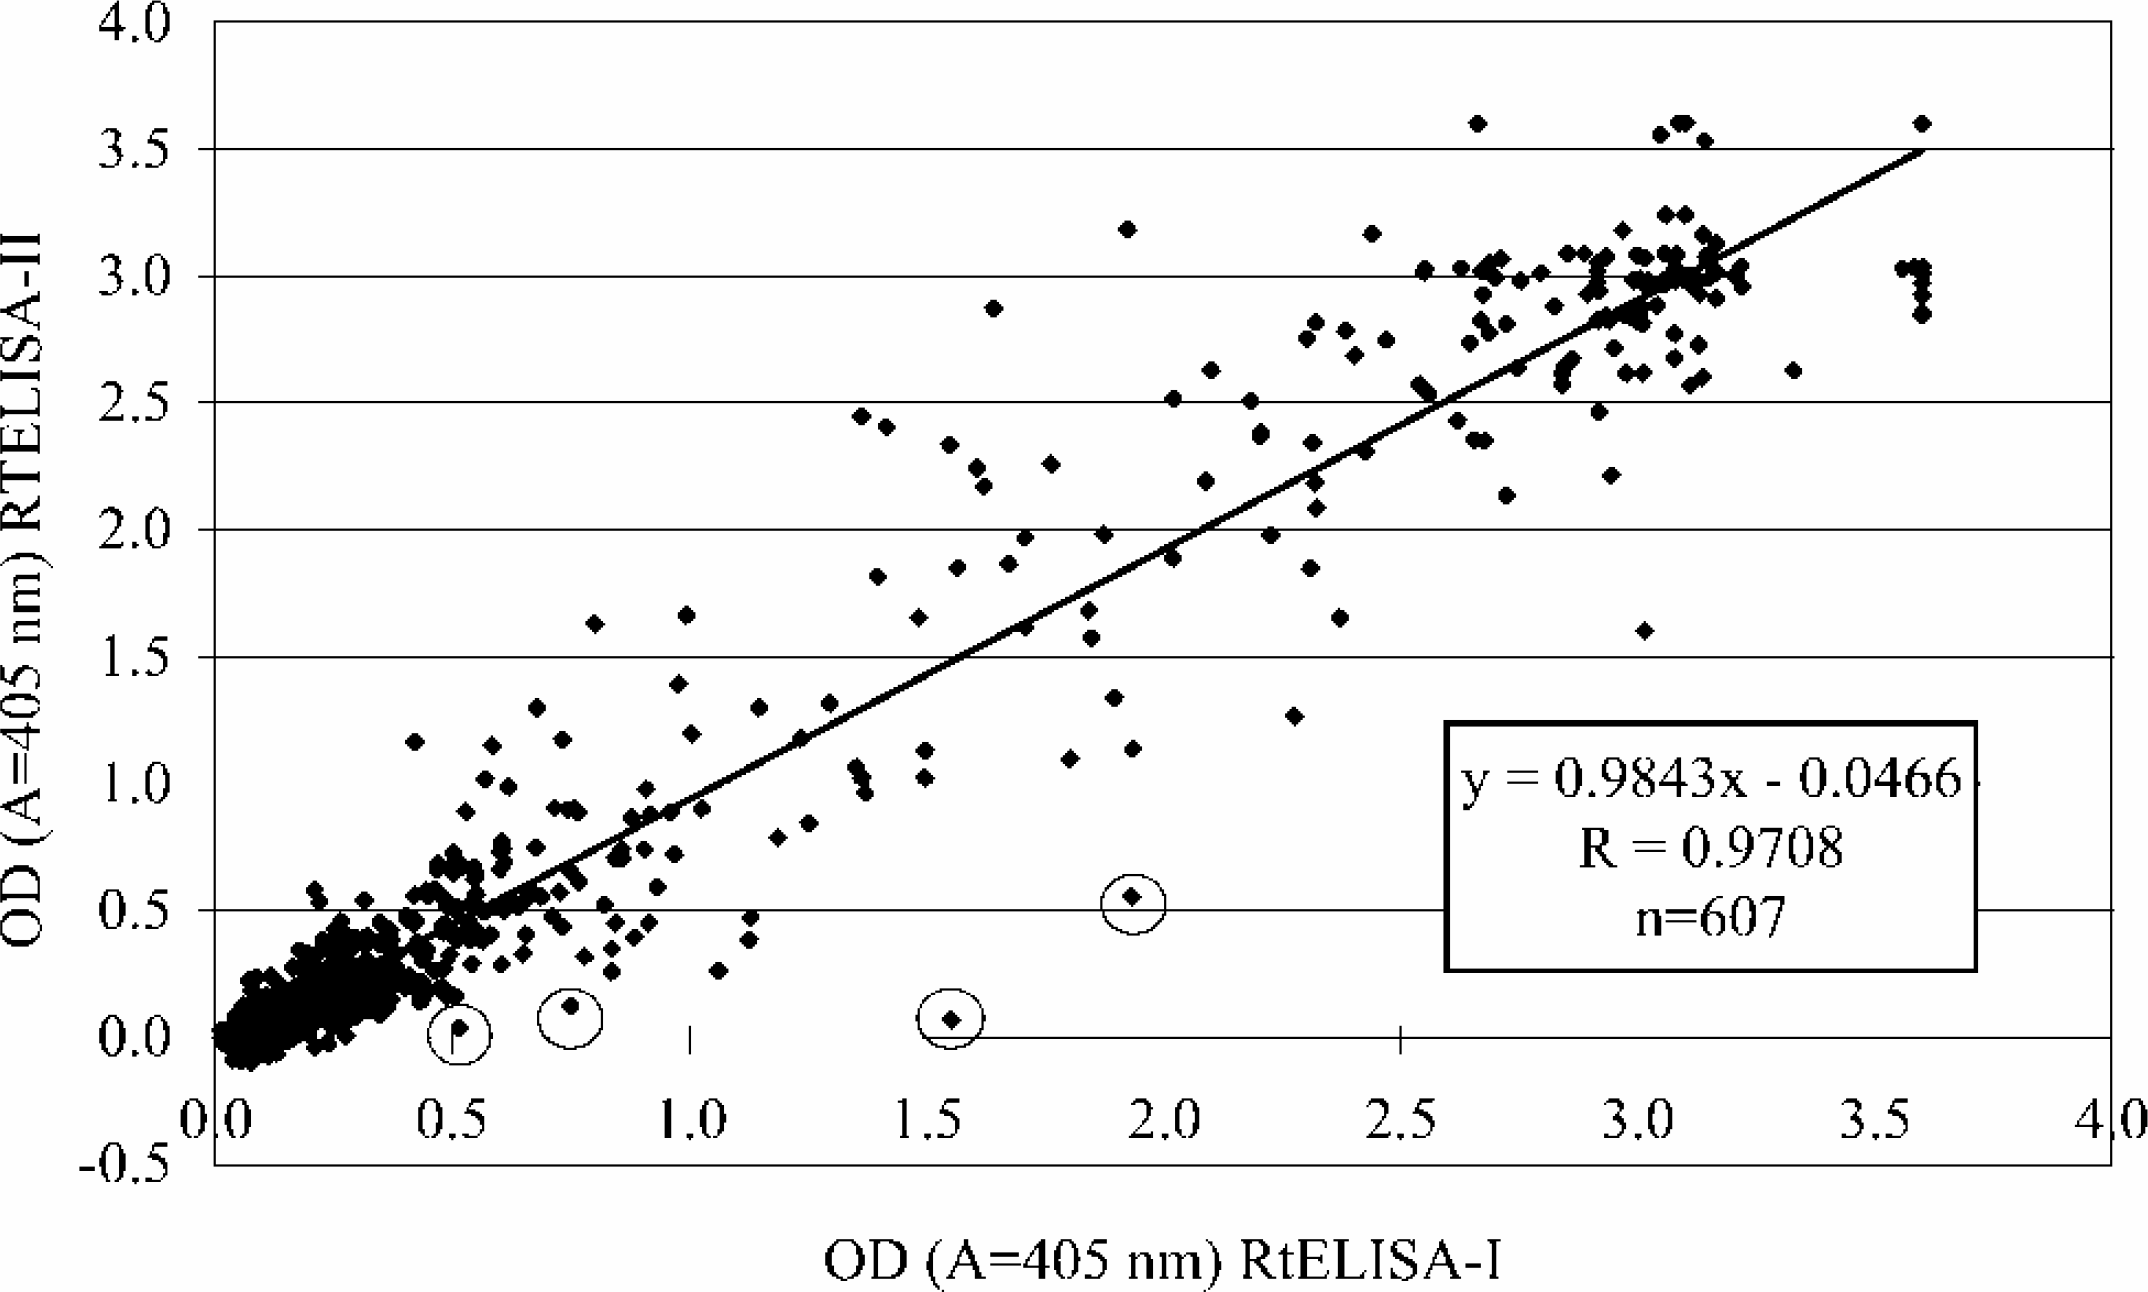
Regression analysis of OD values obtained by the RtELISA-I versus OD values obtained by the RtELISA-II. Values include data from 100 serum samples run at 1:5 and 1:100 dilutions and all standard sera and positive and negative controls (n=607 per run). Prominent “outliers” are circled.
For comparison, similar dilutions were prepared manually from the same source of standard serum pool. The two series of dilutions were then tested in duplicates in the robot-automated tELISA. The results of the comparison of robot-automated dilutions (R-dilutions) to manual dilutions (M-dilutions) are summarized in Figure 3. As shown in Figure 3, the automated dilution procedure was superior to the manual procedure since it resulted in higher specific responses (higher OD values and lower background), and was less variable as indicated by the relatively lower standard deviation values. It is possible that the differences obtained are related to the inaccuracy of the manually-operated pipettes. However, this is only an assumption, since the accuracy of the manually technique was not established for this experiment.
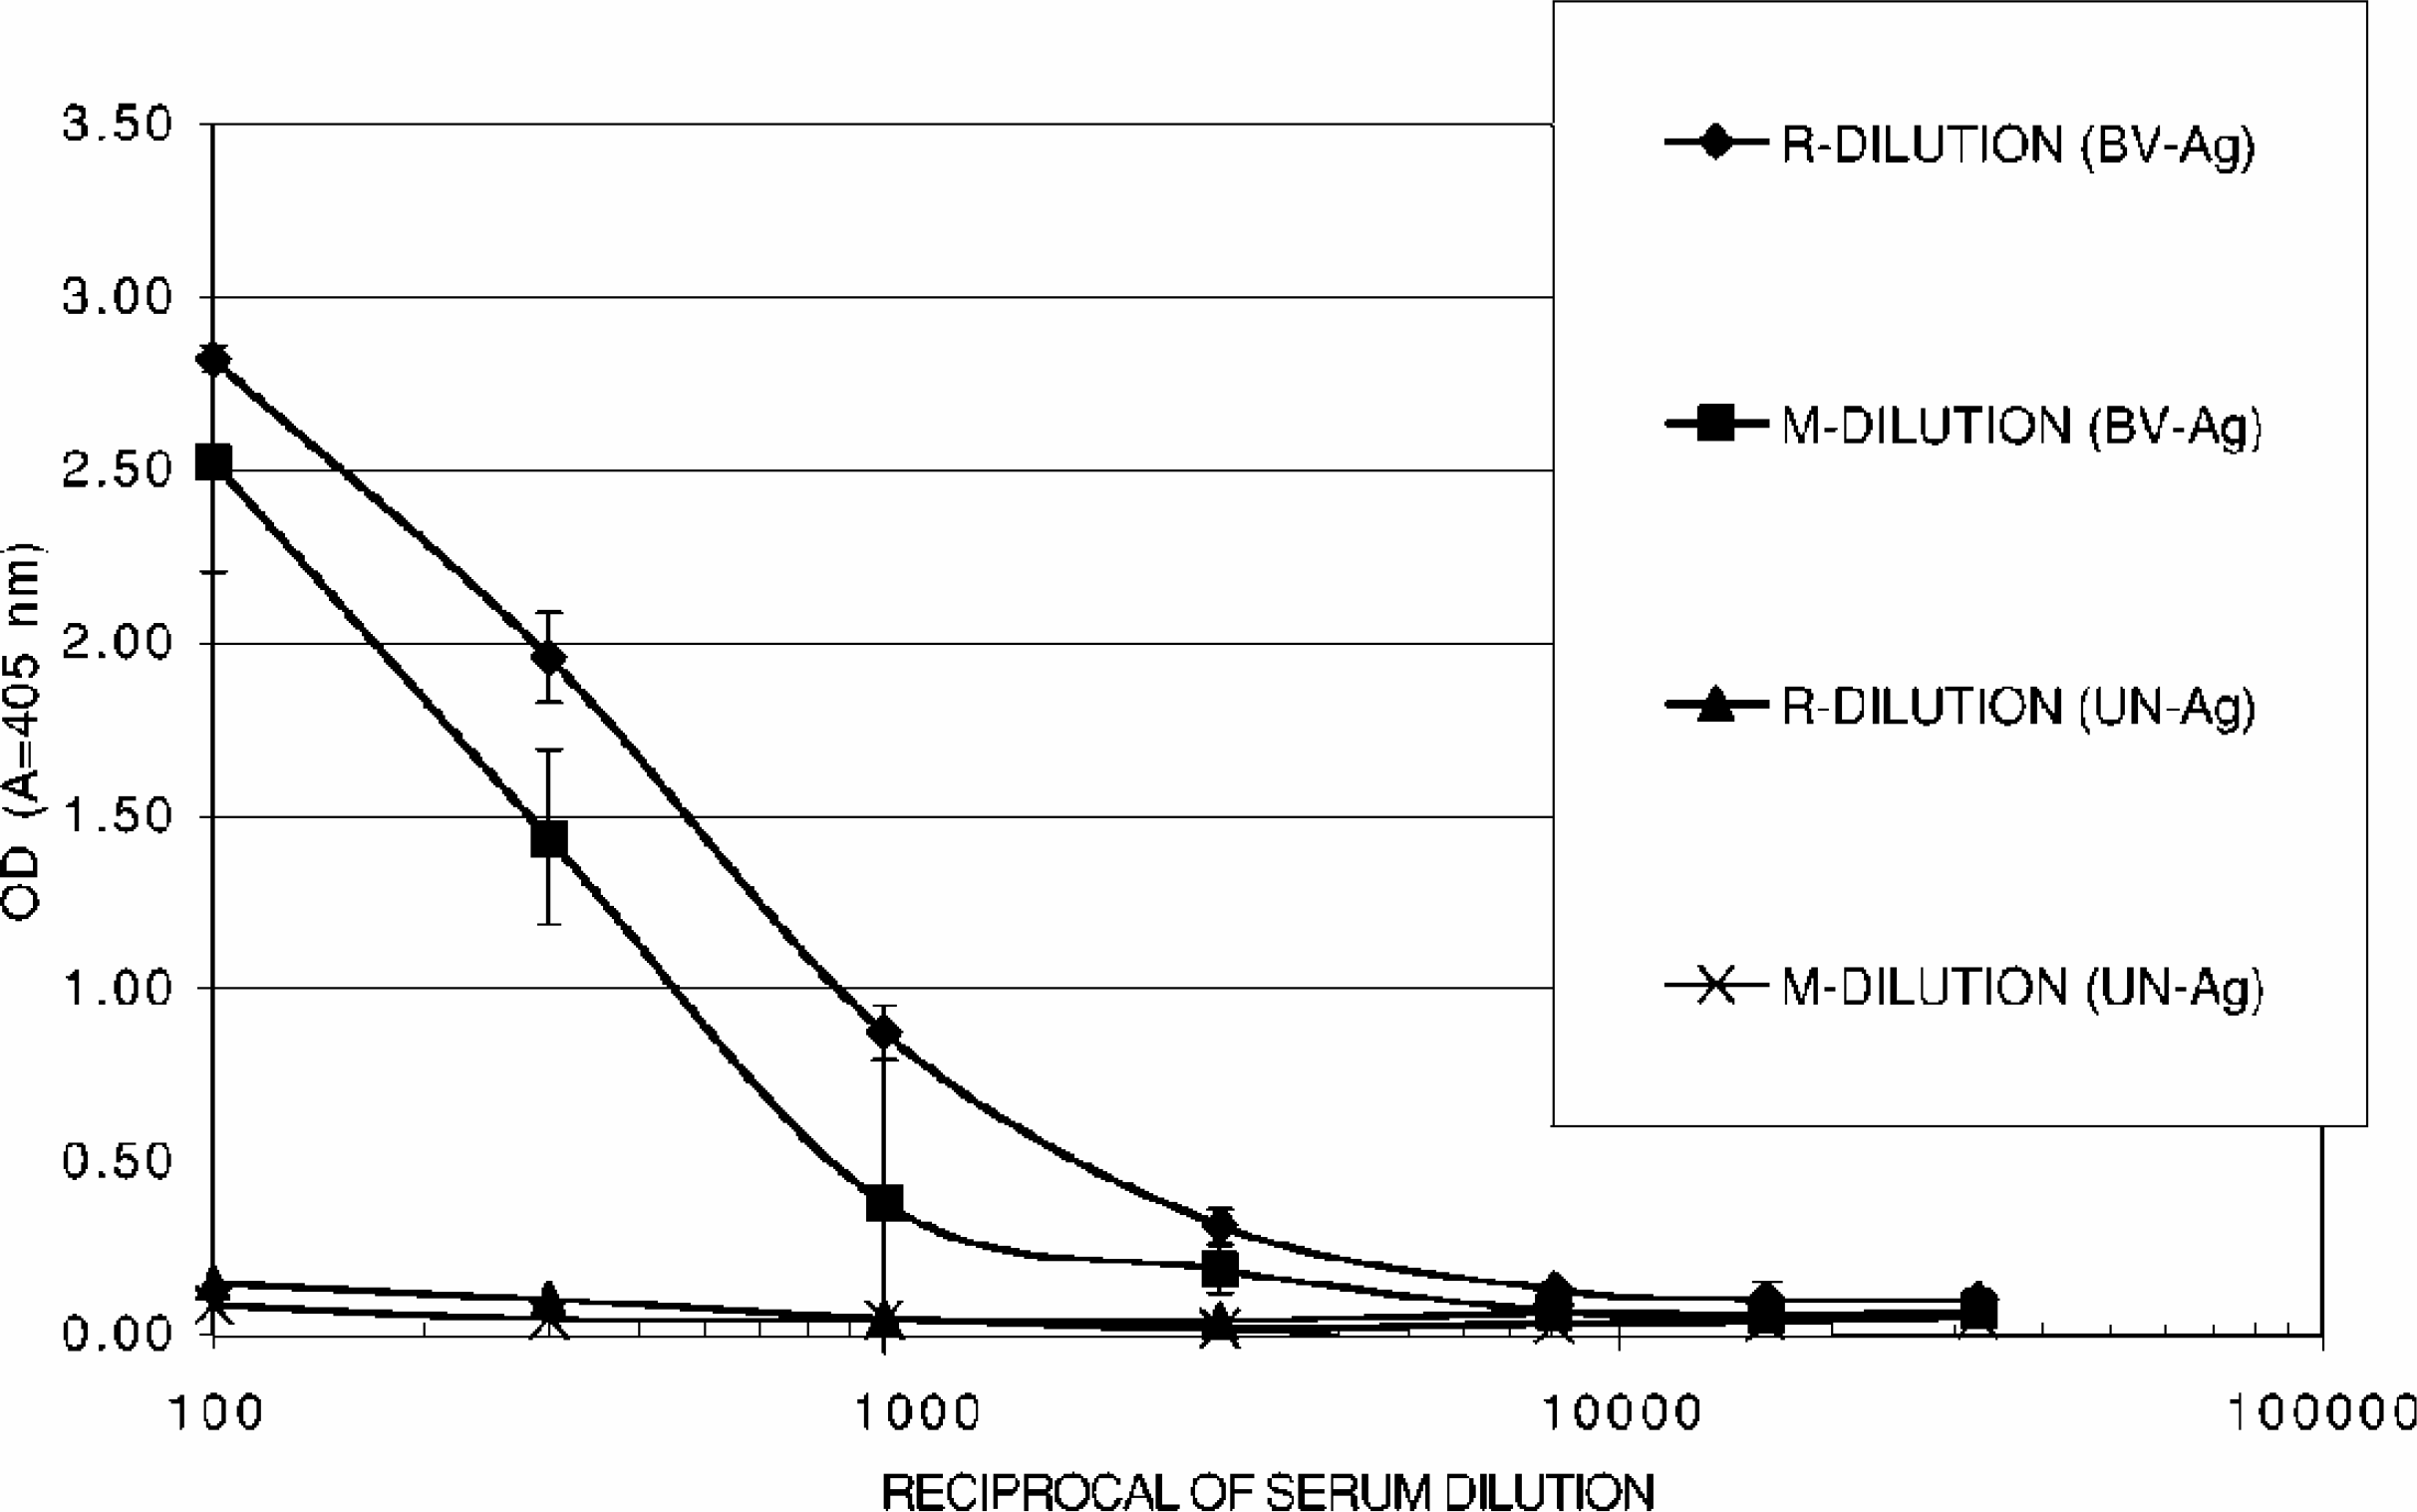
Comparison of the automatic dilution procedure (R-DILUTION) to the manual dilution procedure (M-DILUTION) for preparing the anti-BV standard curve. The serial dilutions were tested on wells coated with BV antigens and UN antigens (BV-Ag) and UN-Ag), (Bars indicate standard deviations).
PERFORMANCE OF THE ROBOT-AUTOMATED TELISA
A program was written using the Gemini (Tecan) and Sami (Coulter-Beckman) softwares for carrying out the robot-automated tELISA (RtELISA) in a format that was similar to the diagnostic laboratory format. The automated procedure is schematically described in Figure 4. In this format, seven dilutions of a standard serum (1:100, 1:300, 1:900, 1:2700, 1:8100, 1:16200, 1:32000) and the 1:5 and 1:100 dilutions of the “High”, “Medium”, “Low” and “Negative” controls were run along with the 1:5 and 1:100 diluted test samples. A total of 16 test samples can be tested in one plate. Titers of test samples tested and controls were calculated from six dilutions of the standard curve (1:300–1:16200) as previously described (Katz et al., 1986; Katz et al, 2002).
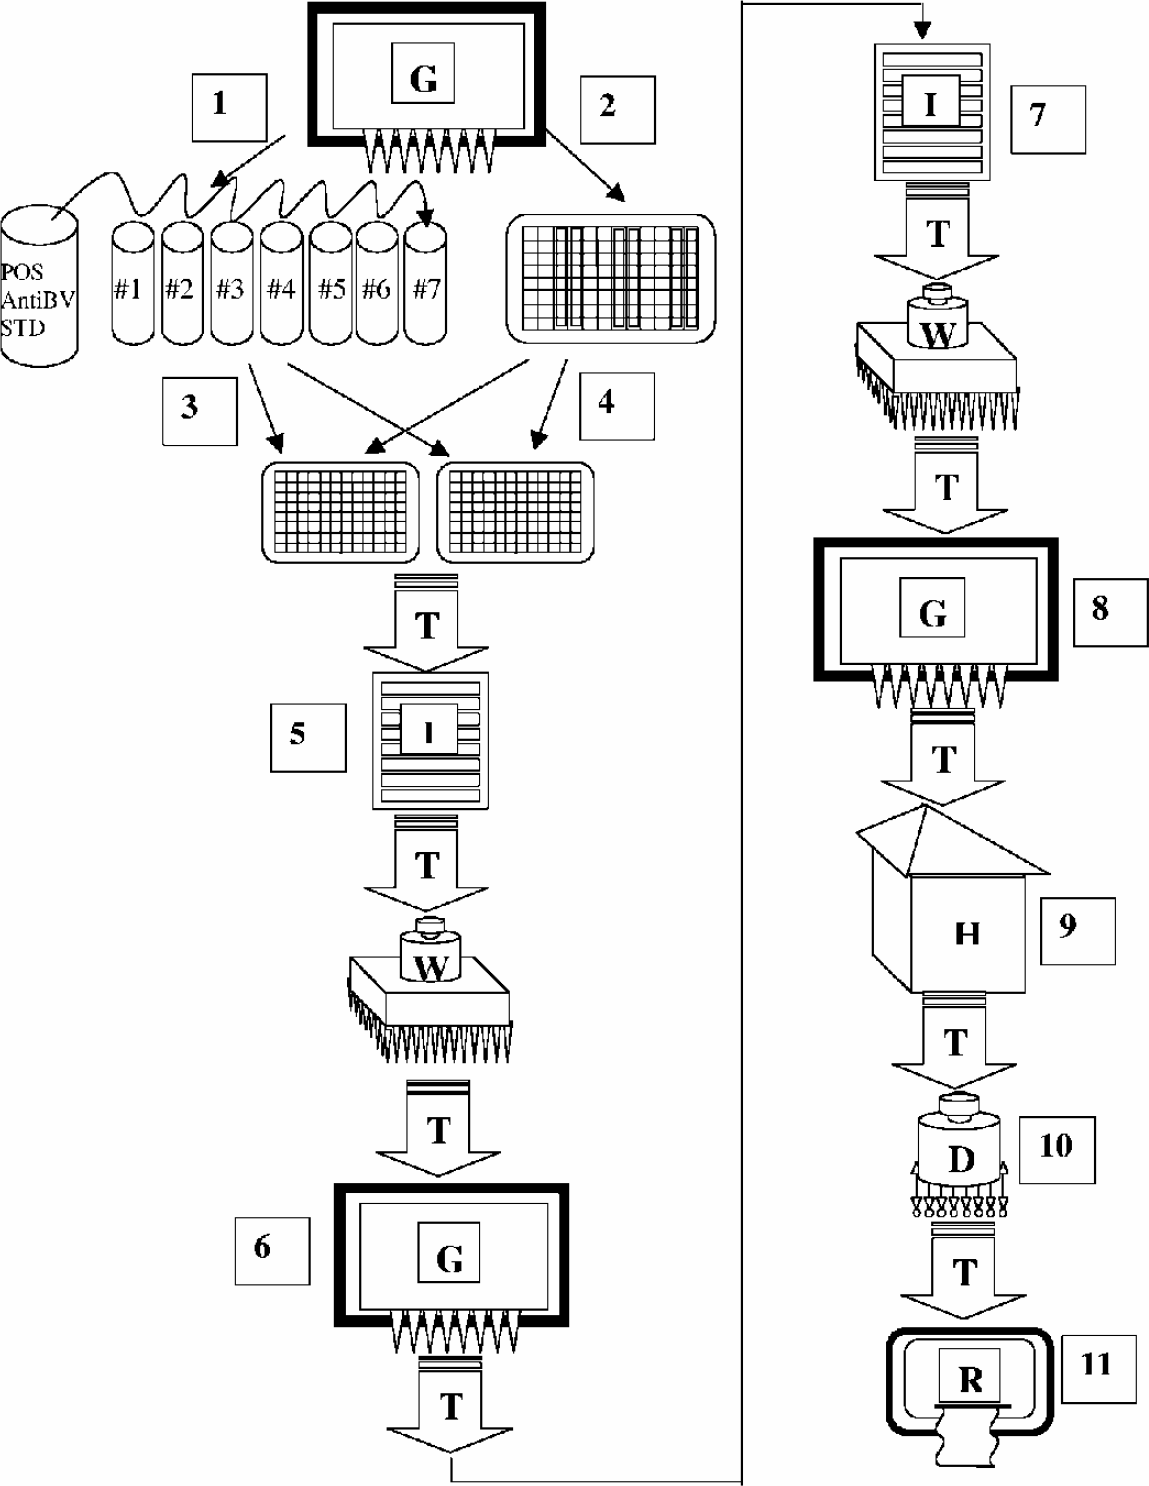
Flow-chart for automatic procedure of the RtELISA. (Symbols are as in Fig. 1). For each tELISA a series of dilutions of the standard positive serum is prepared by the Gemini liquid handler (G) (1). The “High”, “Medium”, “Low” and “Negative” controls and the test samples are all diluted 1:5 and 1:100 in a “source” or “mother” round-bottom non-adsorbent microplate (2). Aliquots from the tubes containing the dilutions of the standard and from the “source” plate are transferred by Gemini to the test (daughter) plates. Each “mother” plate serves 2 test plates (3 and 4). From this point on, test plates are transported through a series of workstations essentially as describe in Fig. 4. This includes the incubation of sera (5) addition and incubation of the anti human IgG alkaline phosphatase conjugate (6 and 7), addition and incubation of the substrate (8 and 9), stopping the enzymatic reaction with NaOH (10) and reading the results (11). Plates were lidded for transportation and incubation and delidded for liquid handling and reading by the lidding and delidding station (F in Fig. 1).
1. REPRODUCIBILITY OF THE RTELISA
One hundred coded samples that were previously titrated manually by the diagnostic laboratory were provided for titration by the RtELISA. Six and a half plates were necessary to run the 100 samples at the 1:5 and 1:100 dilution. The whole run was completed in about four hours and 45 min (not including the time for coating plates).
Two cycles of RtELISA runs (RtELISA-I and RtELISA-II) were executed on two different days (seven days apart) for validation purposes. This enabled estimation of “within-run” and “between-day” reproducibility of the RtELISA. The overall correlation of 607 out of the 610 specimens that were run in the 2 RtELISAs are shown in Figure 5. The regression analysis indicated very good correlation between the 2 RtELISA runs (R=0.97). Very few discrepancies (“outliers”) were observed in which the OD values were lower in the RtELISA-II run and higher in the RtELISA-I run (see circles). The slope value was close to 1.0 (0.98) indicating the similarity of the OD values in the two runs.
“Within-run” variations were established by examining the seven standard sera titrations and the seven sets of “High”, “Medium”, “Low” and “Negative” controls that were repeated in each of the seven plates for each of the 2 RtELISA runs. The “within-run” reproducibility for each of the RtELISAs was similar, as demonstrated by similar CV values. The CV values for RtELISA I were 10%, 7% and 10% for the 1:5 diluted High, Medium and Low controls, respectively and 33%, 38% and 31% for the 1:100 diluted High, Medium and Low controls, respectively. The CV values for RtELISA II were 4%, 6% and 4% for the 1:5 diluted High, Medium and Low controls, respectively and 28%, 31% and 30% for the 1:100 diluted High, Medium and Low controls, respectively. Negative controls in both RtELISA runs resulted in OD values of 0.1 or lower, but showed very high variability (CV higher than 60%). No apparent differences between the mean OD values of the High, Medium, Low and Negative controls in each of the 2 RtELISA repetitions were observed, indicating a relatively high “between-day” reproducibility.
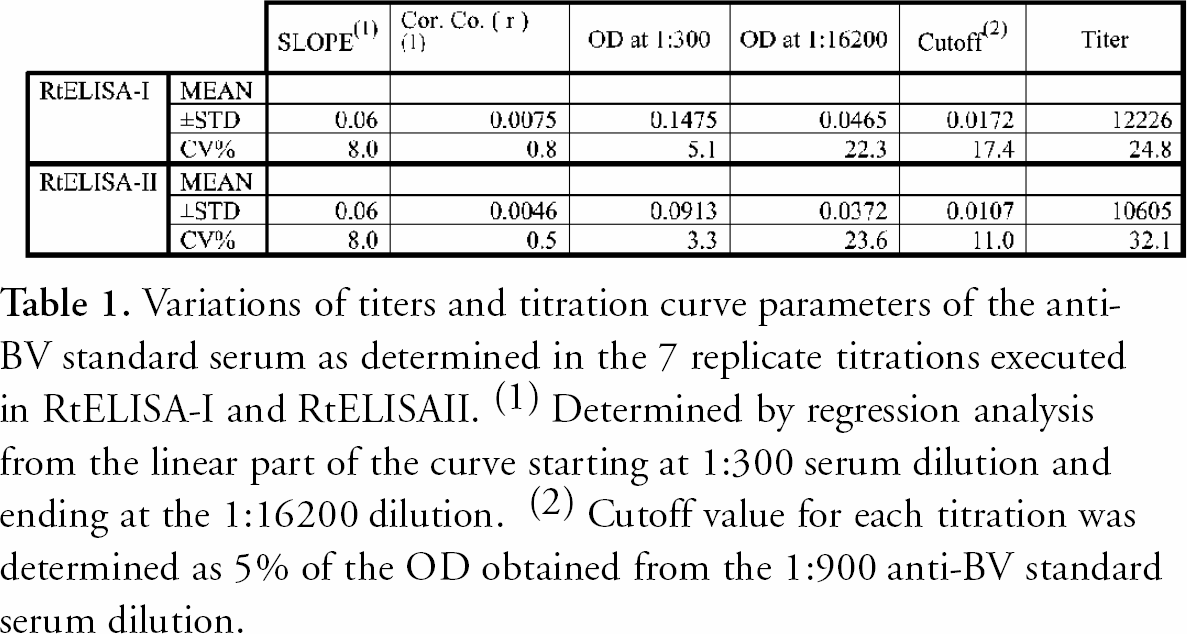
The mean OD values and the standard deviations (SD) of the anti-BV positive standard-serum replicate titration curves (n=7) in each RtELISA-run were analyzed. Similar mean OD values were obtained in the two separate runs indicating acceptable “within-run” and “between-day” reproducibilities. Higher dilutions that result in lower OD values were more variable than the lower dilutions that resulted in higher OD values. The CV values ranged from less than 10% for the 1:100 and 1:300 dilutions to 25% or more for the higher dilutions. (Table 1). B virus antibody titers, in ELISA units per 50 μl (EU/50 μl) were determined from each of the titration curves as previously described (Katz et al., 2002). The titers and other parameters that were determined by regression analysis of each curve are summarized in Table 1. The mean titers were of the same order of magnitude for both RtELISAs and so were the CV values for each run (24.8% for RtELISA-I and 32.1% for RtELISA-II). Means of slope and R (correlation coefficient) values were also very similar for the first and second RtELISA runs (Mean slope values: −0.71 and −0.78; R values: −0.985 and −0.933). The CV values for these parameters were also similar (for slope values: 8.0% and 8.0%; for R values: 0.8% and 0.547%, respectively). The relatively high CV values of the titers correlate with the relatively high CV values of the slopes and even more so with the high CV values of the last dilution used to generate the regression line − 1:16200. This is consistent with previous findings showing high imprecision for low OD values. These low OD values, an inherent part of the titration method, influenced the slope of the curves and thereby the relative imprecision of titer determinations. The “between-day” mean titer and CV was 41,1114 EU/50μl and 27.8 %, respectively (similar to the “within-run” CVs).
Variations of titers and titration curve parameters of the anti-BV standard serum as determined in the 7 replicate titrations executed in RtELISA-I and RtELISAII. ( 1 ) Determined by regression analysis from the linear part of the curve starting at 1:300 serum dilution and ending at the 1:16200 dilution. ( 2 ) Cutoff value for each titration was determined as 5% of the OD obtained from the 1:900 anti-BV standard serum dilution.
Titers were also calculated for the 100 serum samples as well as for the High, Medium and Low positive controls. The titers obtained from the 2 RtELISA runs were compared by regression analysis as shown in Figure 6. Negative samples, based on “Positive” to “Negative” ratios (P/N) <2.0 were assigned a “0” value. Titers higher than 15,000 EU/50 μl were considered outside the limits of measurability and were assigned an arbitrary value of 15,000.
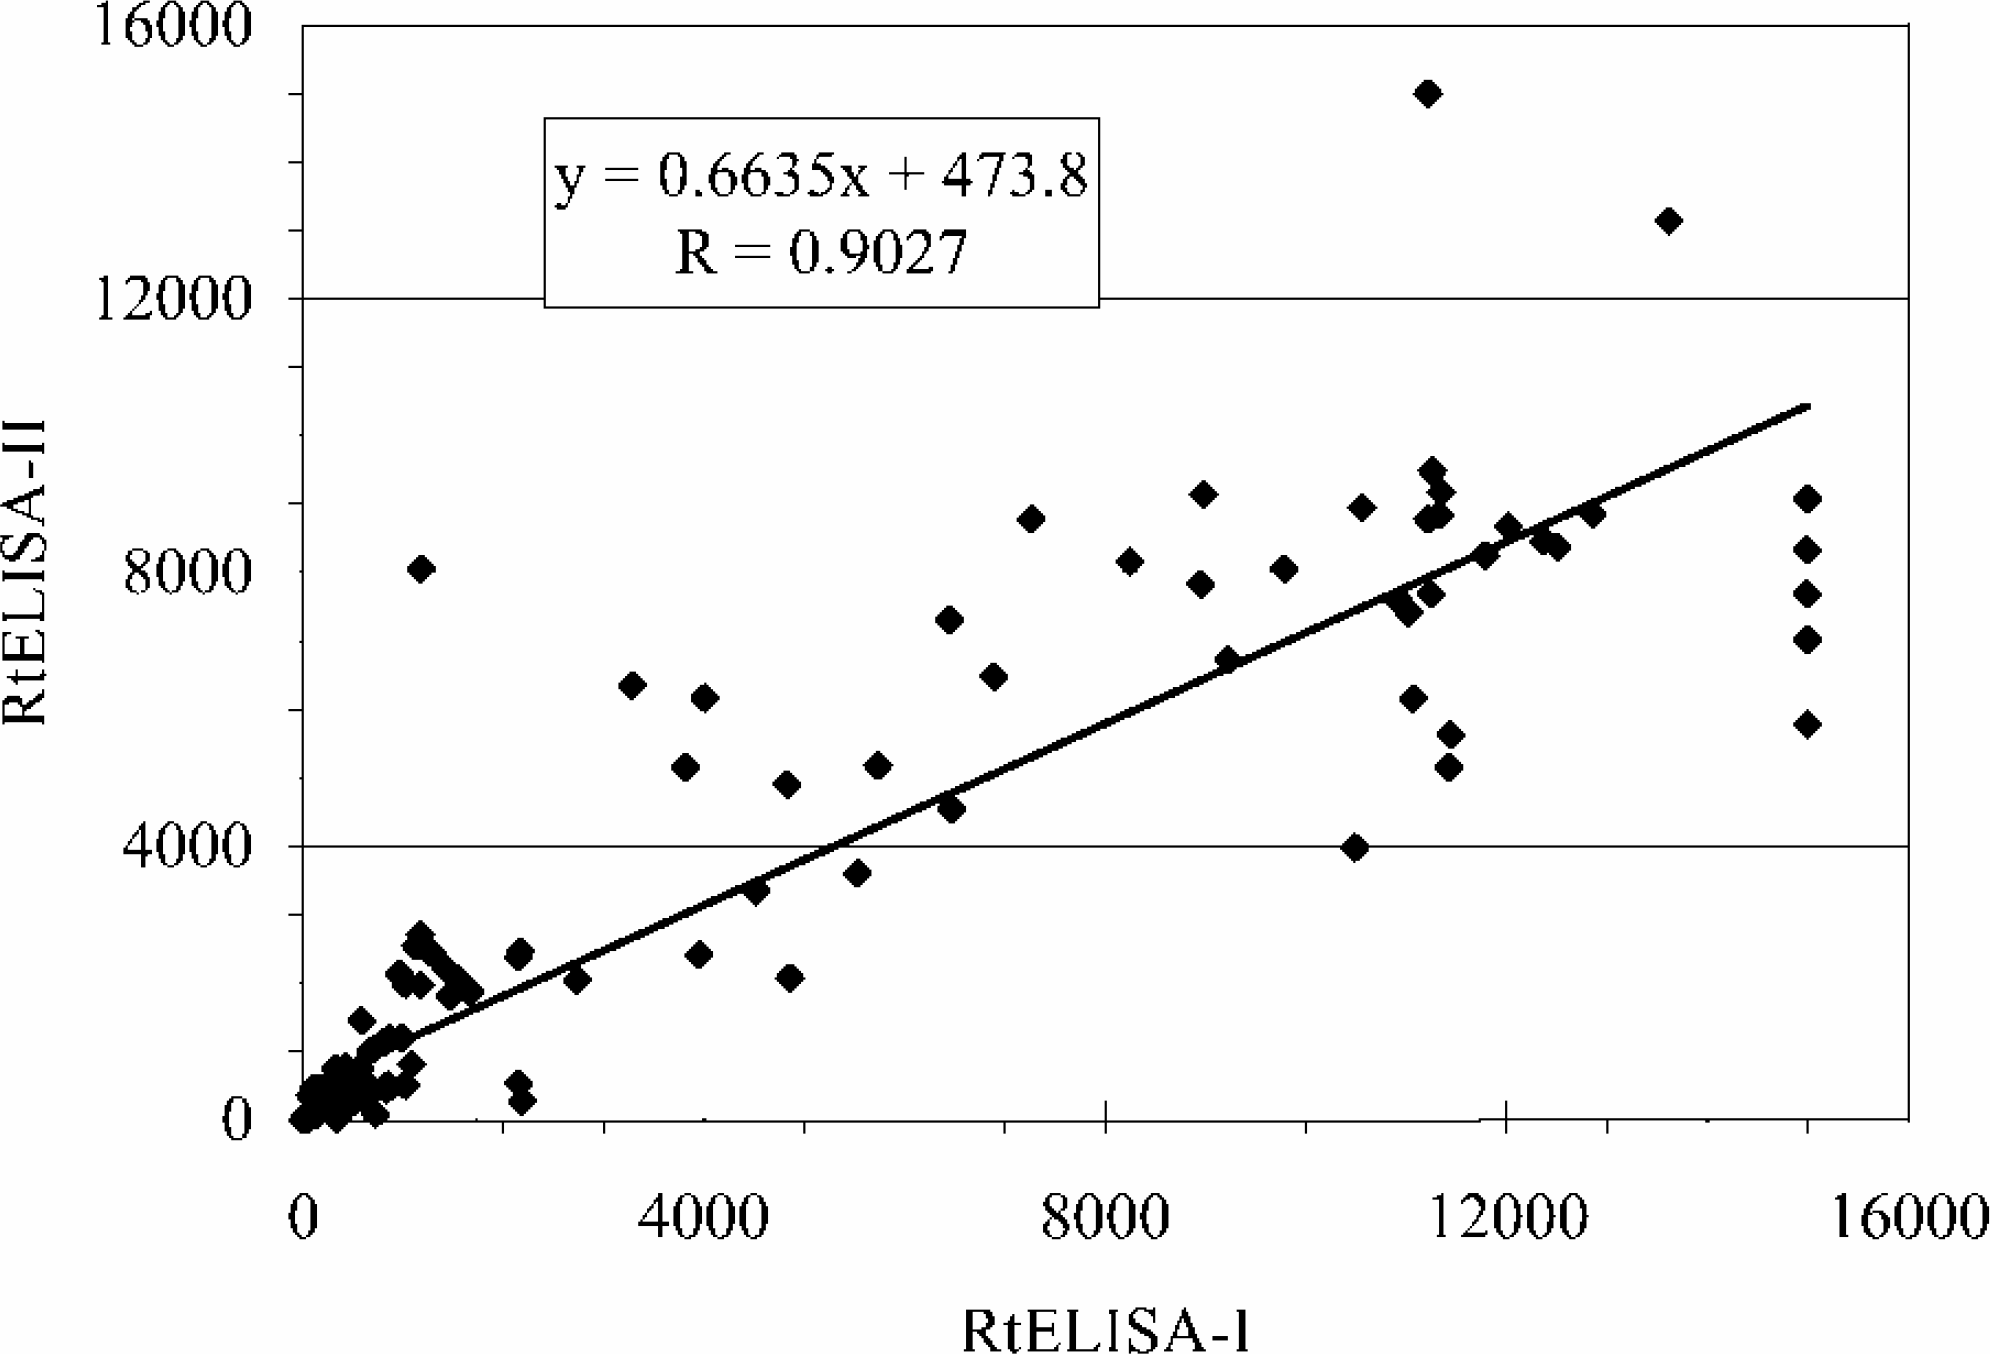
Regression analysis of titer values (EU/50μl) obtained by the RtELISA-I versus titer values obtained by the RtELISA-II. Values include titers of the standard serum, of the positive and negative controls and of the 100 serum samples. The total number of titer determinations from each RtELISA run was 128.
Results show a good correlation between the titers that were determined by the two RtELISA runs (R=0.90). As expected, titers were more variable than OD values (see Fig. 5 for comparison with OD values).
2. SUMMARY OF THE DEGREE OF AGREEMENT BETWEEN THE 2 RTELISA REPETITIONS
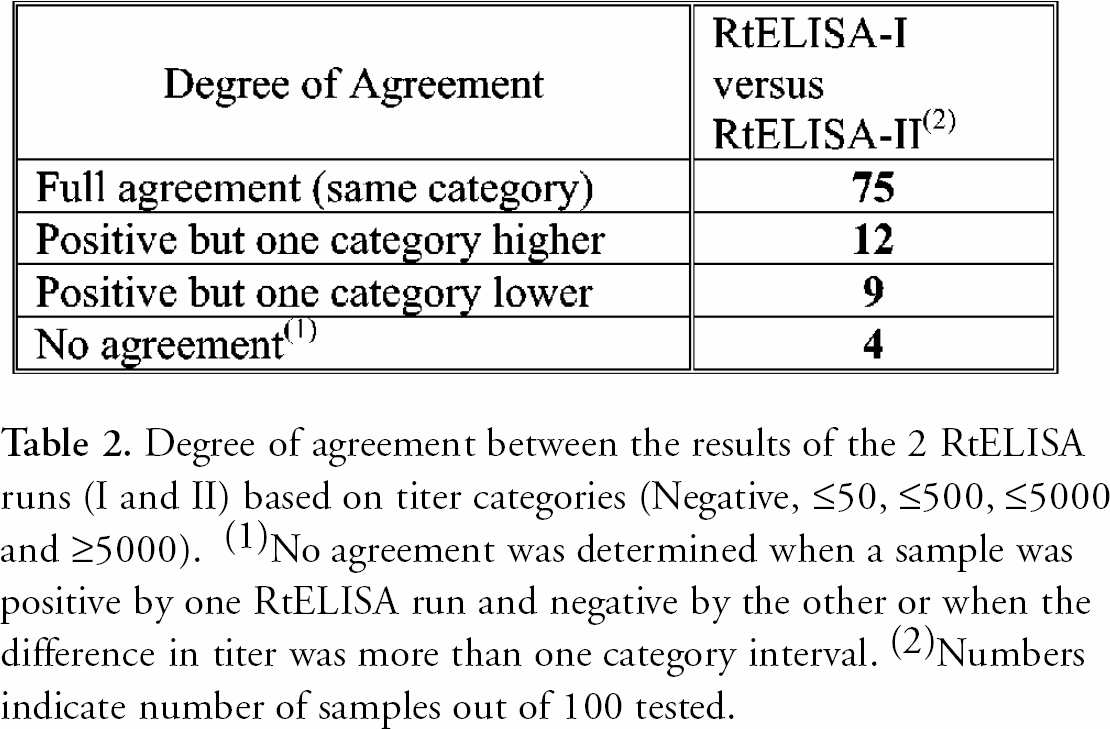
Serological results are reported by the diagnostic laboratory as titer categories rather than absolute titers. This procedure simplifies presentation of results without losing their diagnostic value for human or veterinary medical decisions. The following titer categories are used: Negative, ≤50, ≤500, ≤5000 and ≥5000. Based on this classification of titer categories, the degree of agreement between the 2 RtELISAs is summarized in Table 2. Total agreement was obtained for 75 % of the samples. 21% of the samples were positive by both runs but were either one category lower or one category higher. For 4% of the samples there was no agreement between the 2 RtELISA runs. These samples were either positive by one RtELISA and negative by the other, or were positive by both runs but their titer differed in more than one category interval. When classified in “negative” (P/N <2.0) or “positive” (P/N ≥2.0) groups the total agreement between the 2 RtELISA runs was 97%.
Degree of agreement between the results of the 2 RtELISA runs (I and II) based on titer categories (Negative, ≤50, ≤500, ≤5000 and ≥5000). ( 1 )No agreement was determined when a sample was positive by one RtELISA run and negative by the other or when the difference in titer was more than one category interval. ( 2 )Numbers indicate number of samples out of 100 tested.
3. SUMMARY OF THE DEGREE OF AGREEMENT BETWEEN RESULTS FROM THE ROBOTIC LABORATORY AND RESULTS FROM THE DIAGNOSTIC LABORATORY
Since there was a good general agreement between the robotic laboratory (Rob-Lab) runs, results from the RtELISA-II run were compared to the results of the B virus diagnostic laboratory (Dx-Lab). For comparison, results were classified in the 5 titer categories as shown above (Negative, ≤50, ≤500, ≤5000 and ≥5000). Results of the comparison are shown in Table 3.
Degree of agreement between the RtELISA II and diagnostic laboratory (Dx-Lab) results based on titer categories (Negative, ≤50, ≤500, ≤5000 and ≥5000). ( 1 )No agreement was determined when a sample was either positive or negative by RtELISA or Dx-Lab, or when the difference in titer was more than one category interval. ( 2 )Numbers indicate number of samples out of 100 tested.
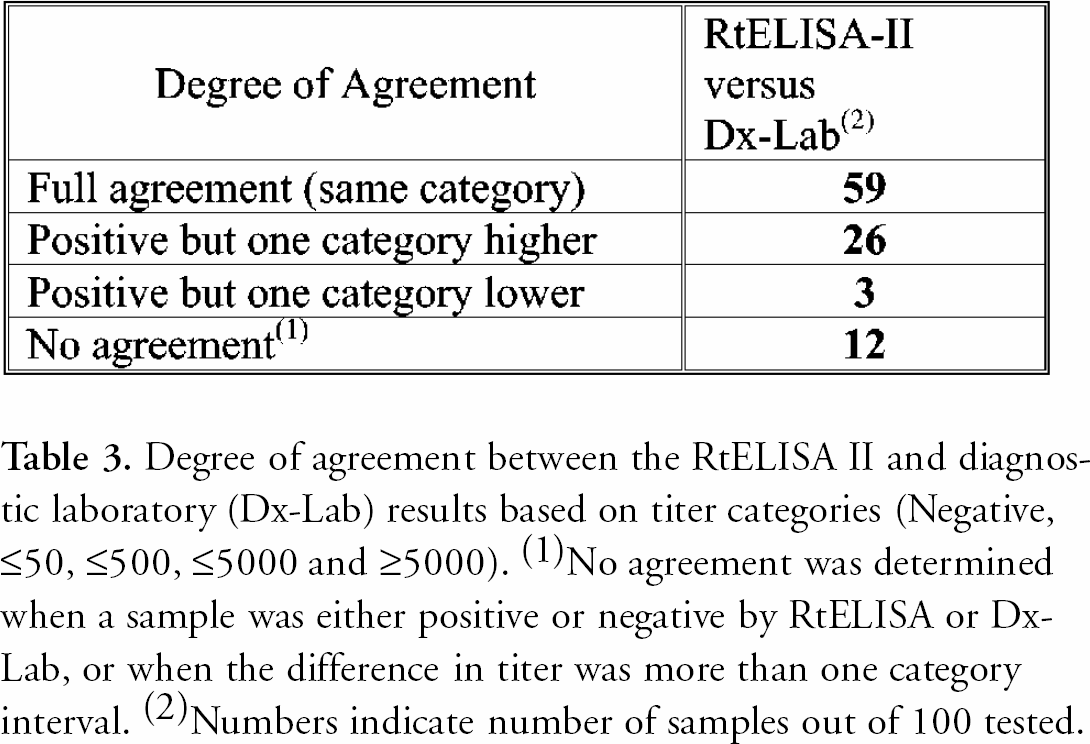
Results from the robotic and diagnostic laboratories agreed in 59 % of the samples. 31% of the samples were positive by both runs but were either one category lower or one category higher. For 12% of the samples there was no agreement.
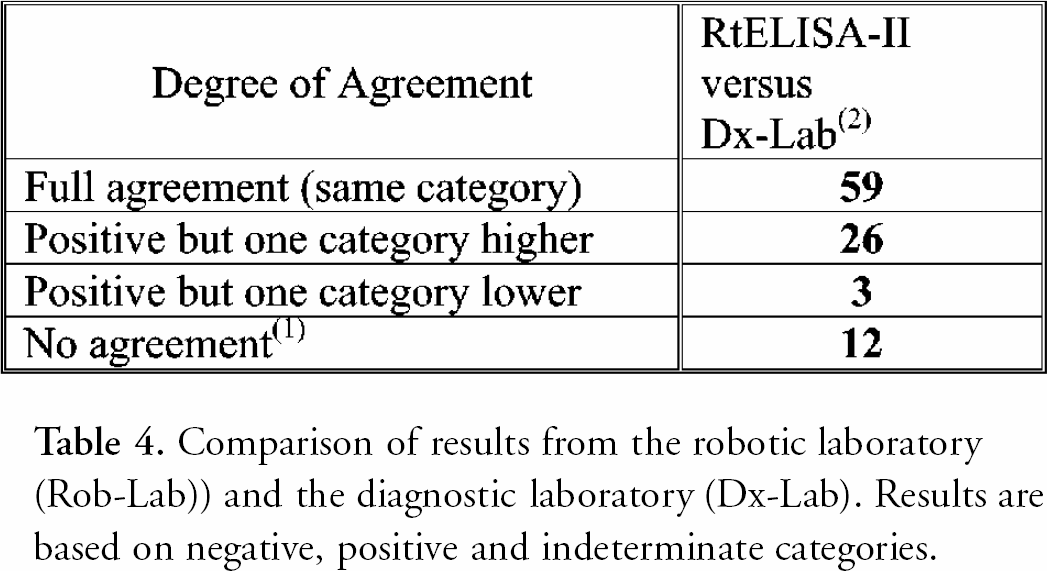
When classified in negative, positive or indeterminate groups, the total agreement between the two laboratories was 92% or 94% if the indeterminate results from the diagnostic laboratory were considered as positive (See Table 4).
Comparison of results from the robotic laboratory (Rob-Lab)) and the diagnostic laboratory (Dx-Lab). Results are based on negative, positive and indeterminate categories.
Discussion
Robot-assisted automated procedures were adapted to one of the principal diagnostic assays of the B virus diagnostic laboratory - the tELISA. The outline of this unique automation system was presented along with the preliminary validation steps. A new simple automation-compatible method for coating plates was applied to replace the routine technique that involved an automation-non-compatible centrifugation step. Performance of the automated RtELISA was examined by determination of “within-run” and “between-day” imprecision. Results of the RtELISA were then compared to the manual tELISA results. Based on titer categories, the agreement between the 2 RtELISA repetitions was higher than the agreement between the RtELISAs and the manual ELISA, indicating a higher precision of the robotic tELISA. However, when classified in “negative” or “positive” groups the total agreement between the 2 RtELISA runs was 97% and the agreement between the RtELISA and manual ELISA was 94%. When some of the samples were retested by the diagnostic laboratory the percent of agreement rose to 96% (results not shown). In this case some human error may have been involved and was corrected by the second run.
Calculated antibody titers were more variable. The “within-run” and “between-day” reproducibilities were approximately 30%. Results indicate, that this variability is caused by low OD values generated at the lower part of the standard curve. Similar results were obtained in the past with the manual tELISA (Katz D. and Hilliard JK, unpublished observations). This phenomenon, where lower readings result in higher imprecision is well known and is the main factor that affects the reproducibility and sensitivity of immunoassays (Ezan E. and Grassi J., 2000).
It is concluded that the performance of the robot-automated tELISA is satisfactory and acceptable within the limits of imprecision that are inherent to this serological procedure. At this stage, it is too early to assess precisely the advantages of the automated facility over the manually operated laboratory. However, based on our limited experience, it is already possible to observe some of the advantages of automation: tedious manual procedures are replaced, manpower is saved and the throughput of plate coating and tELISA runs has increased about three fold.
It is anticipated that the flexibility of the roboticized integrated workstations will conveniently allow future changes that may be needed for improving established assays and will enable the introduction of new automated assays.
The robot-assisted automated facility that was established on campus of the Georgia State University is different from a typical clinical laboratory and also different from commercially oriented laboratories. In this unique academic environment, the diagnostic laboratory is run by the same team of people that are involved in research and education. It is therefore expected, that in addition to the increased efficiency in performance and accomplishment of the proclaimed routine tasks of the NIH funded resource diagnostic laboratory, the facility will also enhance ongoing research activities and contribute to the education of students through their exposure to these advanced technologies.
SOURCES OF SUPPORT:
The work was supported by the generous gift of the robotic instrumentation from the Georgia Research Alliance with supplies and staff support from the Elizabeth R. Griffin Research Foundation Inc. and from NIH's National Center for Research Resources (P40 RR05162).
Acknowledgements
The support and encouragement of Dr. P. C. Tai are greatly appreciated. Many thanks to K. Bush, N. Manes and M. Hyman from the B virus diagnostic laboratory for their collaboration and to R. Sandberg for his excellent technical support of the robotic facility.