
Abstract
The Elispot technique has gained much attention over the past few years. Its outstanding sensitivity and general ease of performance has made it one of the most attractive assay candidates for immunomonitoring purposes, including vaccine development and vaccine trials in various phases, diagnostics, and basic research. The demands of the market call for a simplified and automated technique in order to enhance areas of use. This paper describes past and present developments addressing the automation and standardization demands for the Elispot and indirectly connected techniques.
Keywords
A Vision
A possible scenario: Blood samples from a donor are just delivered to the GLP-compliant laboratory. The scientist scans the bar code to verify origin of the probe. He walks over to the robot to start the blood processing, knowing that in 24 hours he will receive a printout of precursor frequencies of T cells in the patient's blood that recognize specific antigens. These frequencies are based on spot-forming features of antigen-specific T cells releasing a certain cytokine, combined with a technique developed many years ago: the Elispot technique. These frequencies could indicate the success or failure of a vaccination program the patient was enrolled in. This would be the last patient sample from this trial. In the meantime, there is enough time to work on the logistics and grant application for the phase II study.
A fiction of Elispot automation? Under automation, we understand the automatic, as opposed to human, operation or control of a process, equipment, or a system; or the techniques and equipment used to achieve this. There are many developments in the Elispot field that could lead to a similar automation scenario described above. To better understand the progress in the field, this paper describes the previous developments and improvements in the Elispot technique as well as new techniques on the horizon. This cannot be restricted to the assay itself but also to supporting techniques like cell counting and separation, some of which are discussed in detail in other publications in this issue.
The Past
The Elispot technique was first described in 1983. 1,2 Its use was mainly restricted to the detection of antibody-secreting cells. 1 –4 Publications describing the technique were sparse and limited to a few groups. Cells were typically plated into a Petri dish, and the released and captured IgG made visible using a colorimetric reaction either on the plastic cell surface of the Petri dish or in a gel medium filling the Petri dish. Automation, if any, was limited to the use of a shaker or similar general lab equipment.
In 1988, Czerkinsky described the use of the reverse Elispot technique for the detection of cytokines from human T cells. 5 The use of 96-well plates with nitrocellulose membranes was introduced. For higher accuracy during the evaluation, the use of a stereomicroscope was also suggested. Many laboratories have adopted the technique described in this paper, and changes to the principal technique itself are rather limited until today (see Fig. 1). Briefly, a microtiter plate is coated with an antibody against a cytokine of interest, e.g., IFN-gamma. Unoccupied protein-binding sites are blocked. Immune cells and, in most cases, antigen or antigen-presenting cells are added to the plate. During a short incubation time of 20 to 40 h, the coating antibody captures cytokine secreted by cells. The cytokine release can be caused by in vivo stimulation, specific antigen-stimulation of preexisting memory cells during incubation in vitro, or unspecific stimulation by mitogens or other substances. After incubation, cells are washed off the plate, and a detection antibody specific for the cytokine of interest is added. Similar to an ELISA, a multistep colorimetric development is used to make those sites visible at which a cell secreted cytokine. The results of such an assay are colored spots that can be enumerated (Fig. 1). Each spot represents one cell that secreted cytokine. 5
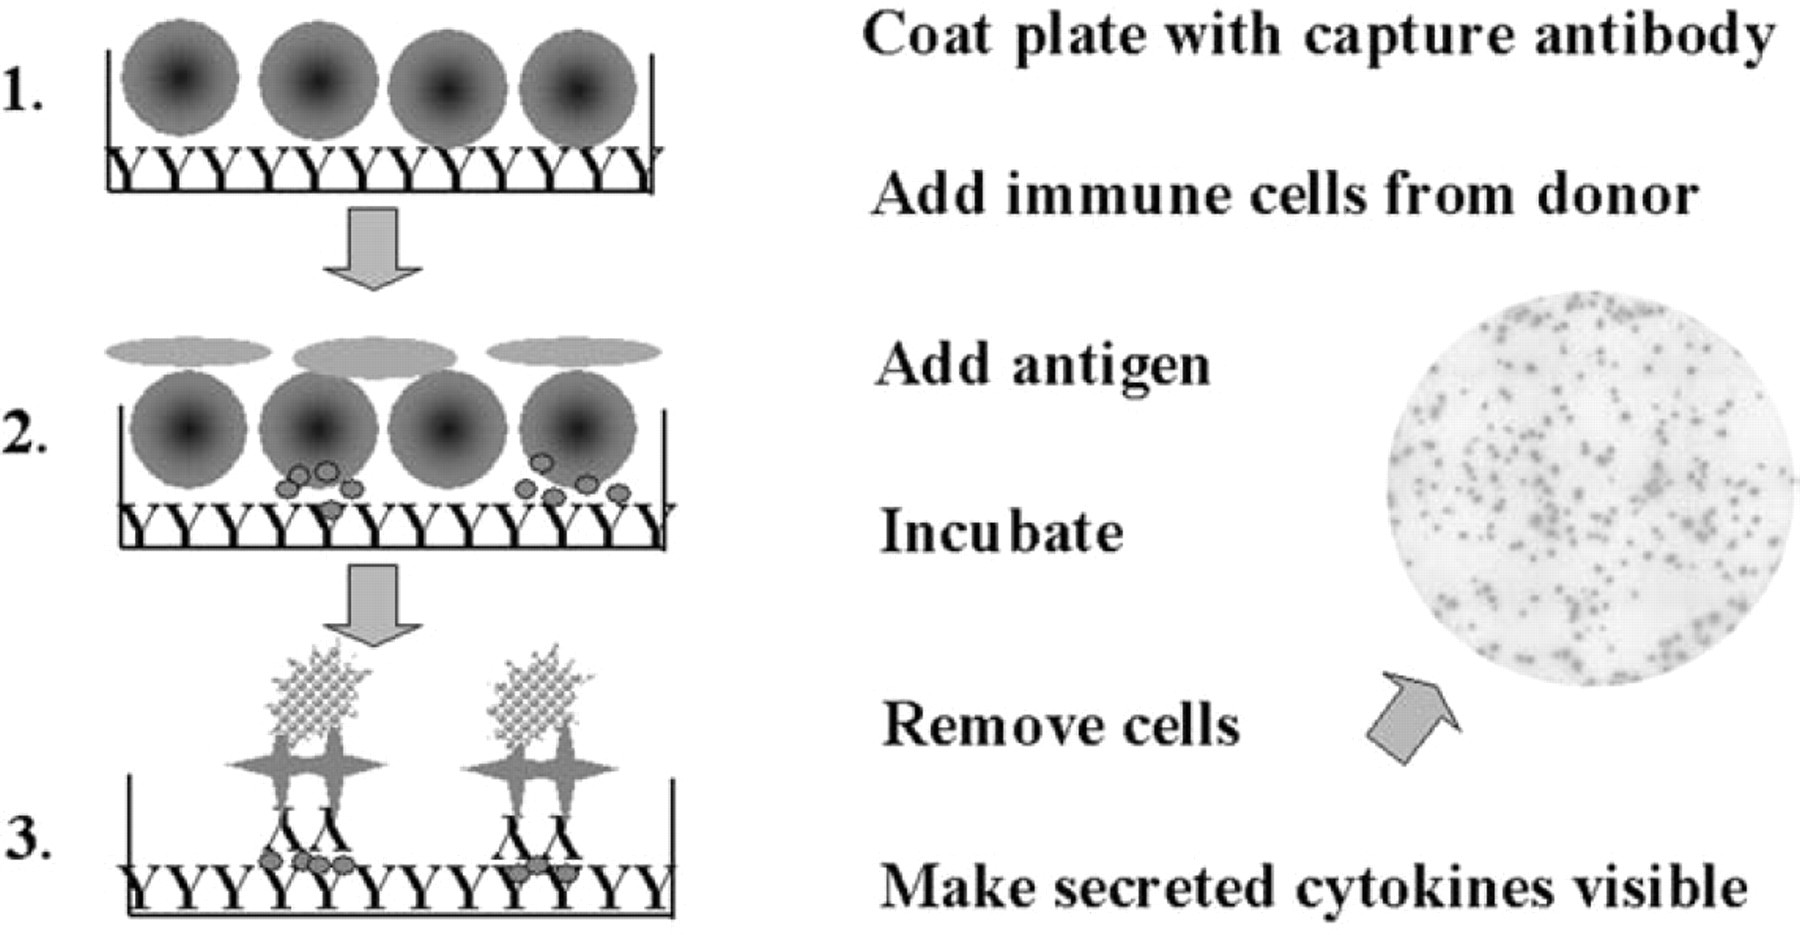
The principal technique of a cytokine Elispot assay.
Over the years, the number of publications describing or using the Elispot assay has steadily increased. In 2002 alone, those publications quintupled in number compared to the previous year. Scientists used the Elispot technique mainly for the establishment of T cell frequencies secreting a certain cytokine in the context of a specific disease status, which are mostly restricted to autoimmune and allergic diseases, 6 –8 or to detect antigen-specific T cells in infectious or cancerous diseases, often as a response to vaccination efforts. 9 –12 Over time, the Elispot assay was used for the detection of an increasing number of secreted cytokines in an increasing number of species. Still, the applied general Elispot protocol remained the same.
Due to the advantages of the Elispot technique (e.g., high sensitivity, no need of in vitro stimulation of cells, or addition of exogenous IL-2) and its direct quantitative character, the Elispot assay became a “hot” candidate for monitoring immune responses of patients undergoing immunotherapy. One of the major obstacles, however, was the inconsistency observed when assays were repeated or compared among laboratories. The need for standardization and validation increased dramatically when the Elispot was used to monitor patients in various cancer vaccine trials. 9,13 –15 It was at this time when one of the major improvements and first automation steps were introduced to the technique: automated Elispot readers. 16 –18 Until then, evaluation of Elispot plates was only performed by eye, magnifying glass, or mostly via a stereomicroscope. The limitations of those methods are obvious. They are time- and labor-intensive approaches, with high spot numbers being difficult or impossible to enumerate. Limited resolution makes it difficult to recognize and exclude artifacts as well as to count small and faint spots or spots located close together. The greatest disadvantage of these manual evaluation methods is the bias issue, which becomes even more important in the light of clinical trials. The introduction of automated Elispot readers could overcome many of the drawbacks of manual evaluation methods. However, despite their advantages and increasing use, it is essential to understand their limitations and dependence on human factors, as discussed further below.
One of the major enhancements in the Elispot field came from a research community that so far had paid little attention to the Elispot technique: the HIV research, vaccine development, and vaccine trial field. During a satellite meeting of the 13th International AIDS congress in South Africa in 2000, the world's leading HIV researchers discussed the question concerning which immunoassay to use for the vastly increasing number of HIV studies. The first guidelines were published, which described the Elispot assay as a useful assay for immunomonitoring purposes. The impact on the Elispot technique was profound. With laboratories all over the world trying to compare results, and core laboratories coordinating the work at multiple sites, often in developing countries, the need for standardization and validation as well as simplification of the technique became a priority. 19
The present
Prerequisites for automation are simplification, standardization, and repeatability. The growth of the Elispot market gained the attention of companies providing materials, chemicals, and equipment for the Elispot assay. The demands of the market, with many ongoing clinical studies and trials in preparation as well as first indications that Elispot assays could enter the diagnostic market, 8,10 are to have reliable, standardized products available to meet specific customer requirements. Those include high sensitivity, low variability in performance, compliance with standardization guidelines, cost-effectiveness, and ease of use, not only in well-equipped laboratories in industrial countries but also in smaller laboratories in developing countries.
1)
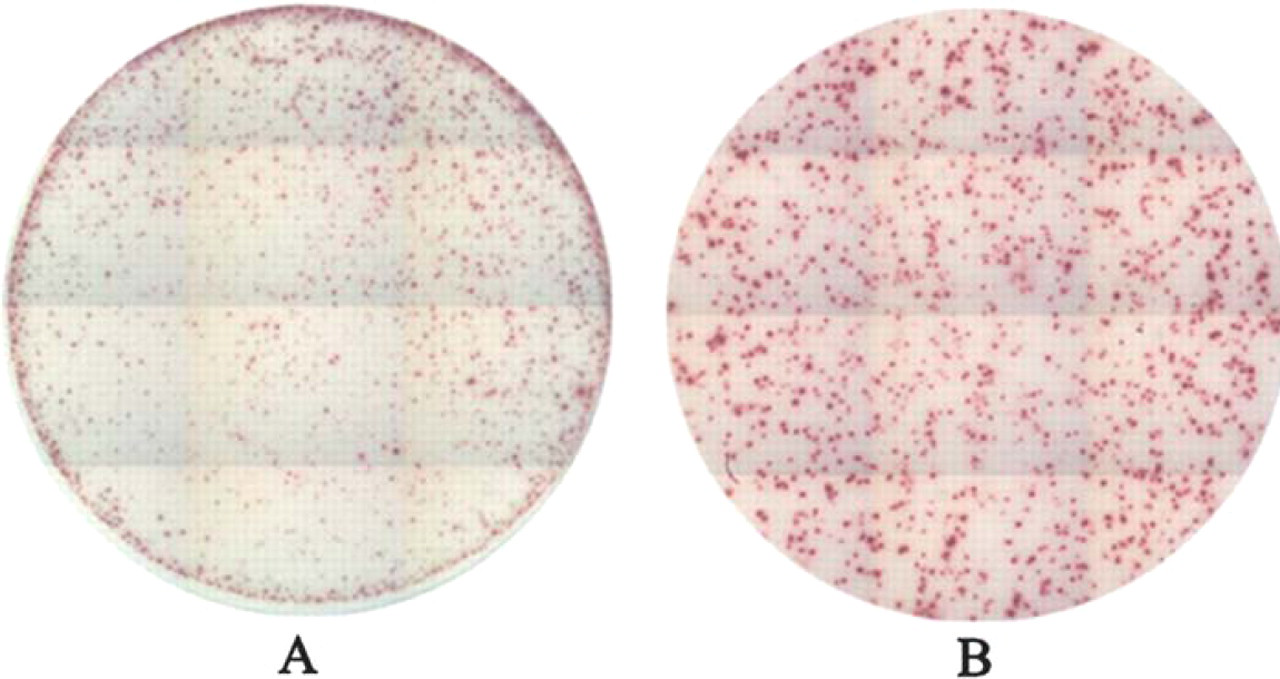
Comparison of conventional and improved PVDF plates. Human PBMC were tested for reactivity against the CEF peptide pool. Spots in the improved PVDF plate (B) are better defined and more evenly distributed across the well than in a conventional PVDF plate (A).
2)
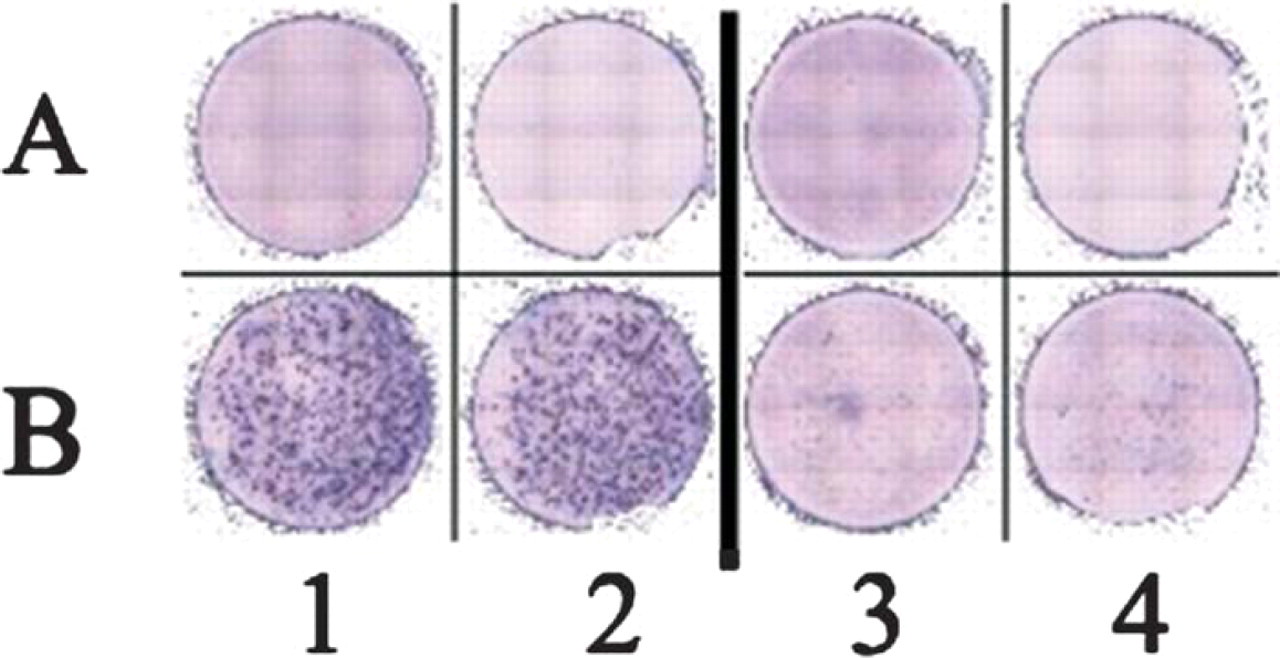
Comparison of two commercially available human IFN-gamma Elispot kits. PBMC alone were tested in row A, whereas PBMC + antigen were tested in row B. Columns 1 and 2 were developed using an Elispot kit from company X, column 3 and 4 from company Y. The kit used in columns 1 and 2 (company X) exhibited a more than 10-fold higher sensitivity.
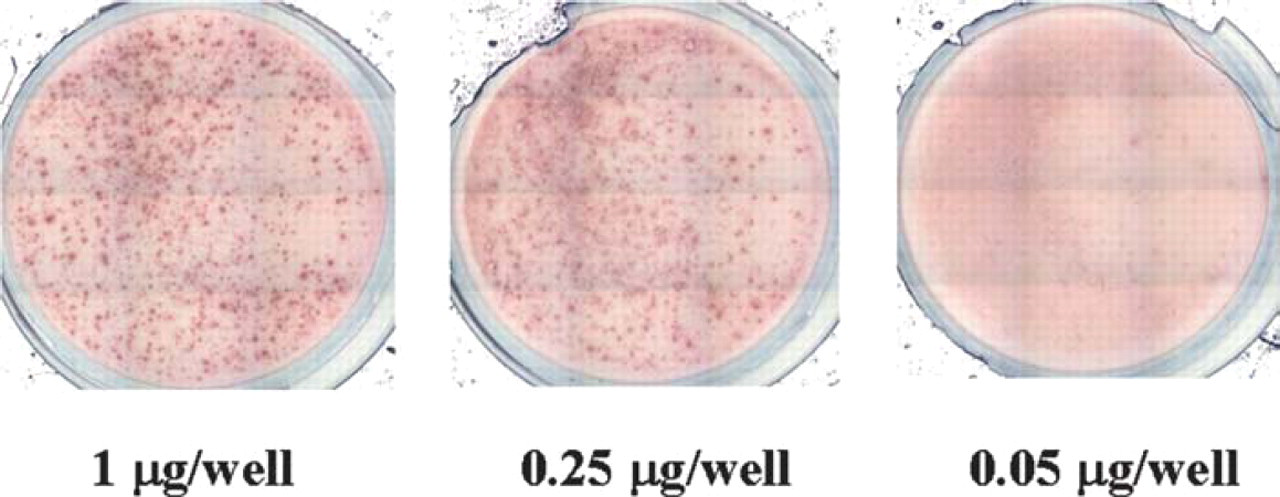
Influence of coating antibody concentration on spot outcome. A PVDF plate was coated with decreasing amount of coating antibody for detection of human IFN-gamma as indicated. PBMC were stimulated with 10 μg/mL PHA. The experiment was performed during the WHO-Elispot workshop at Duke University in April 2001.
3)
4)
The first step in cell preparation is the isolation of PBMC (see Cox et al., this issue) when processing whole blood samples (typically in human and monkey studies). The most common procedure is the Ficoll Hypaque density gradient centrifugation. In light of the growing number of blood samples often received by a laboratory (e.g., phase II studies) and increasing volume of blood per sample (e.g., leukopheresis samples), the time and work constraints can be overwhelming. Even though this is a rather simple method, further simplification and automation steps are in high demand. One procedure simplification can be achieved by using Accuspin tubes (Sigma, St. Louis, MO), eliminating the time-consuming overlaying or underlaying technique for blood and Ficoll. Another simplified method is offered through the use of CPT tubes (BD, Franklin Lakes, NJ), which combine anticoagulant and Ficoll Hypaque density fluid in one tube, separated by a gel barrier. A very different and new approach is the application of magnetic beads. Various MACS whole blood isolation microbead kits are now offered (Miltenyi Biotec, Auburn, CA), which allow the direct isolation of subsets of lymphocytes, e.g., CD8, CD4, and CD56+ cells directly from whole blood in a few minutes, using the automated magnetic sorter autoMACS.
Cryopreservation and thawing procedures have a high impact on cell viability and availability. There is evidence that frozen and fresh cells perform comparably in an Elispot assay. 21 However, optimized techniques improve the number of viable cells available and reduce the risk of variability due to cells in apoptosis etc. 22 Different techniques have been reviewed and are discussed elsewhere (Cox et al., this issue). Improved thawing methods, including the use of Benzonase, 23 have increased the number of recovered cells due to the limitation of cell clumping during the procedure. Up to now, however, no significant automation steps have been introduced to simplify and speed up these processes.
A major improvement has been achieved for an experimental step applicable to many assays: cell counting. This procedure can be associated with high variability that in turn might have dramatic impact on Elispot results. For instance, if scientist A counts 20 alive cells using a hemocytometer and trypan blue exclusion, and scientist B counts 15 alive cells, the final dilution of cells will differ by 25%. This can have a dramatic effect on the detectable spot number. If whole PBMC are added to the plate, and peptide is added as antigen, a cell density of at least 200,000 cells per well is required for efficient cell-to-cell contact and antigen presentation. This experimental setup does not provide a linear titration curve in which doubling or halving of plated cells per well results in an equal increase or decrease of spot number. The reason for that is that with increasing cell numbers, cells pile up on each other and form multiple layers. For spot forming, a direct contact between the effector cell and the capture antibody is necessary. Therefore, the cytokine secreted by cells in the upper layers will not be captured by the antibody but rather secreted into the medium. This will result in a smaller increase of spot counts compared to cell number plated. In contrast, when decreasing the cell number per well, the cell-to-cell contact and antigen presentation become less efficient, and the spot number drops faster than expected by the number of cells plated. In our scenario above, scientist A's final cell dilution might be too high, assuming that he counted too many living cells, and the actual total amount of PBMC added to the well would be only 150,000. The difference in spot counts compared to scientist B could be as high as twofold or more, providing the likelihood of missing responses. Automated cell counters have now been entering the market, and an increasing number of laboratories are using them to decrease variability and simplify the cell-counting technique (discussed by Cox et al., this issue). Further, some automated cell counters are providing the option to have the number of apoptotic cells in a preparation determined. Since apoptotic cells will not respond in an Elispot assay, the viable cell estimates will be of much higher accuracy.
In a routine laboratory, the scientist performs the pipetting of cells into the Elispot plate. For industrial purposes, however, similar steps (e.g., prewetting and coating steps) are already being performed by robots. There have been no reports yet about similar automation introduction to the regular laboratory.
5)
An interesting technique has just been reported by Tartour and coworkers. 24 Instead of traditional enzymes and substrates, they use fluorescent-labeled secondary antibodies for spot detection. This technique is a true simplification of the spot development, requiring only one pipetting and incubation step. Further, it allows the detection of various fluorochromes in one well (Fig. 5) for the detection of multiple cytokines. Automated evaluation of fluorescent samples is already possible. The use of automated filter switches and proprietary software for color differentiation, as offered by the Zeiss microscope/reader (Munich, Germany), could drastically enhance this technique.
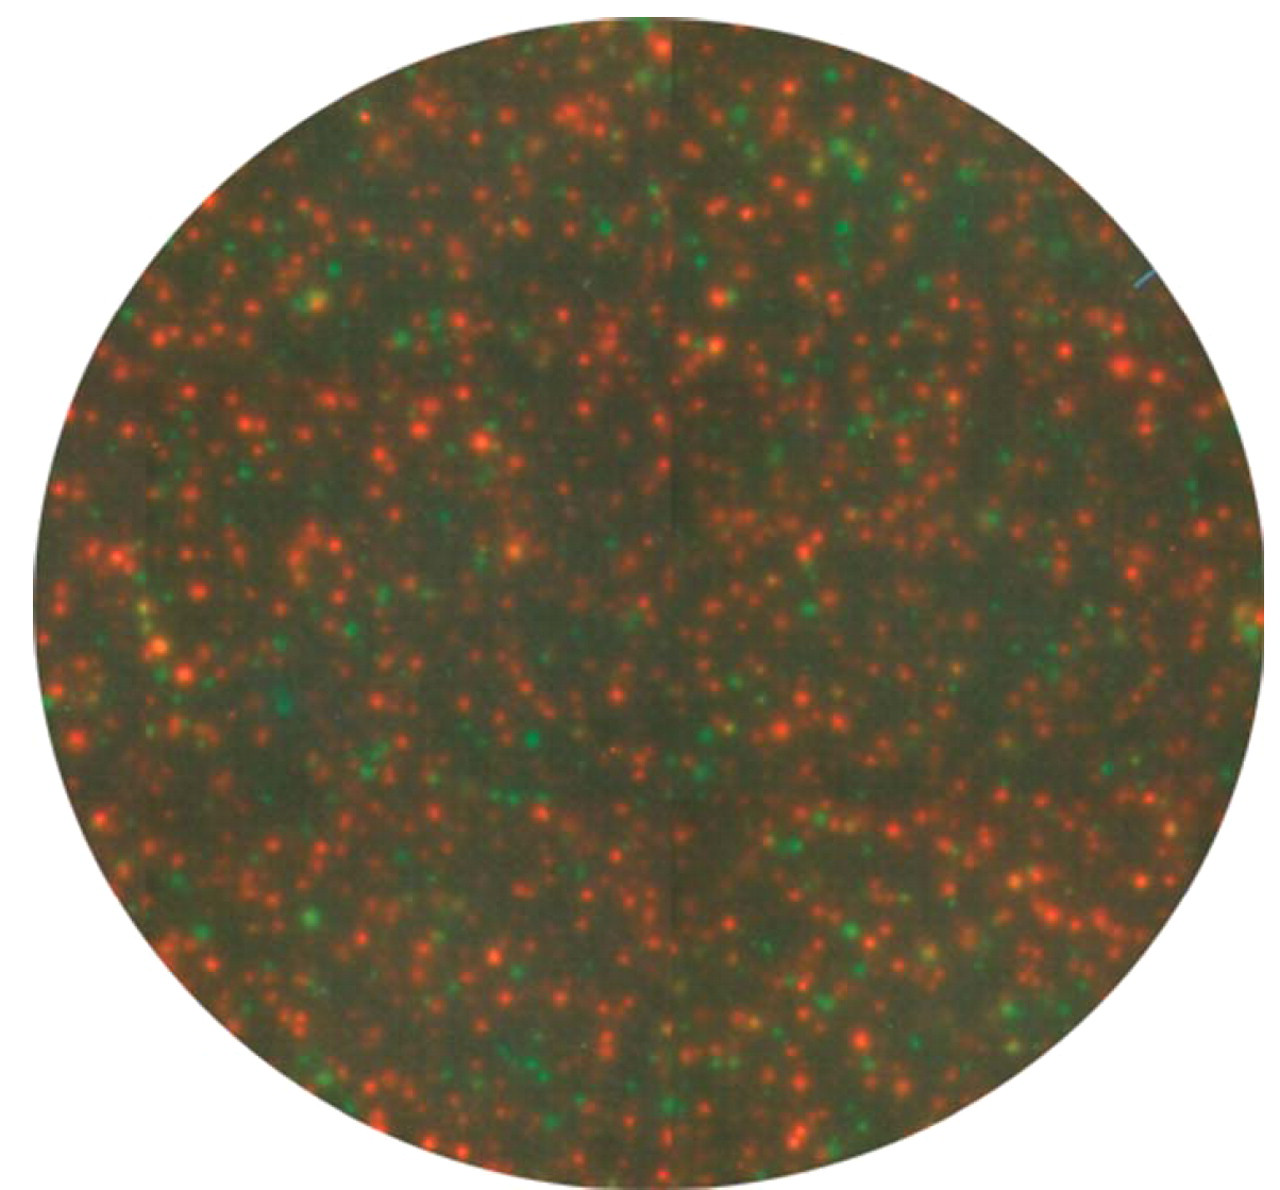
Picture of a fluorescent Elispot well. Green spots indicate IFN-gamma-secreting cells, red spots IL2-secreting cells, and yellow spots indicate cells that secreted both cytokines simultaneously. The picture was taken with a Zeiss Elispot reader (Munich, Germany).
6)
The future
The Elispot assay has been established over 20 years of use. Its exceptional features secured it a place in a variety of immunomonitoring approaches and, through that, a place as a standard technology in many laboratories around the world. This development had a significant impact on industrial suppliers of materials and equipment directly and indirectly used for the Elispot technique. Over the last few years, major improvements and simplifications of the technique have been provided, as described in the previous sections. The focus today is on standardization of the technique and simplification to enable the scientist to run a high number of samples in a short time without compromising quality and to concur with the growing demand of GLP compliance. This has led to the ability to introduce automation to many steps along the Elispot protocol in a very short time (e.g., ready-to-use precoated plates produced in automated industrial facilities, automated cell counters, automated Elispot readers). Two of the major concerns in complete automation of this technique are the biological nature of the system to be analyzed and the natural variability found in all aspects of cell populations among donors. How far the human input can be spared will rely highly on further simplification, standardization, and validation steps. Further, combining various automation steps and maintaining a flawless operation of every single step is a highly challenging as well as costly task. This might limit the use of fully robotized Elispot machines to certain core laboratories, whereas others might chose to work with only certain automated steps, as described in this paper. However, the vast advances in technology and the growing interest in the Elispot technique let the picture, described in the beginning of this paper, appear to be a possible scenario in the not to distant future.
Acknowledgment
The author wishes to thank Michael T. Moravsky for helpful comments on the preparation of the manuscript.