
Abstract

Introduction
Many labs will invest an extensive amount of time and capital on automated instruments to improve efficiency and increase productivity. What is often overlooked is the bar code that supports the automation process. An understanding of what a bar code is, how it functions, and how it brings advantages to laboratory applications will provide the foundation needed to leverage bar code technology effectively for achieving the objectives of the automation application while obtaining the highest data integrity possible.
Symbol Overview
The traditional bar code can best be described as a series of parallel bars and spaces, commonly referred to as elements. The bars, the dark elements of the bar code, absorb light. The white spaces reflect light. Predetermined width or height patterns defined by the symbology are used to encode the data in the symbol. A light source, typically the laser diode of a bar code scanner, is used to extract the data from the bar code. As the light moves across the bars and spaces of the bar code, the light is reflected back to a photo diode, which measures the light levels reflected by the bars and spaces. The data are then decoded by the scanner and output. Because only the widths or the heights of the bars and spaces are important in decoding the symbol, single-row bar codes are considered one-dimensional codes.
Two-dimensional codes can be grouped into two different categories: stacked linear codes and matrix codes. Stacked codes are rows of width-modulated bar codes stacked directly on top of each other. Each row is the same length and resembles a single-line bar code. Matrix codes are a two-dimensional pattern of data cells in the shape of a square, circle, or polygon. Unlike linear and stacked bar codes, matrix codes must be read with an image-based reader. They cannot be decoded by a laser scanner. 1
Bar codes can either be width-modulated or height-modulated. Height-modulated bar codes are almost exclusively used in the document and mail-processing industry. Width-modulated, or traditional linear bar codes, are the most common type of bar code and are the focus of this tutorial (Figure 1).
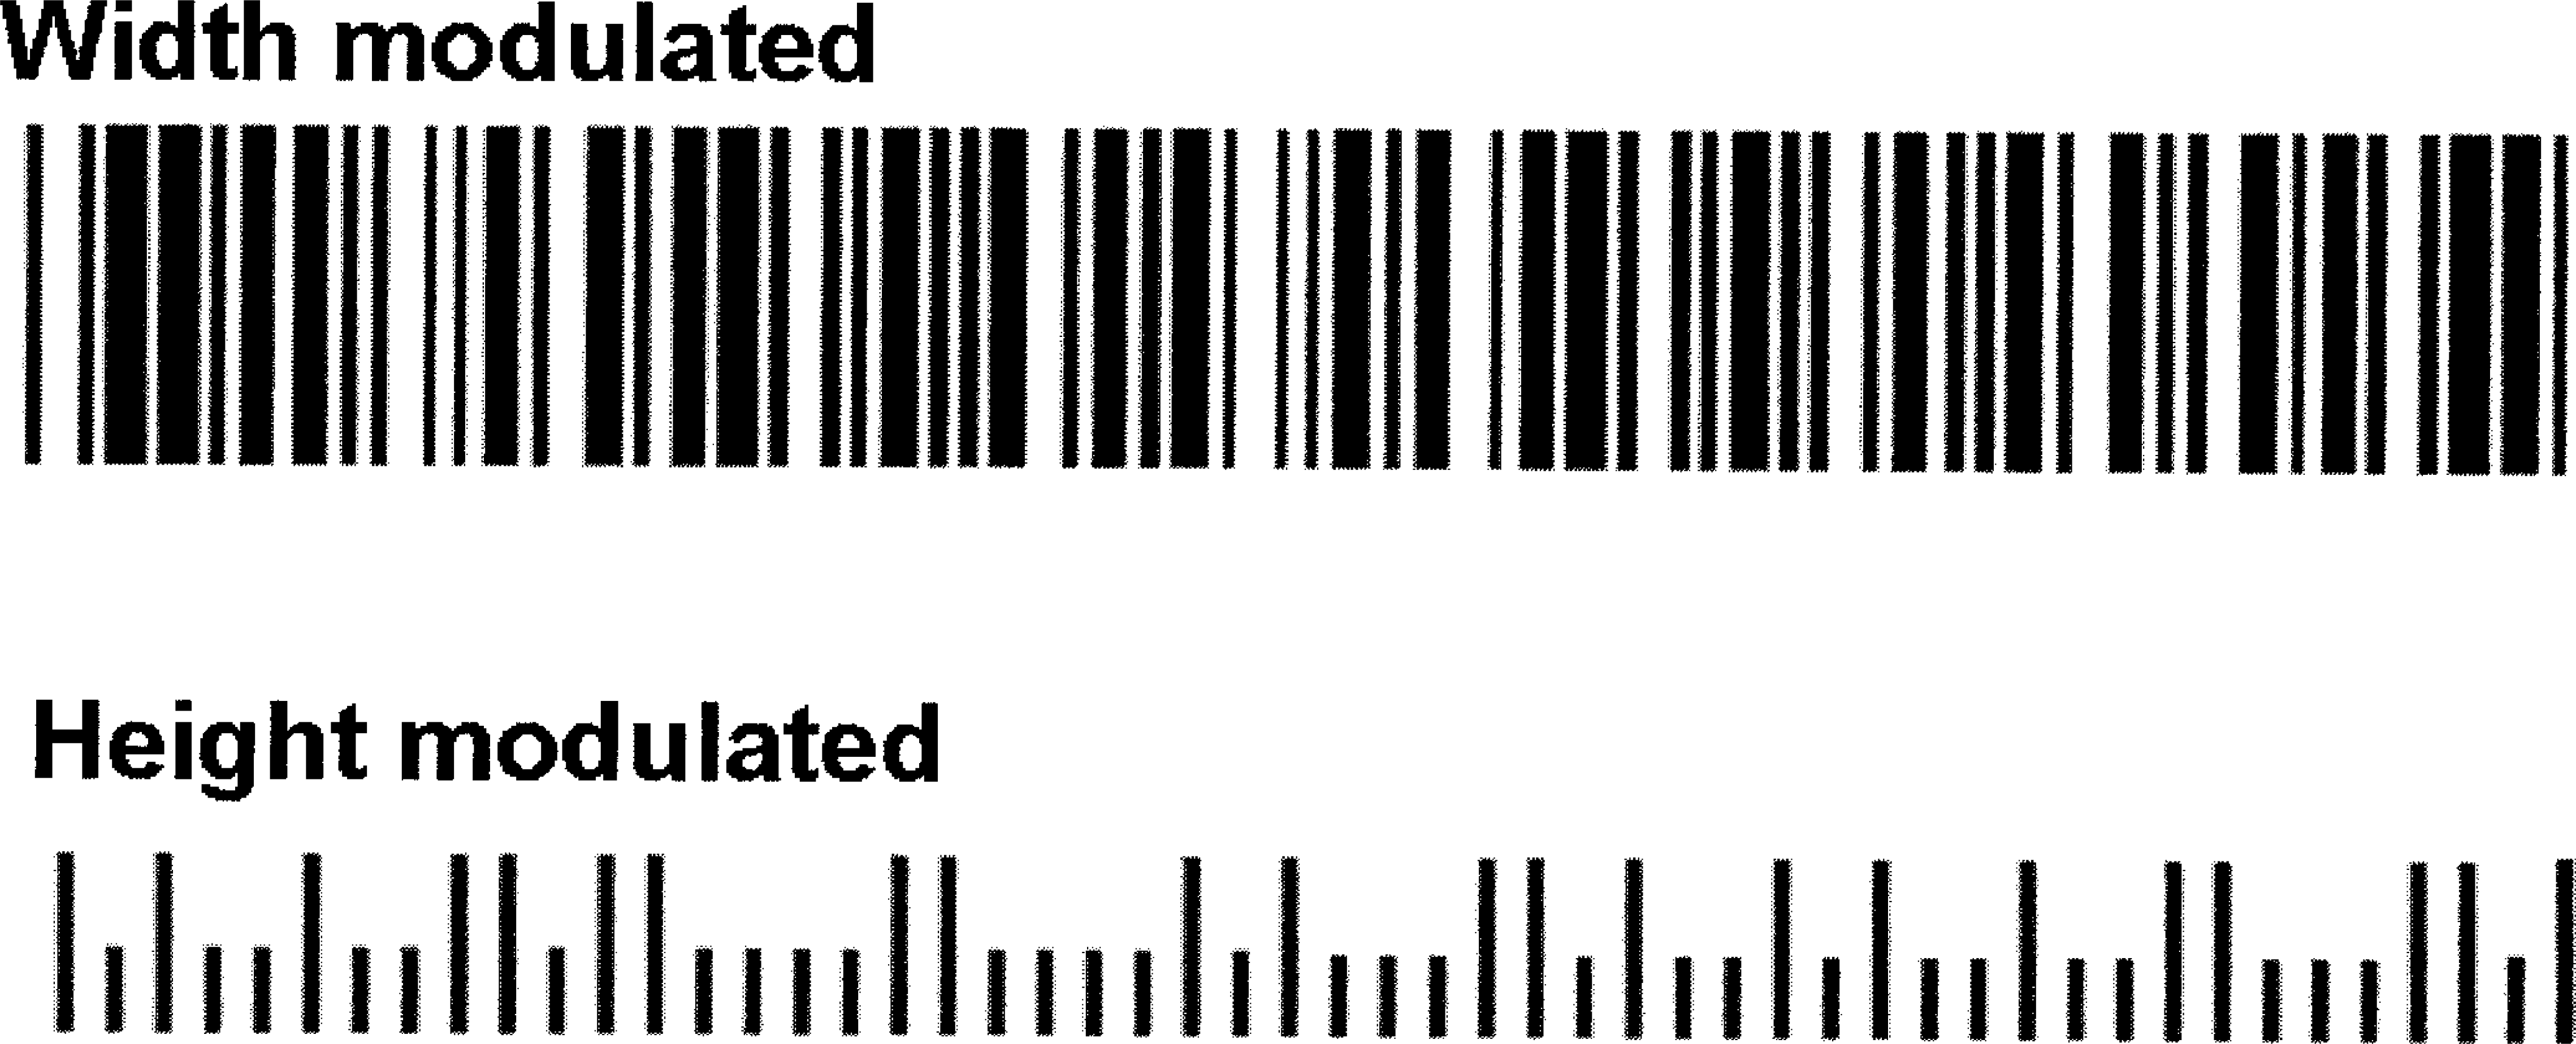
Bar code symbologies can be divided into two distinctly different groups: width-modulated and height-modulated bar codes.
Physical Dimensions
The physical properties of an element in a linear bar code are commonly described in terms of height and width. The unit for the width dimension is expressed in mil (0.001 inch) or mm (millimeter). Typically, the widths of both bars and spaces are significant. The width of the narrowest element is often the only one quantified, as the width of the other elements can be expressed based on the narrow element width. The element width is nominally the same for the narrow bar and the narrow space. The width is also referred to as the narrow bar width, element width, mil size, or the X-dimension. The X-dimension of a bar code is the theoretical width of the narrowest element. The length of the symbol is the measurement perpendicular to the length of the bars, regardless of orientation.
The height unit is often expressed in inches or millimeters. The height is measured along the length of the individual elements. If different heights are used within one symbol (height-modulated bar code), the smallest dimension is used. The element height is conceptually the same for bars and spaces. Unlike the width, this property is almost exclusively referred to as the bar height of the bar code. The taller the bar code, the more area the bar code reader has to scan the symbol. If part of the bar code is damaged, the scanner has a greater chance of still reading the symbol. Microscan recommends that the scanner receive a minimum of five looks at each symbol to achieve the optimal read performance possible from the bar code scanner.
Terms and Attributes
To create a good bar code, one must first understand the attributes of a bar code and how they can affect the readability in an application.
Quiet zone intrusions are the most frequent violations in bar code applications. Even in space-constrained applications such as labels on a microplate, the bar code scanner will not reliably read the bar code if the human readable or other graphical elements encroach into this area. Do not violate the quiet zone (Figure 2).
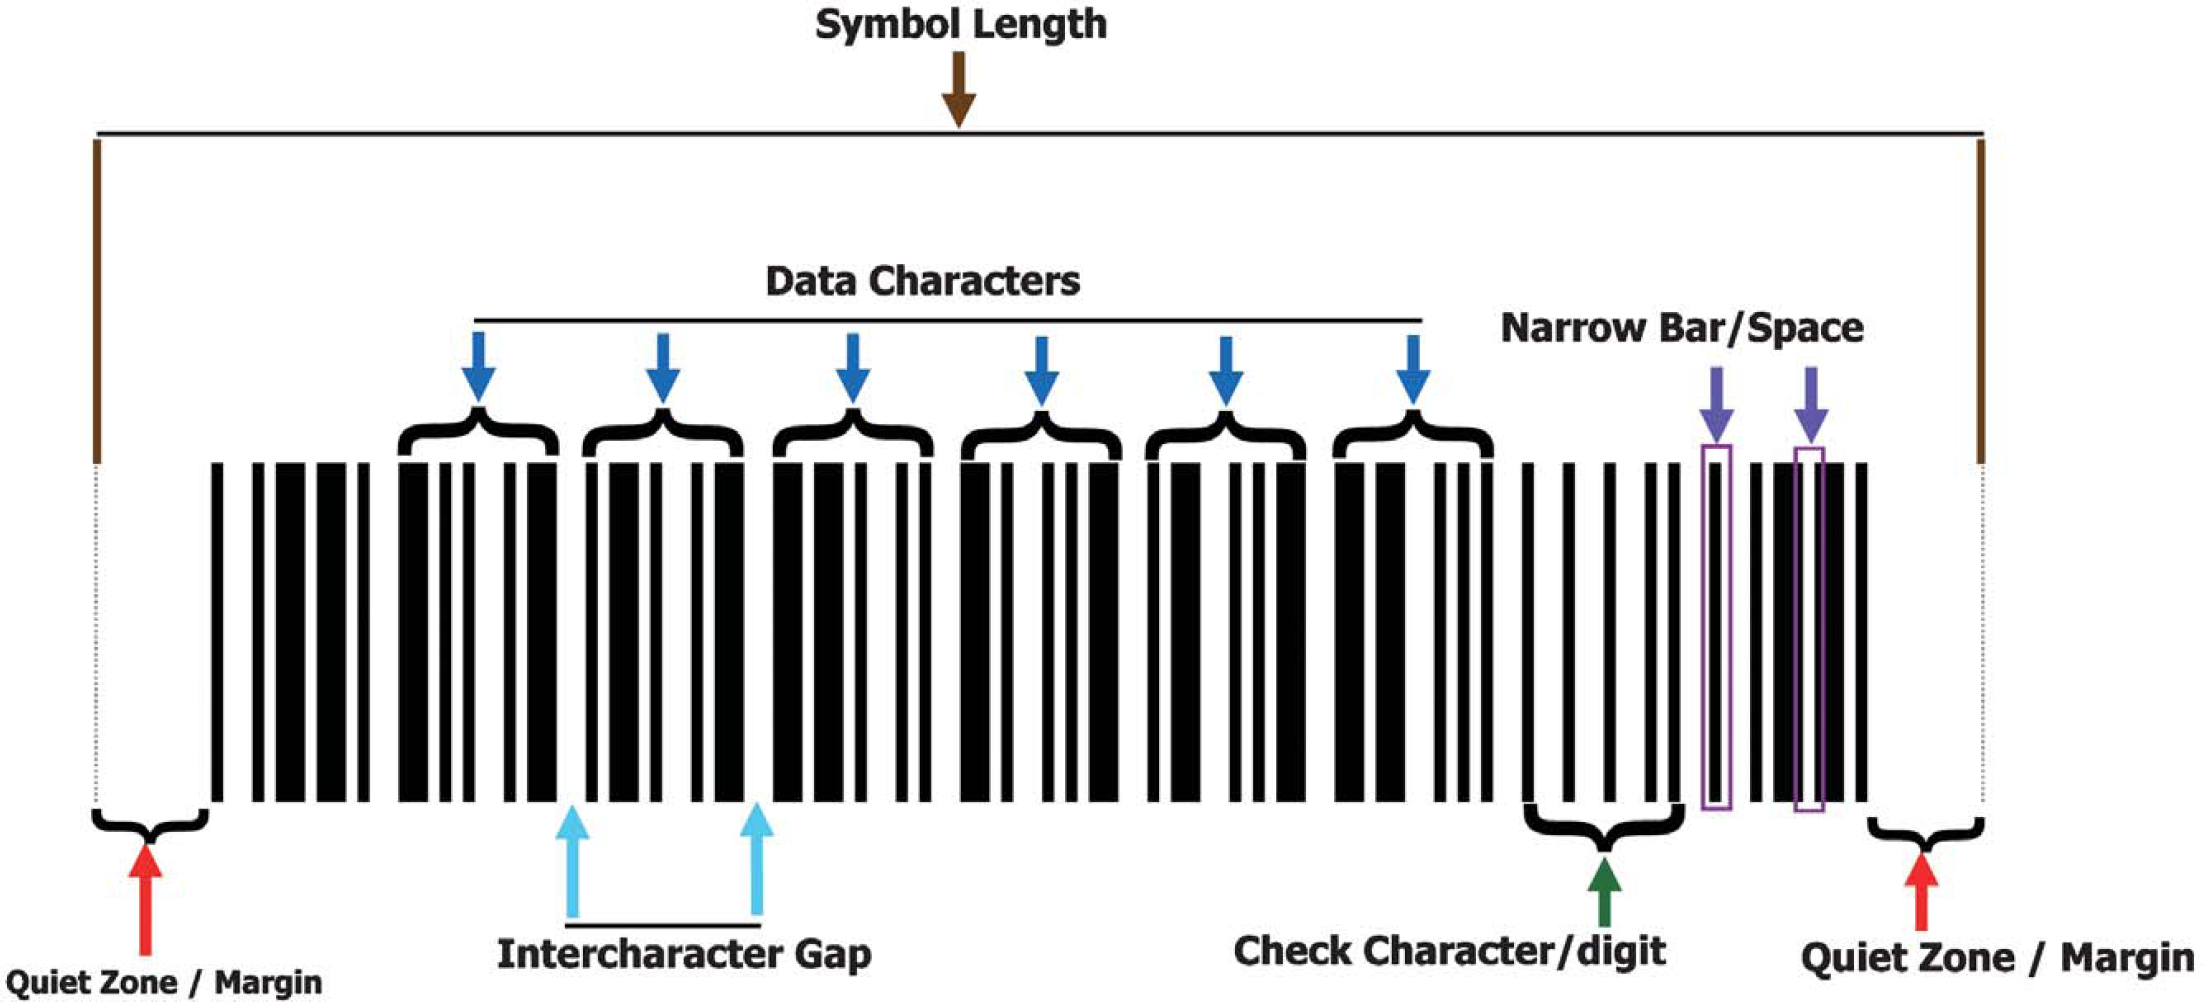
The general anatomy of a linear bar code.
The bar code printer calculates a check character value based on the data to be encoded.
This check character is included in the symbol.
The bar code scanner decodes the symbol and extracts the check character.
The bar code scanner performs the same calculation performed by the bar code printer and compares the result to the decoded value for the check character.
If the calculated value and the actual value for the check character are identical, the data is outputted. If not, the bar code scanner will continue to decode in pursuit of a match.
To further increase the data security of the bar code, the modulo value or check character, is used to calculate the check sums of the bar code.
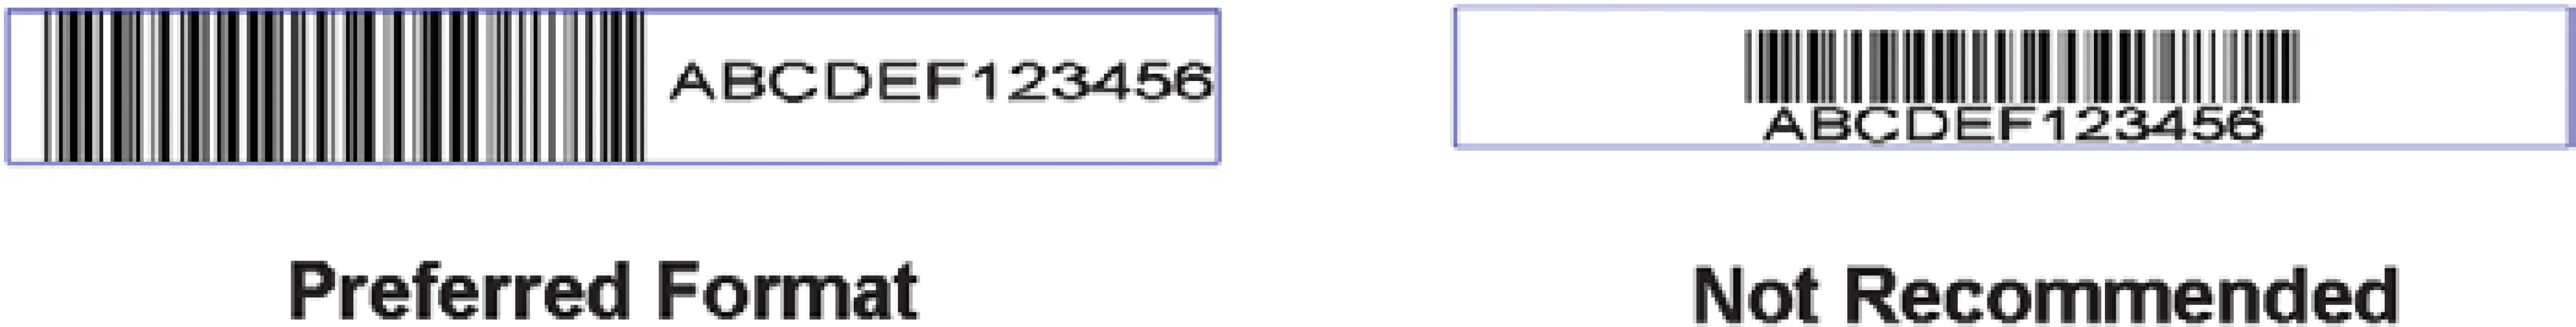
Bar height serves as the redundancy for a linear bar code. To maximize bar height, place human-readable text to the side of the bar code on a microplate label.
Symbology Families
To create the best possible bar code for the application, one must first understand the advantages and disadvantages of the available symbologies. Since several of the symbologies share similar characteristics, they can be grouped into families. The most common families are Ratio and Modular bar codes and Discrete and Continuous bar codes.
Character Construction: Ratio and Modular Bar Codes
Two methods are commonly used for encoding data into a bar code: ratio and modular. The ratio-based method utilizes only elements of two widths to create characters (Figure 4). The narrow element width is nominally equal to X. The wider element width is defined as a ratio of X, such as 2X or 3X. Ratio-based symbologies were the first symbologies to be widely adopted, and several remain very popular.
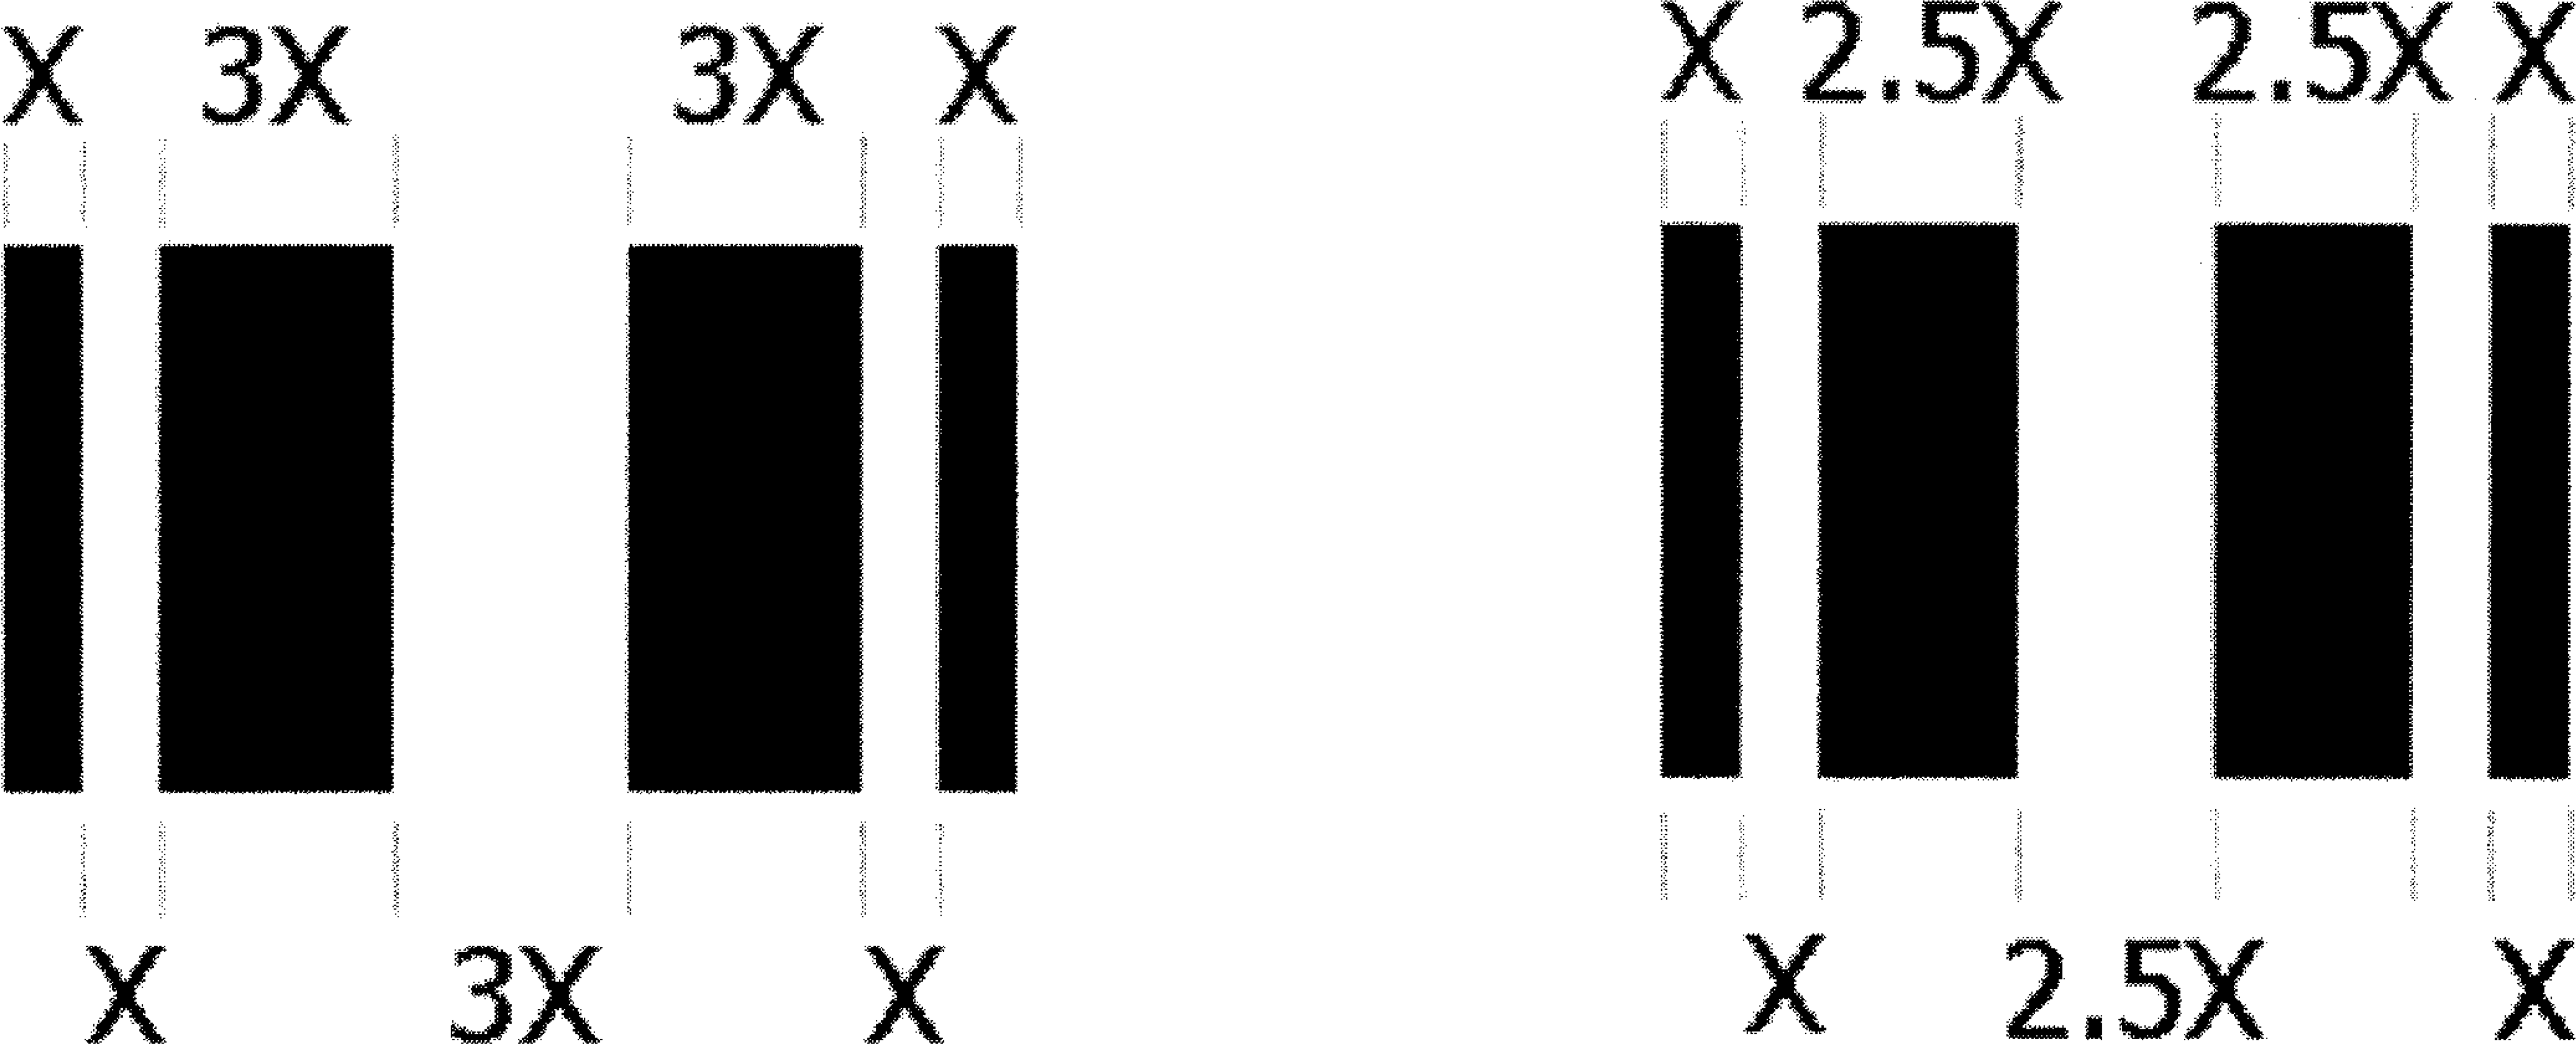
Ratio-based characters typically utilize only two widths of elements.
Modular symbologies divide the area for each character into a number of equally sized modules. The width of the modules is nominally equal to X. Each module is either light or dark. Identical adjacent modules make up bars and spaces wider than 1X. The width of each bar or space is a whole multiple of the module width (Figure 5).
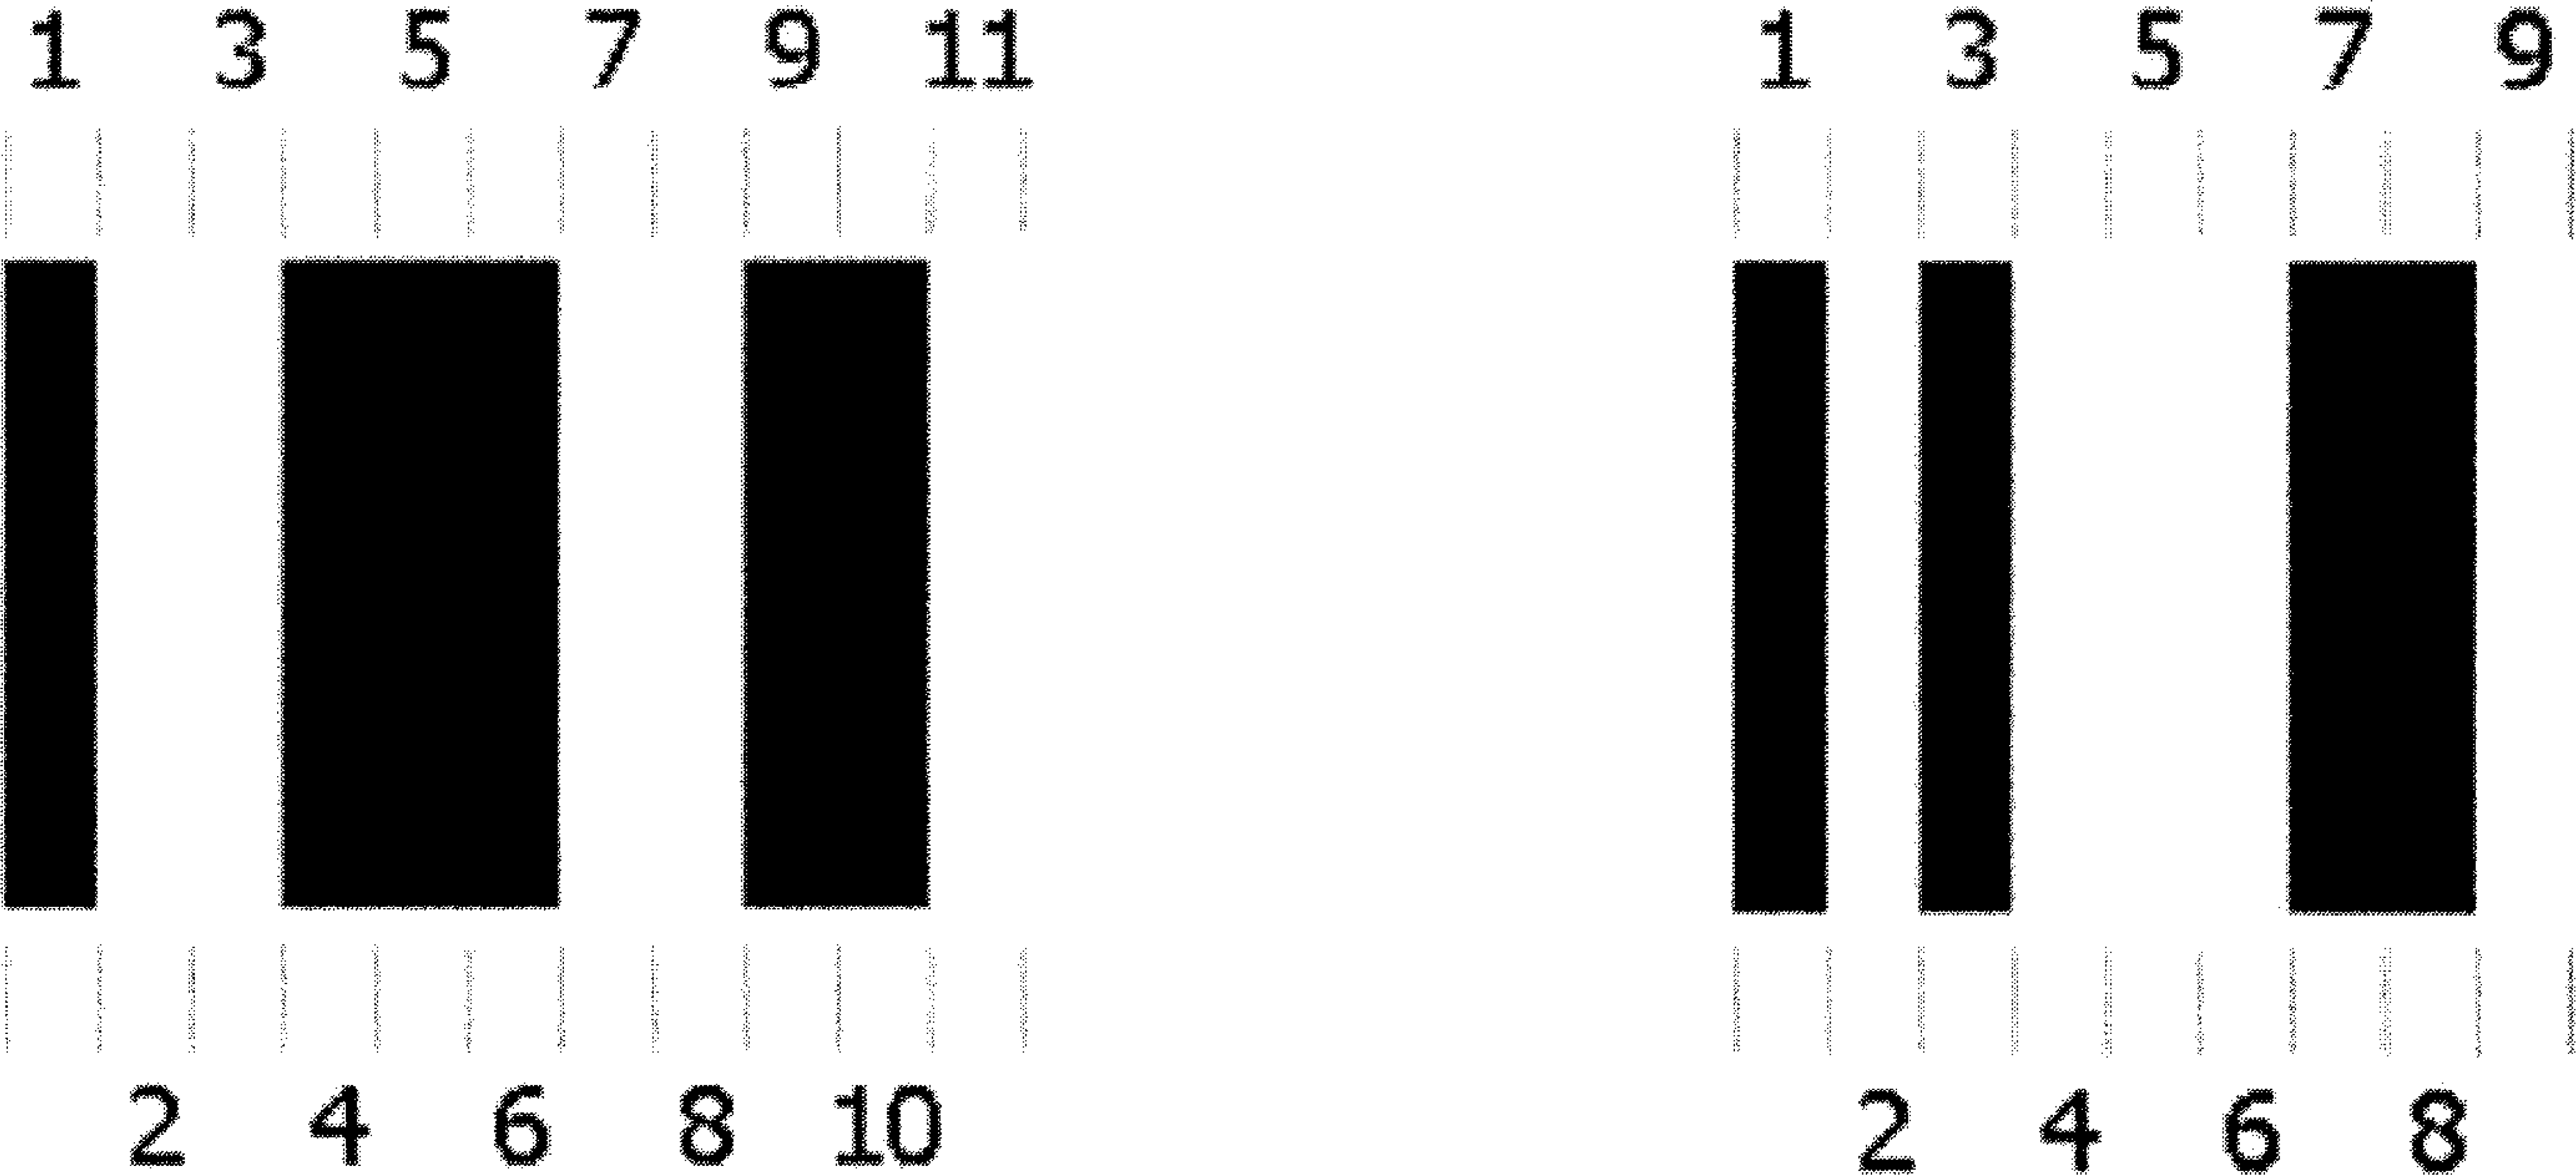
The area for each character in a modular symbol is divided into a number of equally sized modules. The width of the modules is nominally equal to X.
The bar code symbologies developed over the last few years, such as Code 128, have been almost exclusively modular because the modular structure creates a much more compact bar code. More data can be encoded into a much smaller space. The advantage to using ratio-based symbologies is that they are more impervious to printing inaccuracies. The bar code reader must only discriminate between two different widths, as opposed to reading a modular symbol that is constructed with four different element widths. This is usually not an issue unless the narrow bar width approaches the maximum resolution of the bar code printer.
Symbol Construction: Continuous and Discrete Bar Codes
The characters of both modular and ratio-based bar codes are formatted in one of two ways: discrete or continuous. In a discrete symbology, each character begins and ends with a bar. The individual characters are separated by spaces that do not contain information. The space between characters is referred to as the Intercharacter Gap, similar to the spaces in between the following letters: A B C D. Generally, the Intercharacter Gap should not be greater than four times the Narrow Bar Width (4×).
In a continuous symbology, each character begins with a bar and ends with a space. There is no space between characters. For example, the data would resemble the format of the following letters: abcde.
Symbologies
Linear Bar Codes
Literally hundreds of linear symbologies are in use today. However, only a few are widely adopted and appropriate for use in the Life Sciences. Listed below are some of the more common symbologies employed. 2
Stacked Symbologies
Stacked bar codes were developed in the 1980s to encode more data in a smaller footprint than allowed by the then current linear bar codes. Today, the primary advantage to using a stacked symbology is to encode more data into a symbol that can still be read by a laser bar code scanner. While matrix codes are much more space efficient and offer increased data capacity than stacked 2D codes, matrix codes must be read with an image-based reader. 6
One significant drawback to stacked symbologies is their sensitivity to scanner tilt. To decode the symbol, the laser beam must be aligned so that the beam passes through the rows one at a time. The stacked symbology PDF417 provides the user with a little more tolerance. Since PDF417 has three different encoding schemes that read every three rows, the laser beam can pass through up to three rows at a time and still decode the symbol (Figure 6).
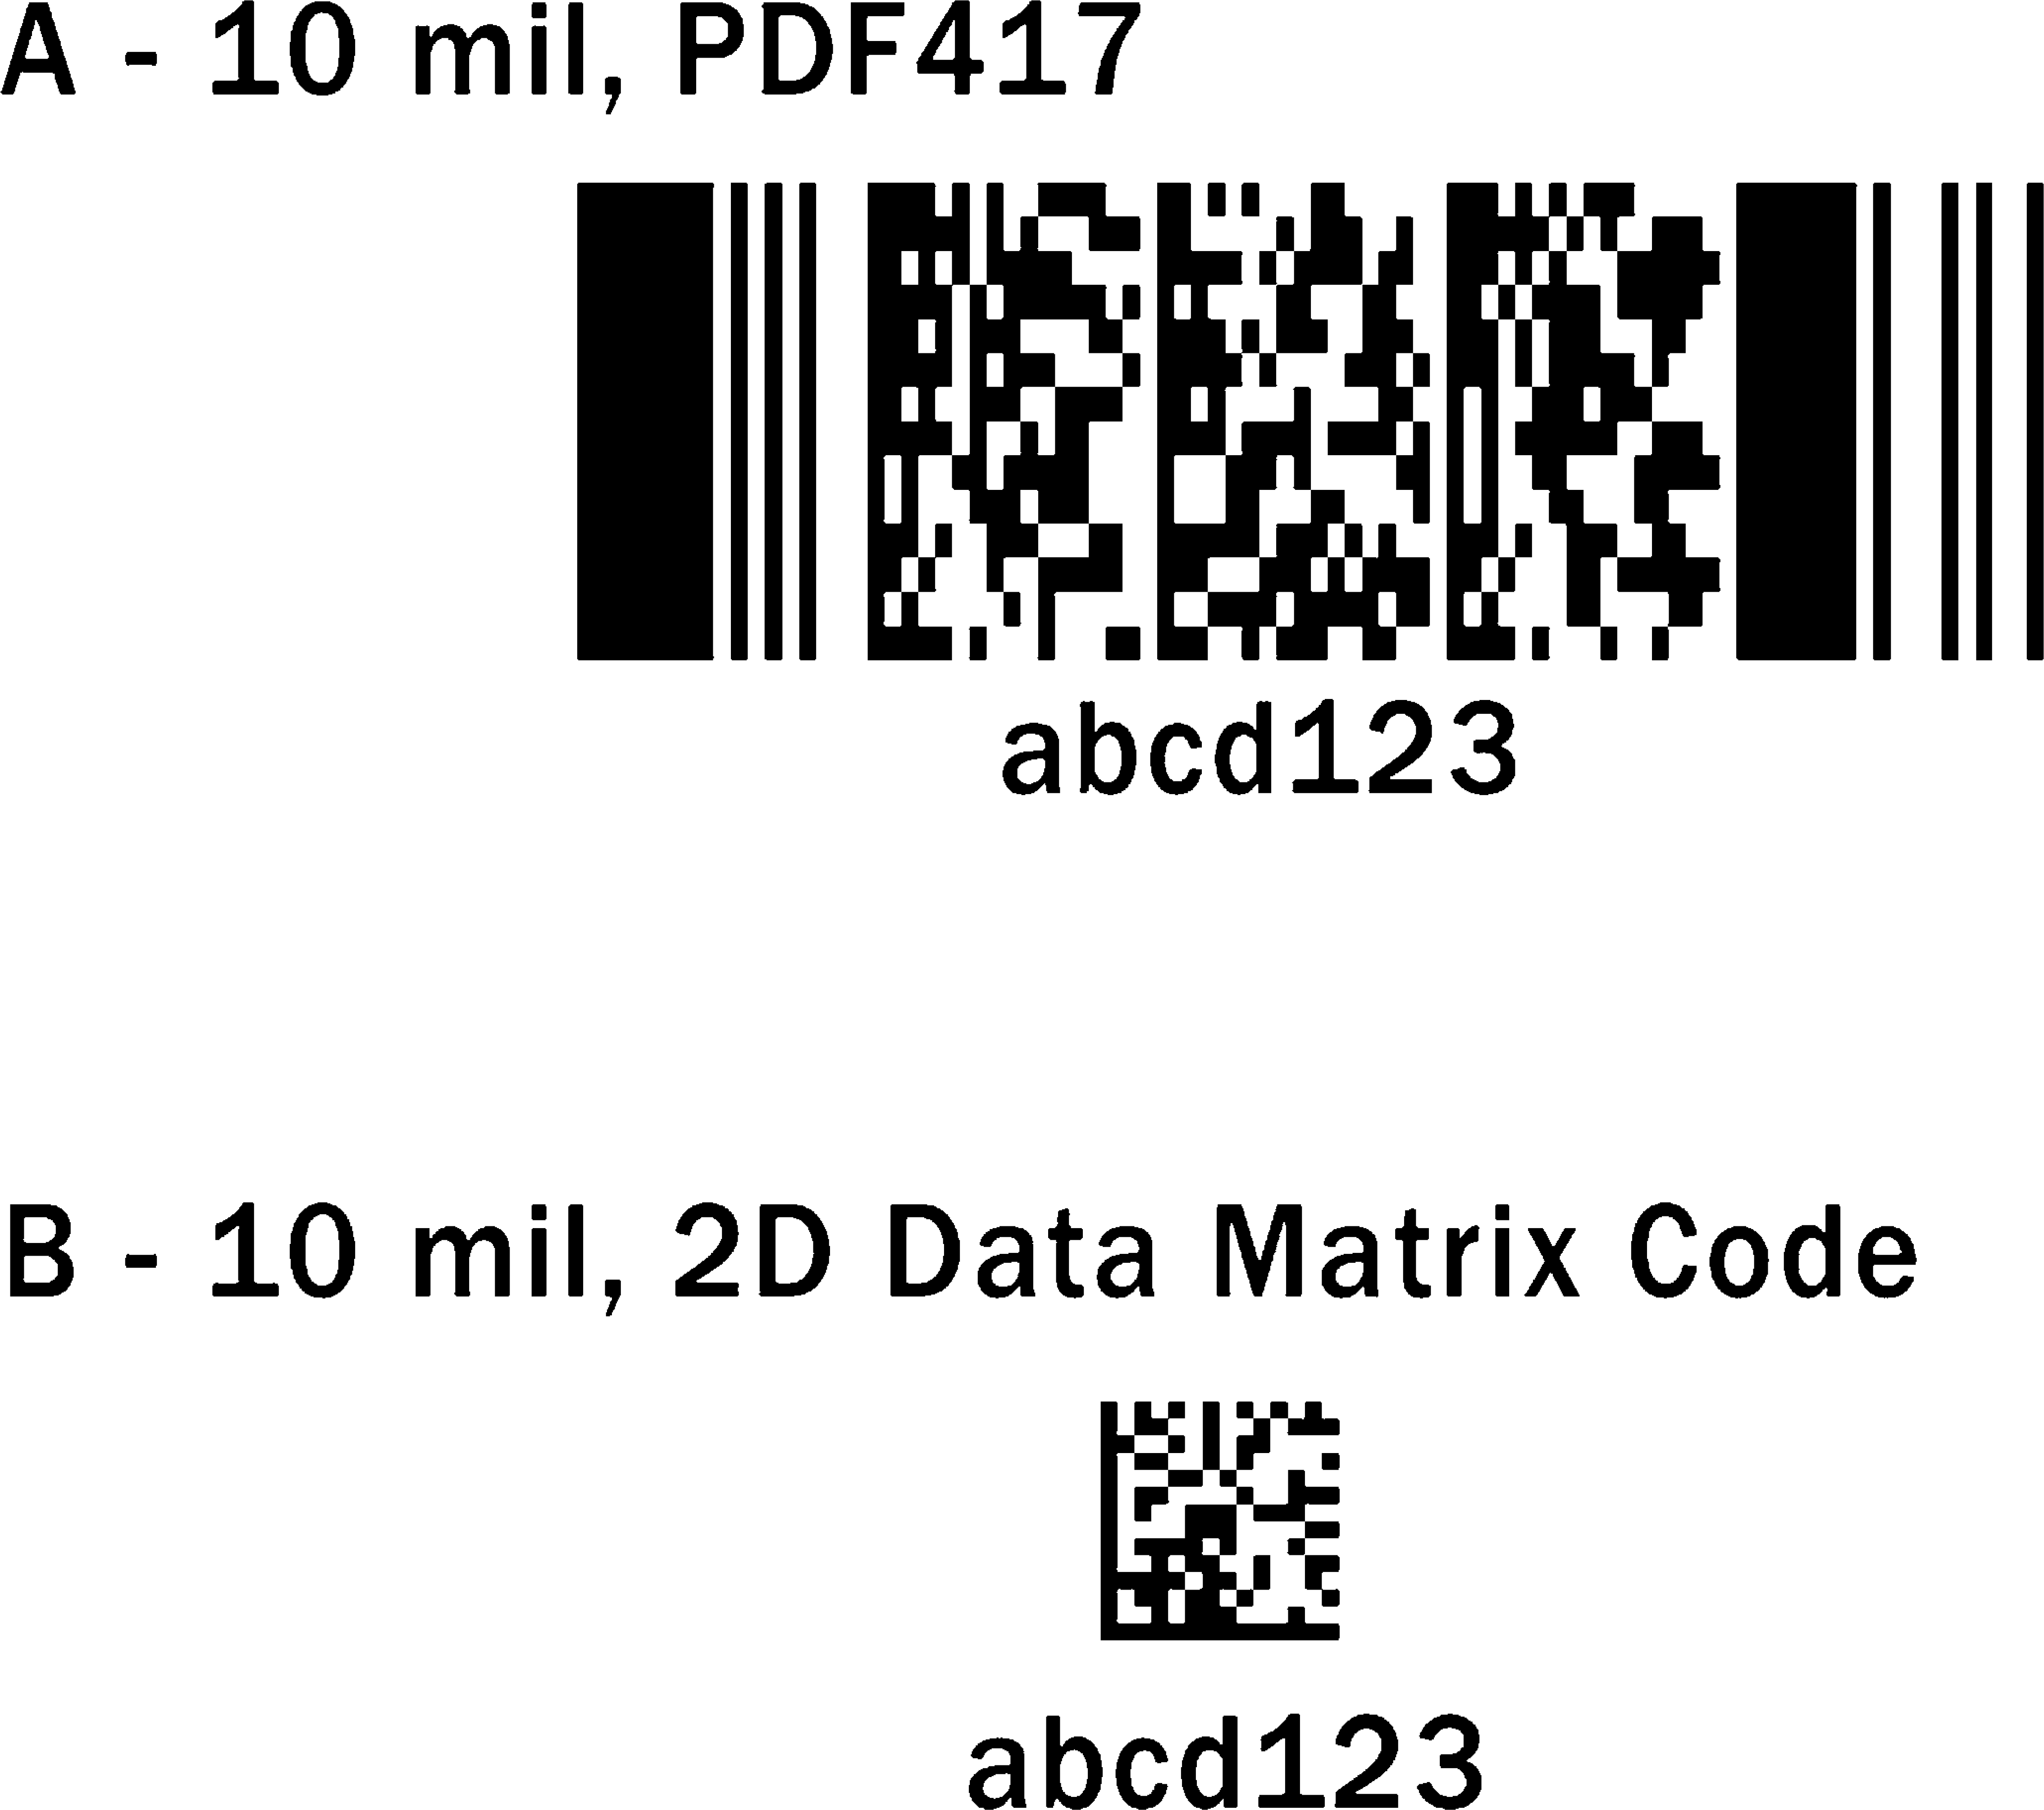
(A) An example of a 2D stacked bar code. (B) An example of a 2D matrix code.
Matrix Codes
Matrix codes are becoming increasingly popular in the life sciences for their data capacity and exceptionally small footprints. The most popular code in use today is Data Matrix (Figure 6). Originally developed by a NASA engineer for marking and tracking space shuttle parts, the symbol was introduced into the public domain in 1995, and the AIM standard released in 1996. 7
Data Matrix is primarily used for its small size and exceptional data capacity, capable of encoding up to 2335 alphanumeric characters. If there is 1 square inch of space on the bottom of a well or a slide, the item can be marked with a five- or six-digit Data Matrix symbol. Data Matrix has additional benefits as well. Data Matrix offers the robust Reed-Solomon method of error correction and has no orientation requirements. 8
The Data Matrix symbol consists of elements that resemble a checkerboard pattern. Since both the light and dark elements are the same size throughout the symbol, it can accommodate a variety of marking methods (Figure 7). The border of the symbol—or finder pattern—is composed of two sides forming an “L” shape and two sides alternating light and dark elements. The Quiet Zone requirement for Data Matrix is a one-element width on each side of the symbol. Data Matrix can have multiple data regions, separated by the “alignment pattern” of each symbol. Depending on the needs of the application, Data Matrix symbols can be either square or rectangular, making them exceptionally flexible for space-constrained applications. 9
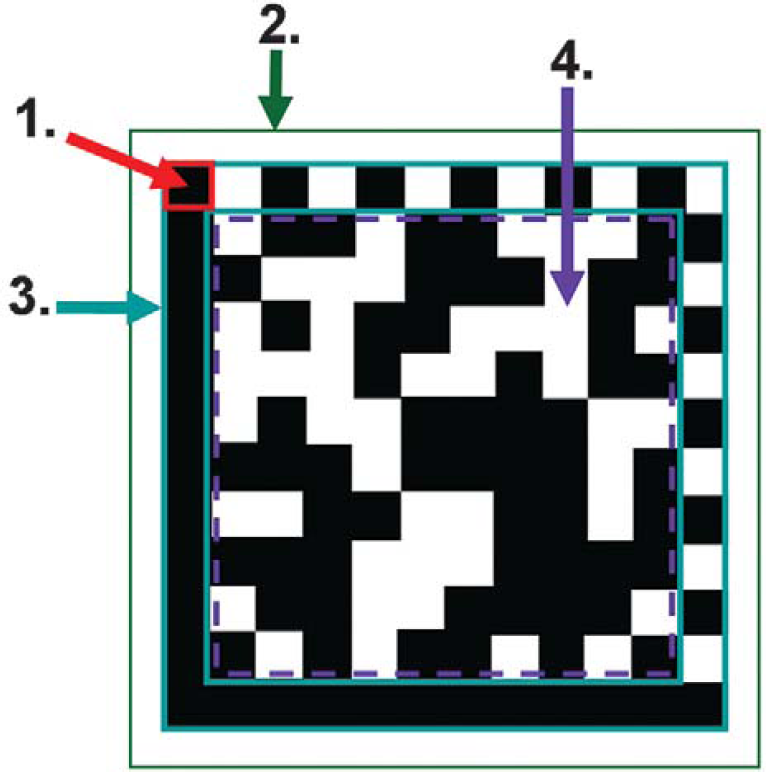
1. Element (module): Square-shaped cell that encodes one bit of binary data, “0” or “1.” 2. Quiet zone: The AIM specification calls for a minimum of one element width (1X) on each side of the symbol. 3. Structure Finder Pattern: The outermost rows and columns, composed of two solid lines and two alternating dark/light lines. The finder pattern is also used to define physical size, orientation, distortion, and the number of rows and columns in the symbol. 4. Data Region: The area inside the finder pattern, which contains the data and error correction codewords.
Advantages and Disadvantages: The primary drawback to using Data Matrix, like other matrix codes, is that it must be read with an image-based reader. Imagers are typically more expensive than a laser bar code scanner. However, for certain applications, Data Matrix may prove to be the only solution available. For applications such as marking each individual well on a microplate, Data Matrix provides the only viable option. A lab might also consider using Data Matrix for the high data security the symbol provides. Data Matrix can sustain a higher percentage of damage than a bar code can and still be readable.
How to Select a Bar Code
With so many different symbologies to choose from, it is easy to get overwhelmed trying to select the best bar code possible for an application. Before evaluating symbologies, first determine the objectives for the application. What does the bar code system need to accomplish? What function will it provide in the automation process? For example, a lab may need to determine the exact location of a specimen at any given time. Another objective may be to encode all relevant information into a bar code on reagent packs so that calibration and expiration date checking can be accomplished automatically.
Next, research all industry standards relevant to the application. Many industry associations have already selected a specific symbology or family of symbologies for certain applications. Some specifications are very general and simply recommend a symbology for a specific application. Other specifications are very detailed, specifying the density, row height, and additional formatting guidelines.
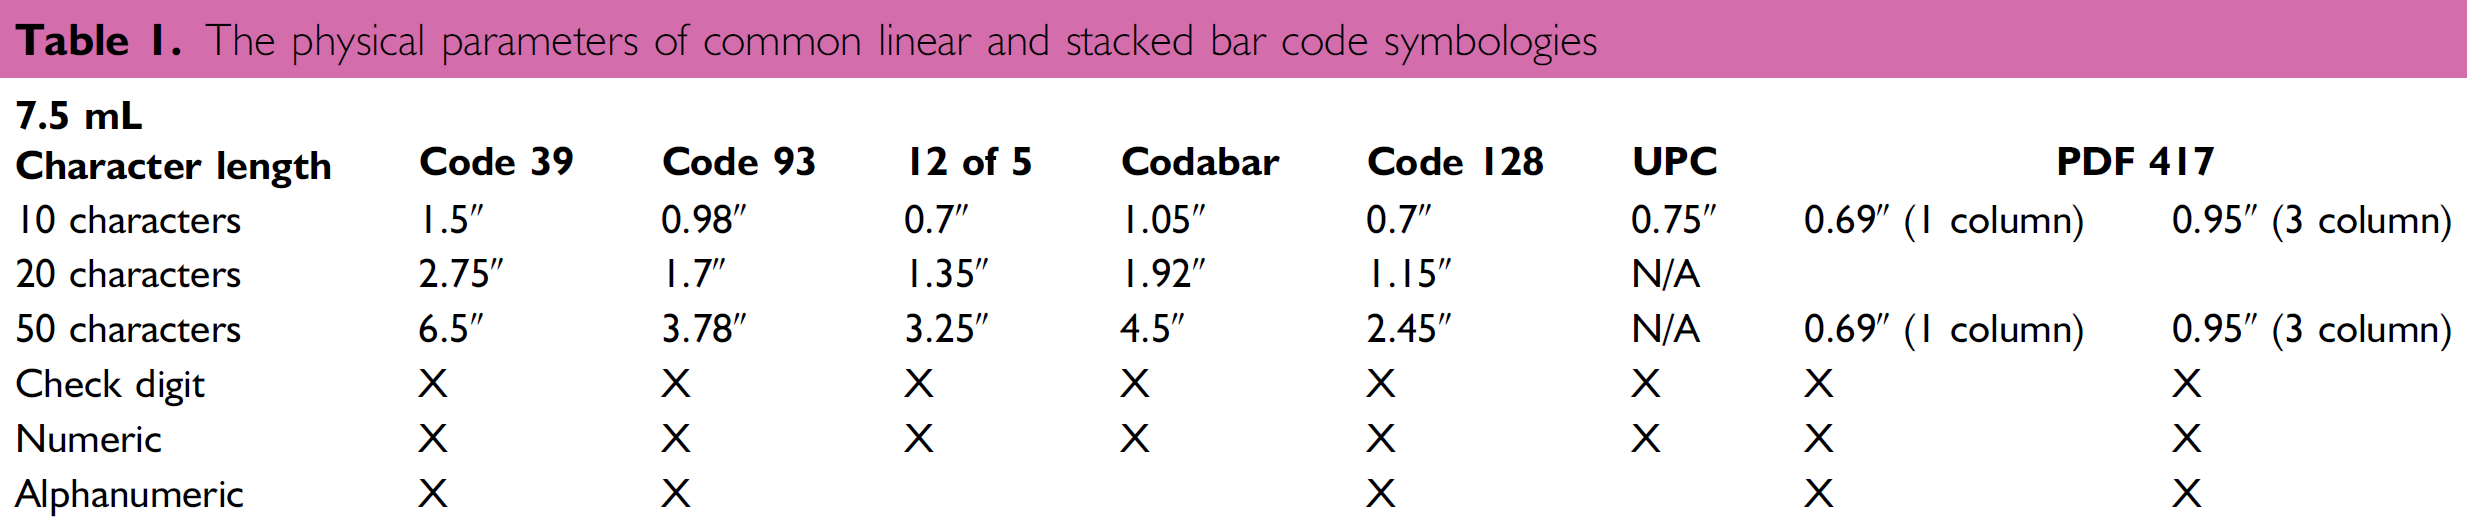
If there is not a standard that applies to the application, then determine the requirements and limitations of the application. First evaluate the physical requirements: How much real estate is available for the bar code? For the bar code reader? Table 1 provides the physical parameters of many standard bar codes. Next, select the required information to be encoded into the bar code. Will the data be numeric only, or will alphanumeric characters be required as well?
The physical parameters of common linear and stacked bar code symbologies
Evaluate the materials to be used. Will the code be applied directly to the object, or will the bar code be printed on a label first? What type of environment will the media need to withstand? Last, based on the real estate available, select a bar code element size (narrow bar). This dictates the overall physical size of the bar code. While selecting a narrow bar code width, evaluate the physical parameters of each of the symbologies under consideration to determine which one will meet the needs of the application.
Before a final decision is made, think about the future. Will the symbol need to contain more data in the future? Will the selected hardware or media meet future needs? For example, will new tests be added, imposing new environment demands on the bar code labels? When possible, try to meet the needs of tomorrow's applications at the same time. For example, if a lab is implementing a linear bar code system today, but plans to transition to matrix codes in 2 to 3 years, it may be more cost-beneficial to purchase imagers instead of laser scanners. While laser scanners may be less expensive, imagers can read both linear and 2D matrix codes, saving the lab the additional time and expense of replacing the laser scanners down the road.
Printing Considerations
Media
Before selecting a printing method, it is important to note that a label is not just a label. Labels consist of specific layers. Any variation in one of the layers changes the media's application. This is particularly important in the life sciences where labels must withstand many different changes in the environment, depending on the application. For example, bar code labels on microplates are often subjected to extreme environmental conditions. Freeze/thaw cycles and exposure to chemical solvents can affect the integrity of the adhesives. 10 Tables 2 and 3 provide reference information on the environmental performance properties of 1 mL polyester.
Environmental performance properties of 1 ml polyester
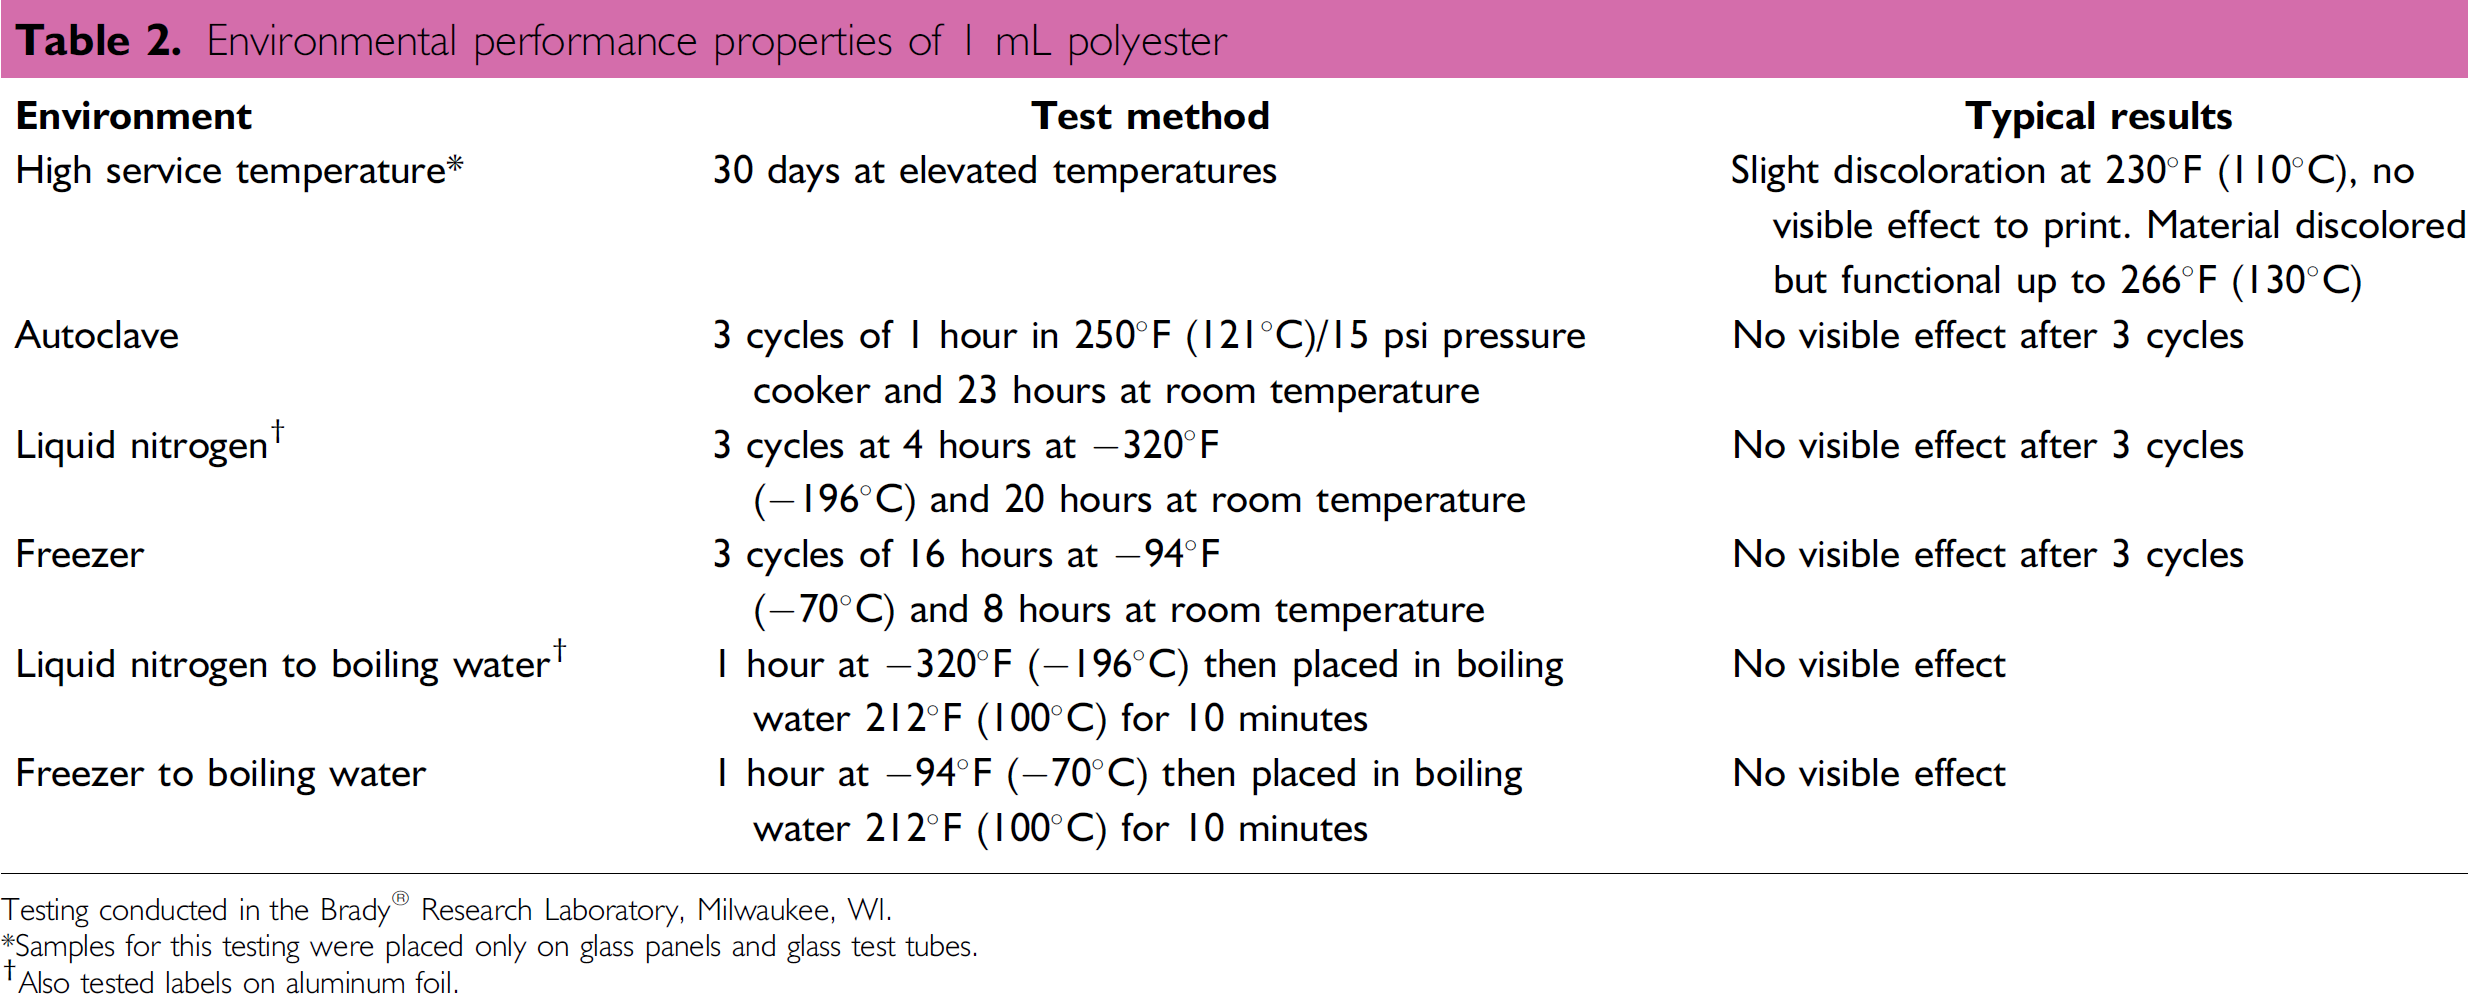
Testing conducted in the Brady® Research Laboratory, Milwaukee, WI.
Samples for this testing were placed only on glass panels and glass test tubes.
Also tested labels on aluminum foil.
Chemical performance properties of 1 mL polyester
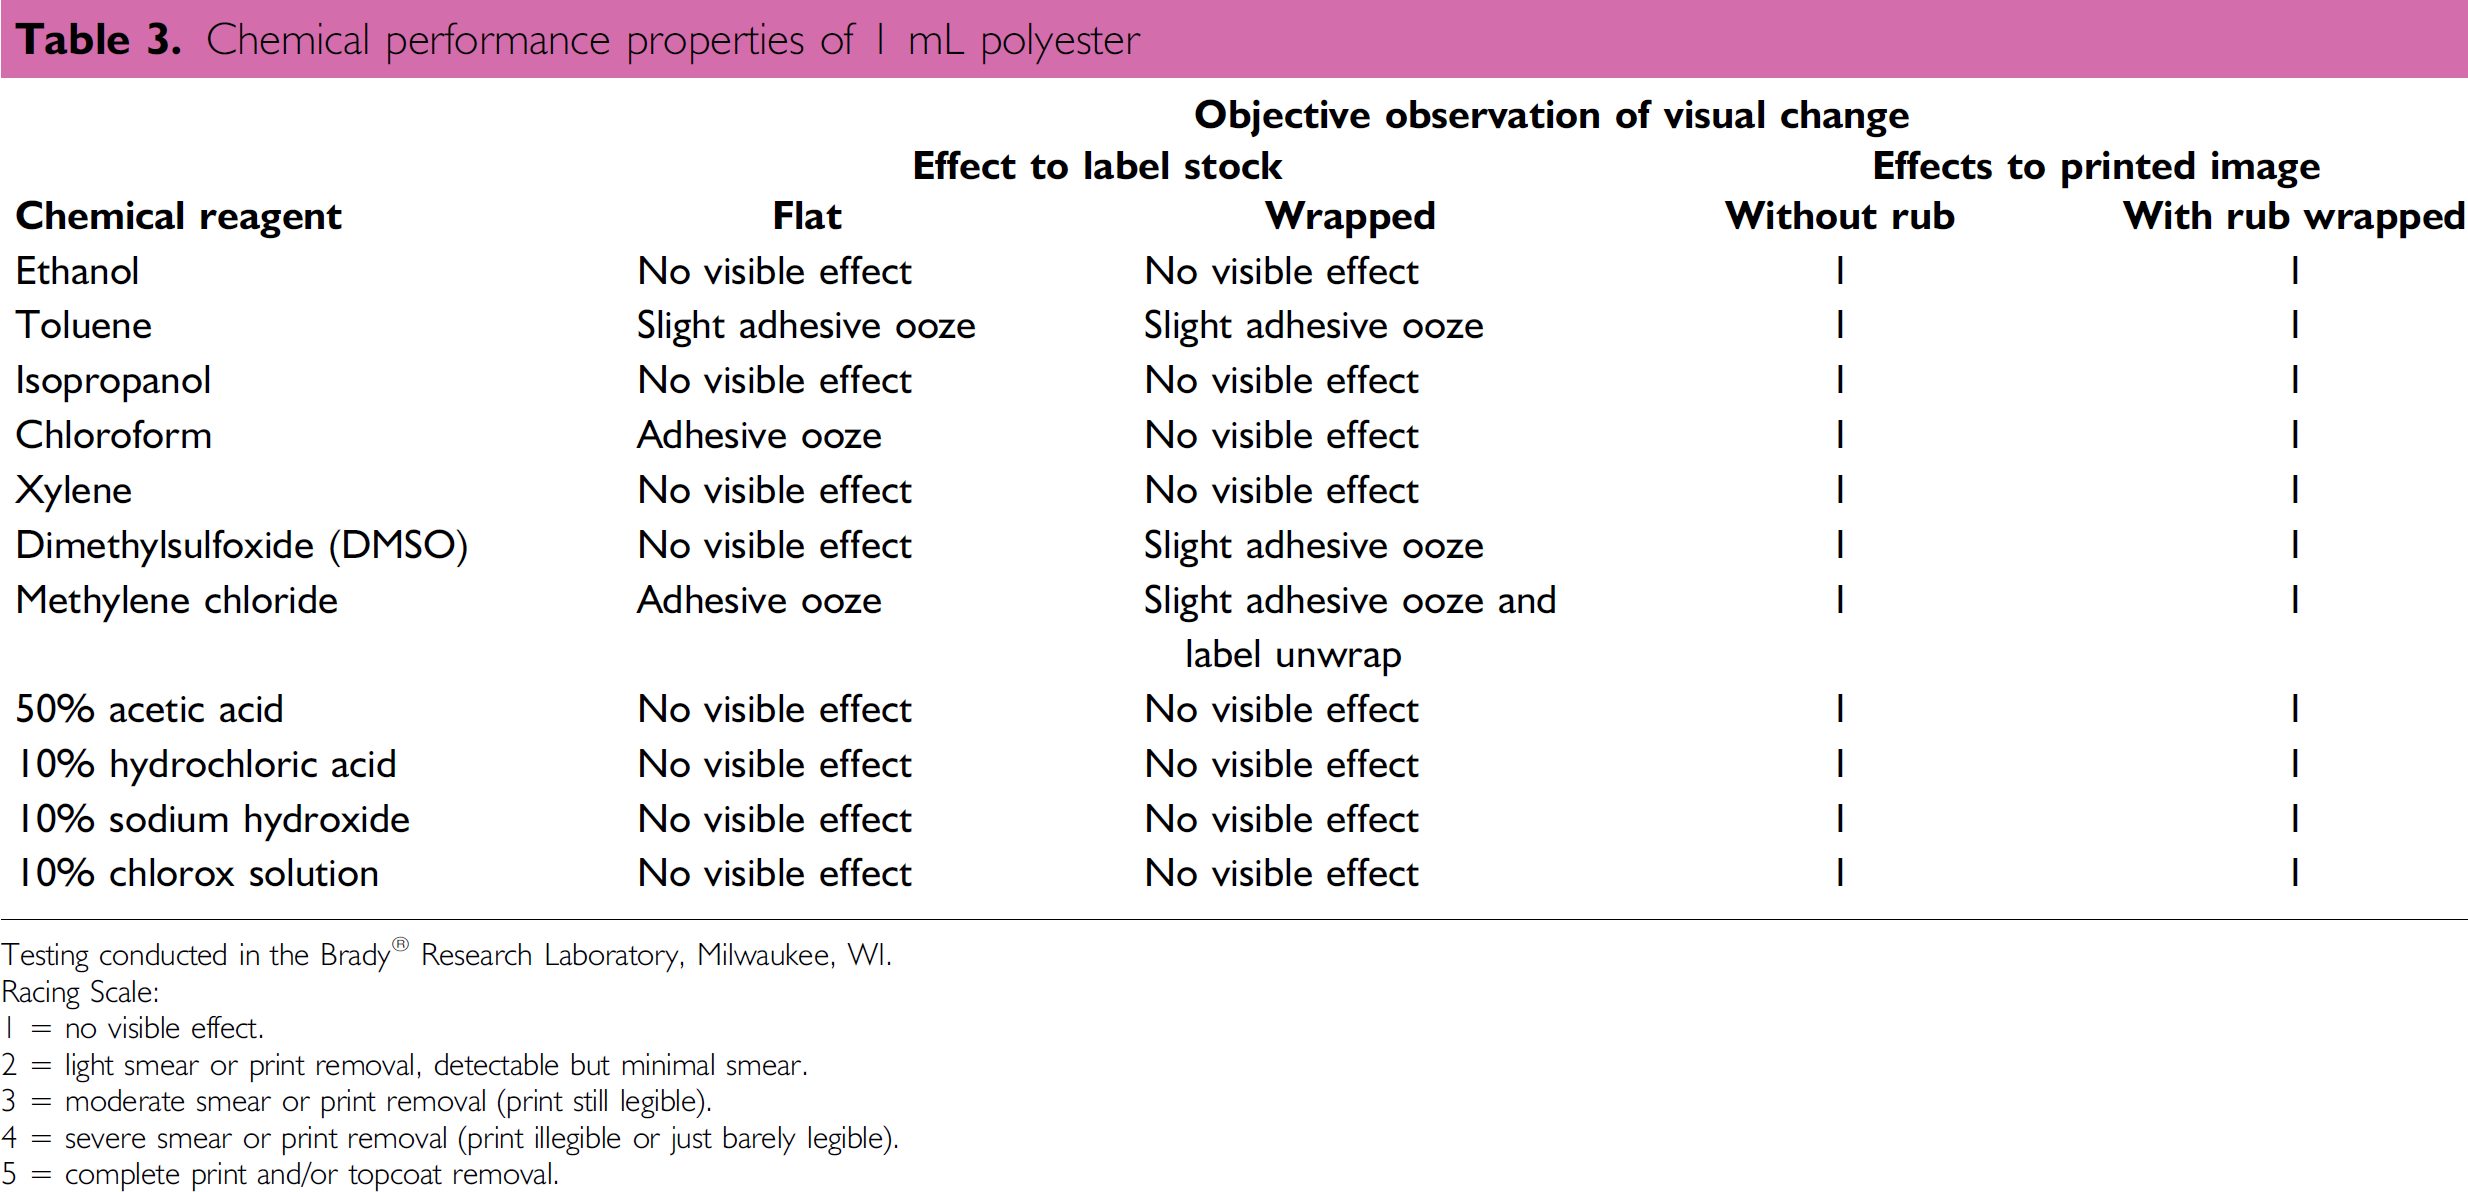
Testing conducted in the Brady® Research Laboratory, Milwaukee, WI.
Racing Scale:
1 = no visible effect.
2 = light smear or print removal, detectable but minimal smear.
3 = moderate smear or print removal (print still legible).
4 = severe smear or print removal (print illegible or just barely legible).
5 = complete print and/or topcoat removal.
Printing
The printing options available to laboratories can be placed into two categories. The lab must first decide whether to print the labels themselves or have them pre-printed. There are two common methods of off-site printing. Preprinted labels can be purchased from a label manufacturer and then applied on site either by hand or by an automated machine. Or the lab can choose to purchase pre-labeled plates from a plate vendor. Some vendors also offer microplates with pre-marked individual wells. 10
Off-site printing is best for large volumes of labels containing fixed data that does not change. Print-on-demand, on-site printing is better suited for small to medium volumes of labels or for applications with variable data. There is less waste involved, and the time required for inventory management of label stock is minimal. There are several different print-on-demand methods of printing available to laboratories:
In the
Selecting a Scanner
As with selecting a symbology, determining the physical requirements of the application will help determine which type of bar code scanner should be used for the most optimal results.
First, determine if the application requires a hand-held scanner or a fixed-position scanner. The easiest way to determine this is to answer the question: Does it make more sense to present the bar coded object to the scanner or the scanner to the bar coded object? Even applications that are typically thought of as hand-held applications are extremely successful applications for a fixed-position scanner. Depending on the object and the chemicals involved, it may be more convenient to place an object within the field of view of a fixed-position scanner than to pick up a hand-held scanner, maneuver it around until it reads the bar code, then set the scanner back down again.
What Type of Symbology Will Be Used?
Consider what type of symbology will be used and the object it will be applied to. If the application calls for a linear black-on-white bar code printed on a thermal-transfer label, a wide selection of bar code scanners should be able to read it. If the application calls for a Data Matrix code etched onto a glass slide, an image-based reader will be required.
How Far is the Bar Code from the Scanner?
Another important consideration is the required distance between the bar code reader and the bar code being scanned. The physical distance, along with the X-dimension of the bar code, will determine the read range capabilities.
Is code Placement Consistent?
Are the bar code labels hand-applied or applied by a machine? Will the bar codes always be in the same location or orientation? The answers to these questions will help determine what type of scan pattern may be required.
What is the Speed of the Application?
The speed requirements of an application are determined by three factors: the speed the bar code is traveling past the reader, the bar code orientation (ladder or picket fence), and the row height of the bar code. Row height is especially important for bar codes in the ladder orientation. As a general rule, in order to ensure a good read on a symbol, Microscan recommends that the bar code reader obtain a minimum of five good reads on the label.
What are the Environmental Conditions?
Will the scanner be located inside a freezer? Will it need to read bar codes with condensation on the labels? Will it be exposed to chemicals? If the environment is particularly harsh, work-arounds can always be created to fit the needs of the application. For example, air can be blown on the bar code reader's window to control the buildup of condensation.
Conclusion
Bar codes are a key piece in the laboratory automation puzzle. While the number of different factors initially may appear large, the implementation of tracking with bar codes can, and has been, successfully implemented.
Key steps to success include:
Identifying objectives and requirements of the completed solution.
Assessing future needs.
Having good communication of requirements to all vendors to minimize unforeseen surprises once the solution is implemented.
Acknowledgments
The authors would like to thank James R. Gross, Laboratory Market Manager at Brady®, Milwaukee, WI, for providing information on the various printing methods and label media available to laboratories. They would also like to thank Matt Allen, Product Marketing Manager at Microscan Systems, for his helpful discussions during the development of this tutorial and for reviewing the manuscript.