
Abstract
This paper documents the large differences in hours of work between the US and many European countries and how these differences have changed over time. It then discusses different explanations for these differences and presents evidence to suggest that it is differences in the scale of government activity, financed by taxes that distort the incentive to work, that are the prime factor behind the differences.
Introduction
The decision of how much time to devote to market work versus other activities is one of the most basic economic choices that an individual faces. For most individuals, income from working is the dominant source of income, and so the decision about how much time to devote to market work largely determines the amount of consumption that an individual can enjoy. Given the importance of the decision of how much time to devote to work, it follows that the labour market is of key importance to most individuals.
When comparing the economic outcomes of the US and Europe, some of the most dramatic differences can be traced to outcomes that are determined in the labour market. In particular, one of the largest differences in economic outcomes in the US and many European countries is the amount of time that individuals devote to work–-in many European countries the amount of time devoted to market work is as much as 30% lower than it is in the US. To put this number in perspective, note that a decrease in hours of work on the order of 3% relative to trend is viewed as a large recession. The cross-country differences just referred to are almost an order of magnitude larger.
What lies behind these large differences? Why do the labour markets in Europe and the US generate such different outcomes? This article argues that the likely source of these differences is in the differing degrees to which governments distort the costs and benefits of market work. While there are many differences across these economies in polices and regulations that can impact on labour market outcomes, it is the much larger scale of government activity, which is largely financed by taxes that are effectively taxes on labour, that is chiefly responsible for these differences.
Differences in labour market outcomes
Perhaps the most basic labour market outcome is the amount of time devoted to work. We begin with a look at the cross-country data on hours worked for 2005. The basic message of this analysis is not affected by the choice of year, but I want to avoid recent data that is influenced by the current economic contraction. The measure used here of hours of work is based on data taken from the OECD. Specifically, for each country, aggregate hours of work are computed as the product of two series that are available from the OECD labour market database: total civilian employment and annual hours of work per person in employment. It is important to note that the measure of annual hours of work per person in employment attempts to take into account not only the length of the standard workweek but also the number of statutory holidays, sick days and vacation days. To compare aggregate hours of work across countries one has to make some normalisation based on population. One could imagine different normalisations, such as the entire population, the adult population (those aged 15 and over) or the working age population (those aged 15-64). The resulting patterns are not much affected by this choice, and the numbers I report are based on dividing total hours by the size of the working age population. Table 1 reports hours of work across countries, organising the countries into four groups based on their hours worked.
Annual hours worked per person aged 15-64 (2005)
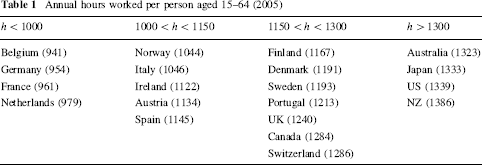
As previously noted, the magnitude of the differences across countries is dramatic. Several European countries have hours of work almost 30% lower than in the US. This magnitude of difference is similar to the decrease in hours of work that occurred in the US during the Great Depression.
What I want to argue next is that these differences predominantly reflect the choices that individuals make. The key issue here has to do with the extent to which the above differences might be due to differences in unemployment rates. If this were to be the case then we might argue that the differences do not reflect the different choices that individuals make, but rather the extent to which labour markets allow individuals to realise their choices. It is well known that unemployment rates in many European countries have been persistently higher than those in the US. Table 2 shows the unemployment rates for the same set of countries as in Table 1, once again grouped into four categories.
Unemployment rates (2005)
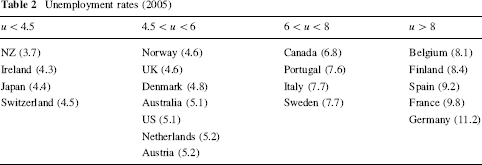
Many of the European countries with low hours of work in Table 1 also have high unemployment rates, and so one might conjecture that the reason for the low hours of work lies in the higher rate of unemployment. However, a simple calculation reveals that the differences in unemployment represent a very small fraction of the differences shown in Table 1. To see this, imagine the following calculation. In each country, take some unemployed workers and provide them with employment, and have them work the same number of hours as the average employed person. Do this until the unemployment rate in this country is the same as it is in the US. Once this is done we could ask again how the differences in total amount of work varies across countries. If we do this for France, for example, then we would find that whereas Table 1 shows annual hours worked in France to be 378 less than in the US, the modified number would have hours worked in France being 343 less than in the US, a decrease of less than 10%. Hours worked in France would still be more than 25% less than in the US, which is still a huge difference, so that the adjustments for unemployment do little to change the basic observation. 1
Understanding the differences in unemployment rates is interesting in its own right, since unemployment is potentially influenced by different forces. I refer the reader to papers by Krugman [9], Bertola and Ichino [1], Ljungqvist and Sargent [10], Marimon and Zilibotti [11], Mortensen and Pissarides [13], Blanchard and Wolfers [2], Daveri and Tabellini [3], Nickell, Nunziata and Ochel [14], Pissarides [16] and Hornstein, Krusell and Violante [8] for an analysis of this issue, and the role played by different labour market policies.
Accounting for the differences
So how can we understand these large differences in the amount of time that individuals in different countries choose to devote to work? What factors can create such large differences? These are the questions that I address in this section.
Cultural differences?
One explanation that is often offered to account for these large differences is that Europeans are ‘different’ from Americans: they enjoy leisure time more or are less focused on work. I think everyone would agree that different individuals feel differently about trading off consumption for leisure, with some individuals valuing leisure more than consumption relative to others. These different preferences show up in the choices that individuals make, in terms of what occupations to go into, how hard to work to get promoted and so on. Within any country we therefore expect to see a lot of variety across individuals. But is it reasonable to think that there are systematic differences across individuals who live in different countries?
One problem with this argument is that the time series data offer a very different view. In particular, the measure of hours worked that we used in Table 1 is available going back as far as 1956. Table 3 shows the distribution of hours worked at that time.
Annual hours worked per person aged 15-64 (1956)
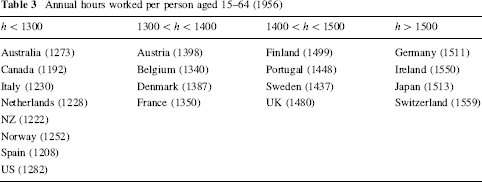
Two features are worth noting. First, the average level of hours worked in 1956 is much higher, with most of the countries above 1300 hours per person per year, in contrast to 2005 which had most countries below 1300 hours per person per year. But second, and most interesting for the present discussion, is that in 1956 the US was near the bottom of the distribution, and many European countries, including Belgium, France and Germany, had higher levels of work than the US. Whereas Germany was in the bottom part of the hours worked distribution in 2005, it was in the top part of the distribution in 1956. These data are hard to square with the simple view that Europeans like leisure more than Americans. If this is the case why did this not show up earlier? Of course, one could argue that preferences for leisure have changed more in Europe than in the US, but at a minimum this type of explanation does not seem very appealing, as it only begs the question as to why preferences have changed by different amounts in different countries.
The role of government
It is instructive to examine more closely the changes in hours of work between 1956 and the present. Figure 1: Hours worked in the US and continental Europe shows the evolution of hours worked since 1956 for the US and the average of four countries from continental Europe–-Belgium, France, Germany and Italy.
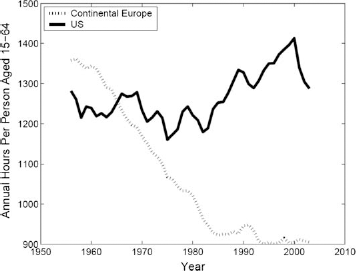
Hours worked in the US and continental Europe
The figure reveals a striking pattern. Whereas hours worked in the US have basically fluctuated around the same level over the entire period, hours in Europe have declined precipitously, falling by roughly 35% relative to the US. But there is an interesting pattern to the decline–-it proceeds at a relatively constant rate from 1956 through to the mid 1980s, at which point it stops.
This figure is potentially very informative for helping us to identify factors that can account for the large differences that we currently see. In particular, Fig. 1 suggests that the factor that lies behind the large current differences should be something that was changing in Europe relative to the US at a relatively slow and steady pace from the mid-1950s through to the mid-1980s. There are several possible candidates that could come to mind. What I want to focus on here is one simple explanation. In particular, I want to focus on the role of taxes that are used to finance government-provided services and/or transfer payments. The idea that transfer payments funded by taxes on income or consumption can lead to lower hours of work derives from the standard model of labour supply that is presented in undergraduate textbooks. This model posits that the key decision of an individual regarding how much time to devote to work comes down to the trade-off between income, which is in turn used to buy more goods, and leisure. Government tax and transfer programmes distort this decision, and one can show that a tax on income, consumption or payroll that is used to fund a lump-sum transfer payment will lead to lower hours of work. The intuition is simple. When the government provides a transfer payment to individuals it reduces the incentive for individuals to work, since the transfer payment allows them to purchase some goods without working.
The broadest measure of the extent to which the government is engaged in taxation and redistribution is the ratio of current receipts of government relative to GDP, since this shows the amount of revenues that the government is taking in relative to GDP. It is instructive to look at the behaviour of this measure for the same set of countries we looked at in Fig. 1. This is done in Fig. 2 The size of government in the US and continental Europe.
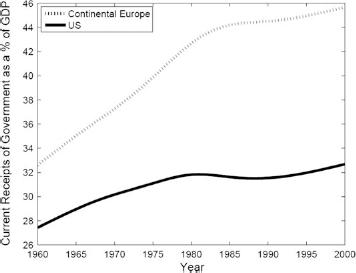
The size of government in the US and continental Europe
The picture is revealing. It shows that the size of government in the US and these four continental European countries was fairly similar in 1960, but that since that time the relative size of government in the four European countries has become much larger. Moreover, if one looks at the timing of the relative increase then one sees that the bulk of the increase occurs prior to 1985. The negative relationship between changes in hours of work and changes in the share of GDP that flows through the government is striking. This picture suggests that the increasing size of government may indeed have been a key factor in accounting for the very different evolution in time devoted to market work.
The analysis that I have presented here is very basic, having simply shown the strong negative relationship between the two key variables: hours of work and the share of GDP that flows through the government. Several papers have provided a more detailed and rigorous analysis of these data and reached a similar conclusion. Examples include Prescott [17], Rogerson [
A related issue has to do with understanding the fact that hours of work are relatively higher in Scandinavia than in continental Europe, despite the fact that a greater share of resources flow through the government in Scandinavia. Ragan [18] and Rogerson [21] have argued that labour income, consumption and payroll can account for the bulk of the decrease in hours worked in continental Europe.
Other explanations
There are of course many other differences between the US and the ‘typical’ European country. Examples include greater unionisation, more stringent employment protection laws and higher minimum wages. Although each of these factors may influence aggregate hours of work, fairly simple analysis suggests that none of these plays a dominant role. In the case of minimum wages the key fact to note is that the differences in hours of work basically extend across the entire spectrum of the workforce, not just among the young and the unskilled. So while minimum wages may have a lot to do with the higher levels of youth unemployment in Europe, I documented earlier that differences in unemployment per se are a relatively small part of the overall differences in hours of work. For the case of unionisation, the key piece of evidence is that there has been effectively no change in the relative share of workers belonging to unions in Europe relative to countries such as Australia, Canada, New Zealand and the US, which are the countries that have had the most stable hours of work over the last 50 years. And if one looks carefully at the changes in employment protection over time, the timing of changes in employment protection does not coincide with the patterns that we see in terms of changes in hours worked. Evidence of this is presented in Rogerson [19]. More formal analysis of these alternative explanations and in particular how they compare with the explanation that emphasises taxation and the size of government is contained in Ohanian et al. [15].
Additional evidence on the role of government
If higher taxes are largely responsible for the large differences across countries in hours worked, then perhaps there are other pieces of evidence that would also support this view. In this section I describe some related evidence that has to do with cross-country differences in how individuals allocate their time outside of market work. The intuition for looking at this is that higher taxes create an incentive for individuals to do more things for themselves rather than purchase them in the market. If you are working to purchase something in the market, then higher taxes imply that you have to work more hours in order to earn enough money to purchase a particular good or service. Since time spent in home production is not taxed, higher taxes serve to make it more economical to do things for oneself rather than purchasing them in the market. Examples include cleaning one's home instead of hiring someone to do it, providing childcare services instead of purchasing them in the market or cooking meals instead of eating out at restaurants. It follows that with all else constant, if one economy has higher tax rates than another economy then we would expect to see more time devoted to home production in the economy with a higher tax rate on labour. If the effects of taxes are sizeable, then these effects should also be sizeable.
Four recent studies offer information about differences in home and market work between the US and European countries based on time use studies. A common finding is that differences in market work are indeed significantly offset by differences in home work. Freeman and Schettkat [5] study time allocation data for married couples in Germany and the US in the 1990s. Whereas Americans devote more time to market work than do Germans, Germans in turn devote more time to home production than Americans. The striking finding is that when one adds up total time devoted to work (i.e., market work plus home production) it turns out that patterns in the two countries are virtually the same. This study also shows that the patterns of consumer expenditure differ in a corresponding fashion, that is, Germans spend more time on meal preparation at home and spend less money at eating establishments. Freeman and Schettkat [6] extend this analysis to a larger set of countries and report that as of the early 1990s, time spent in home production in European countries was about 20% larger than in the US. This implies that increased time in home production only partially offsets the decrease in time devoted to market work. Using data from the recent Harmonized Time Use Study, Ragan [18] compares several European countries with the US and finds that on average, individuals in Belgium, France, Germany, Italy and the Netherlands have between 15 and 20% more home work than do Americans. In a third study of time use data, Hamermesh et al. [7] reach a similar conclusion based on information for Germany, Italy, the Netherlands and the US. In particular, they find that Europeans engage in 15-20% more time in home production than do Americans. 3
In comparing countries using the 2003 data it is important to be aware of changes in survey design in the US. Relative to earlier surveys in the US, the American Time Use Survey, initiated as part of the CPS (Child Protective Services), tends to generate larger amounts of time reported to childcare. In the US this results in an almost 50% increase in time devoted to childcare relative to the 1985 time use survey data.
Related work has also been carried out by Davis and Henreksson [4]. Consistent with tax effects on home versus market production discussed above, they show that countries with higher marginal tax rates consistently have lower employment in those market activities for which there are good non-market substitutes. The size of the estimated effects that they find are large. An increase in taxes of one quarter of 1% leads to a decrease in the employment share equal to 2.4% in the broad set of sectors that have good home-produced substitutes. They find that tax effects are most noticeable in precisely these sectors.
Conclusion
This article has documented the very large differences in time devoted to market work across OECD countries, in particular between the US and many European countries. I argued that these differences predominantly reflect different choices that individuals make concerning the mix of leisure time and consumption. Finally, I argued that the most likely explanation of these large differences is the higher share of resources that flow through the government sector in Europe relative to the US, which basically reflects a much higher tax rate on labour and thereby distorts the incentives that individuals face when making their decisions about how much time to devote to market work.
Footnotes