
Abstract
Network theories have been put forward for psychopathology (in which mental disorders originate from causal relations between symptoms) and for personality (in which personality factors originate from coupled equilibria of cognitions, affect states, behaviours, and environments). Here, we connect these theoretical strands in an overarching personality–resilience–psychopathology model. In this model, factors in personality networks control the shape of the dynamical landscape in which symptom networks evolve; for example, the neuroticism item ‘I often feel blue’ measures a general tendency to experience negative affect, which is hypothesized to influence the threshold parameter of the symptom ‘depressed mood’ in the psychopathology network. Conversely, events at the level of the fast–evolving psychopathology network (e.g. a depressive episode) can influence the slow–evolving personality variables (e.g. by increasing feelings of worthlessness). We apply the theory to neuroticism and major depressive disorder. Through simulations, we show that the model can accommodate important phenomena, such as the strong relation between neuroticism and depression and individual differences in the change of neuroticism levels and development of depression over time. The results of the simulation are implemented in an online, interactive simulation tool. Implications for research into the relationship between personality and psychopathology are discussed. © 2020 The Authors. European Journal of Personality published by John Wiley & Sons Ltd on behalf of European Association of Personality Psychology
Keywords
Introduction
Research into the relationship between personality and psychopathology has established that there exist robust associations between personality traits and mental disorders (Kotov, Gamez, Schmidt, & Watson, 2010). For example, neuroticism is a well–established risk factor for developing generalized anxiety disorder (GAD; Kotov et al., 2010) and major depressive disorder (MDD; Kendler, Gardner, & Prescott, 2002; Kendler, Kuhn, & Prescott, 2004); antisocial personality disorder and substance use disorder are related to low levels of agreeableness and conscientiousness (Ruiz, Pincus, & Schinka, 2008); and extraversion is negatively related to social anxiety (Kaplan, Levinson, Rodebaugh, Menatti, & Weeks, 2015).
Several different theories have been put forward to explain how personality and mental health are related. One important answer, sometimes called the vulnerability hypothesis (Ormel et al., 2013), is that personality items measure personality traits and that these personality traits influence the liability to develop disorders. For example, high levels of neuroticism may make an individual more vulnerable to develop MDD, either by directly promoting the processes conductive to developing the disorder or by enhancing the effect of external adverse events that trigger depression. The most important evidence for the vulnerability hypothesis is the prospective correlation between personality and psychopathology, which has been established in several domains, most notably for the personality trait neuroticism and internalizing psychopathology (e.g. MDD, GAD; Saklofske, Kelly, & Janzen, 1995; Jylhä & Isometsä, 2006; Fanous, Gardner, Presczott, Cancro, & Kendler, 2002).
However, the vulnerability hypothesis is certainly not the only game in town. For instance, Ormel et al. (2013) discuss a number of other pathways through which the statistical association between neuroticism and mental disorders could arise (see also Lahey, 2009): (i) via common determinants (e.g. genes; Kendler & Prescott, 2007), (ii) because mental disorders are the endpoints of a continuum that, in the low range, captures normal variation in neuroticism (Krueger & Tackett, 2003), and (iii) because psychiatric disorders themselves increase levels of neuroticism, either permanently or temporarily (Monroe & Harkness, 2005; Ormel, Oldehinkel, & Vollebergh, 2004). Importantly, these explanations are not mutually exclusive: if neuroticism and MDD share part of their genetic background, this does not preclude the possibility that neuroticism induces vulnerability as well, and if the latter is the case, this does not rule out the possibility of permanent negative effects. Distinguishing between these possible scenarios is difficult due to the structural confounding of risk factors and the infeasibility of many interventions that might disentangle the influences of different variables. In fact, it is not clear that it makes sense even to try to distinguish between these scenarios, as each of them may be correct—if only for some individuals some of the time.
Rather than trying to disentangle effects empirically, in the present paper, we approach the problem from the opposite perspective and will propose a modelling framework that allows us to represent all of these different processes in one and the same model. Our point of departure is that of a complexity perspective, in which one could see mental health as an ecosystem, meaning that it contains various elements from varying domains, which all interact in order to maintain a healthy balance. In this human ecosystem, a person's cognitions, feelings, behaviours, and environmental features are all in constant interaction with each other (Scheffer et al., 2018). Thus, instead of trying to separate all elements of the system and reducing them to distinct factors, we aim to integrate them into a single theoretical framework. The network approach to psychopathology (Cramer, Waldorp, van der Maas, & Borsboom, 2010; Cramer et al., 2013; Cramer et al., 2016; Borsboom, 2017) offers a useful starting point for such an approach, because (i) it offers a set of formalized models that represents the interaction between different systems and (ii) network theories have been proposed both for the aetiology and the remission of (episodic) mental disorders (Borsboom, 2017; Cramer et al., 2016) and for personality (Cramer et al., 2012). In the network perspective, the question of how to represent the relation between personality and psychopathology thus boils down to the question of how these different networks interact. To answer this question, our central proposal will be to use theoretical and methodological tools from the literature in ecology that deal with the interaction between slow processes (e.g. gradual change of vegetation in an ecosystem over decennia) and fast processes (e.g. monthly fluctuations in the size of populations of insects living on the vegetation; Ludwig, Jones, & Holling, 1978; Rinaldi & Scheffer, 2000). In particular, we propose that the personality network may be primarily understood in terms of a slow process, in which the individual seeks an equilibrium with the environment (Cramer et al., 2012), while the fast process primarily involves the dynamic interactions between symptoms in a symptom network (Borsboom & Cramer, 2013), which in turn feeds back into the slow process.
This paper is organized as follows. First, we introduce the model wherein personality and psychopathology are both represented. Here, we will shortly describe current network theories of psychopathology and personality and how to integrate these domains, which operate on different time scales, into a single model. Second, we will apply the model to the relationship between neuroticism and MDD. For this purpose, we present a simulation that illustrates the explanatory potential of the model by showing how it represents well–known phenomena in the literature, as well as an interactive online simulation app that allows users to simulate the applied model. We end with discussing the implications of the framework for future research.
The Personality–Resilience–Psychopathology Network
Figure 1 presents a general schematic overview of the personality–resilience–psychopathology network (henceforth: PRP network). The model represents both psychopathology and personality as complex networks, thus incorporating network theories as have been suggested in the respective literatures (Borsboom, 2017; Borsboom & Cramer, 2013; Cramer et al., 2010; Cramer et al., 2016). The PRP network connects these perspectives by proposing that psychopathology and personality also influence each other, namely, by altering their respective network structures and variables through interactions that take place on different time scales. In the current paragraph, we shortly discuss the relevant network theories, after which we outline a proposal for connecting them.
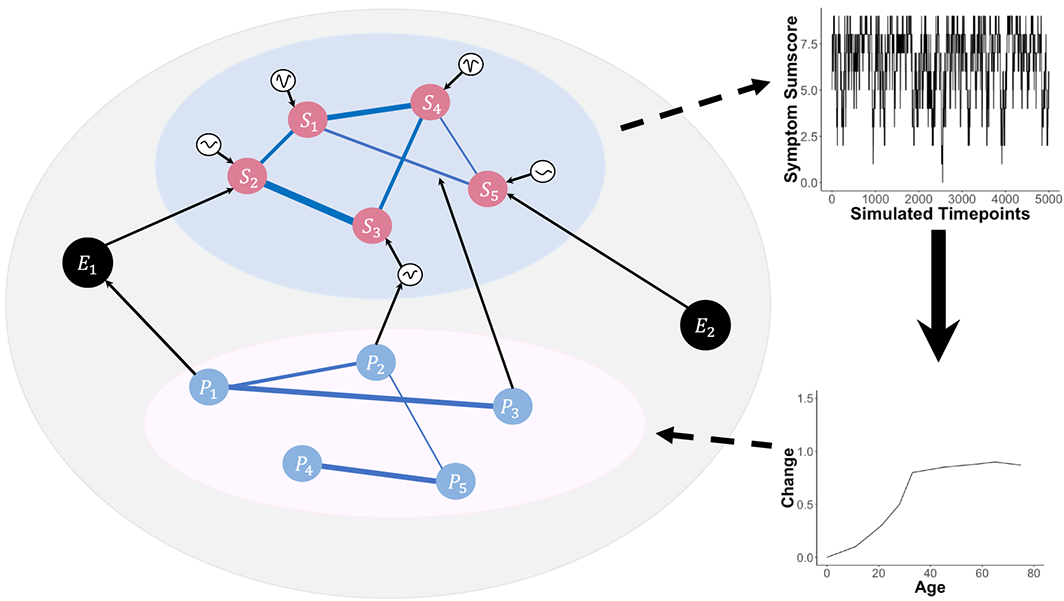
The personality–resilience–psychopathology network model. The lower system represents a network of personality traits (P1–P5) that co–evolve over periods of years, which is the slow process. The upper system represents a psychopathology network, in which nodes are symptoms (S1–S5) and thresholds are resilience parameters influencing the nodes (represented as dynamical landscapes connected to the nodes). The black nodes (E1 and E2) represent environmental factors. Personality nodes can influence the psychopathology network by shaping threshold parameters or edge connectivity strengths. The personality nodes can also influence the environmental factors, which in turn can influence the psychopathology symptoms directly. The plots on the right represent the dynamics of the processes, which operate on different time scales; arrows between the plots indicate the feedback process by which features of the fast network (e.g. a disorder state) influence the variables in the slow network (e.g. stable cognitions or tendencies to display certain affect states). [Colour figure can be viewed at wileyonlinelibrary.com]
A Network Perspective on Psychopathology and Personality
According to the network perspective (Borsboom, 2017; Borsboom & Cramer, 2013; Cramer et al., 2010; Cramer et al., 2016), psychological constructs such as psychopathology behave as complex systems, in which symptoms of mental disorders directly influence each other. Examples include causal effects of insomnia on concentration problems or fatigue in the case of major depressive episode (MDE; Cramer et al., 2010); the effects of unusual perceptual experiences (e.g. hallucinations in which one sees dead people) on delusions (e.g. the conviction that one has paranormal abilities and is destined to perform particular tasks) in schizophrenia (Isvoranu et al., 2016); and the effect of obsessions (e.g. the persistent conviction that one is dirty) on compulsions (e. g. powerful urges to respond to the obsession, as through handwashing) in obsessive compulsive disorder. Typically, these complex causal systems are represented in a network structure, where nodes represent the relevant variables (e. g. depression symptoms) and the connections, called edges, represent the direct interactions between these nodes. Such interactions are typically theorized to occur on a relatively short time scale of days to months; an apt analogy is the idea of a set of domino tiles that knock each other over (Borsboom, Cramer, Schmittmann, Epskamp, & Waldorp, 2011).
A fundamental assumption behind the network perspective on psychopathology is that symptom networks can be characterized in terms of an attractor landscape, in which mental health is a stable state in which no or only a few symptoms are activated (Borsboom, 2017). This attractor landscape controls the dynamic behaviour of the system as it reacts to perturbations (Dakos, Carpenter, van Nes, & Scheffer, 2015), which could be adverse life events, such as losing a loved one or becoming ill, both of which are known precipitating factors in the development of internalizing disorders (Keller, Neale, & Kendler, 2007). In this way, the underlying attractor landscape wherein the network evolves is related to the resilience of the network. Psychological resilience refers to the ability to maintain or quickly bounce back into a healthy state after facing some adversity (Werner, 1995; Masten, 2001; Bonanno, 2004; Kalisch, Müller, & Tüscher, 2015; Kalisch et al., 2019; Scheffer et al., 2018). Therefore, if the network structure is such that the healthy stable state is resilient, the system will not enter a prolonged state of persistent symptom activation, but instead quickly recovers from perturbations (Cramer et al., 2016; Scheffer et al., 2018). In contrast, individuals who are not resilient are more prone to developing a mental disorder after suffering from a stressful life event (SLE). If the network structure is such that the healthy stable state easily collapses into a state of persistent symptom activation, the system is vulnerable (Cramer et al., 2016). Individuals whose psychopathology symptoms are represented in a vulnerable network structure are more prone to developing a mental disorder after suffering from an SLE.
From a network perspective, personality can be viewed as a slowly evolving network structure, which is characterized by the co–evolution of relatively stable cognitions, affect states, behaviours, and environments (Cramer et al., 2012). Although the fundamental modelling ideas behind network approaches to psychopathology and personality are very similar, symptom dynamics of (episodic) psychopathology usually operate on a shorter time scale (e.g. days, weeks, or months) and as such more naturally lend themselves to the domino–tile metaphor. The evolution of personality, in contrast, may be better thought of in terms of a system of coupled, slowly evolving equilibria (e.g. on a time scale of years or decades). For example, as a person develops the general tendency to participate in social interaction, social skills will co–develop with this tendency in a mutualistic fashion (van der Maas et al., 2006). If a person is generally anxious in social situations, however, the opposite effect will occur. Therefore, this process will be characterized by seeking equilibria with the environment; for instance, it is likely that a more socially skilled individual will seek out an environment that involves a larger degree of social interaction. Similarly, if conscientiousness develops to a larger degree, a person will be more likely to function well in a situation that requires this trait. In this way, individuals slowly ‘carve out’ patterns of characteristic functioning in corresponding environments, and the network theory suggests that precisely these stable patterns are picked up in typical personality tests.
The development of stable personality patterns is likely to be subject to both genetic and environmental influences (Boomsma, Busjahn, & Peltonen, 2002; Eaves & Eysenck, 1975; Franić, Borsboom, Dolan, & Boomsma, 2014; Kendler, Neale, Kessler, Heath, & Eaves, 1993) impinging on the development of personality traits (i.e. characteristic dispositional tendencies to experience certain mood states or to act in a particular manner), personality architectures (i.e. coherent sets of interlocking knowledge and appraisal structures; Mischel & Shoda, 1995; Cervone, 2005), and functional relations between elements of the personality structure (Baumert et al., 2017; Wood, Gardner, & Harms, 2015). As such, we hypothesize that individuals will display variations in the structure and parameters of the resulting personality networks.
The Integration of Psychopathology and Personality Networks
To conceptualize the relation between personality and psychopathology networks, we pursue ideas taken from the ecosystems literature, in which this question often arises (Ludwig et al., 1978; Rinaldi & Scheffer, 2000; Walker, Carpenter, Rockstrom, Crépin, & Peterson, 2012). In the ecosystems literature, a common way of representing slow–fast interactions is by taking variable values in the slower process (e.g. gradual change of vegetation in an ecosystem over decennia) to affect parameters of the faster process (e.g. monthly fluctuations in the size of populations of insects living on the vegetation). At a given time point, the fast process is then evaluated for its equilibrium, with the variables of the slow process held constant. The fast process is also allowed to have causal effects on the slow process, because properties of the equilibrium distribution of the fast process can influence the values of variables in the slow process (DiFrisco, 2017).
In the current framework, this means that personality traits (which can be viewed as the slow process) operate as parameters of the psychopathology network (which can be viewed as the fast process). Through this mechanism, the slow–changing personality traits regulate the resilience to external perturbations of faster changing psychopathology symptom networks. However, as the fast process unfolds over time, its properties can also alter certain parameters in the slow process; for example, having a depressed episode can itself change some of the slow–changing personality traits (e.g. increasing neuroticism or decreasing extraversion).
Naturally, the distinction between slow and fast processes is not absolute; we do not propose a categorical difference between personality and psychopathology with respect to the time scales at which they operate. Indeed, some personality changes (e.g. learning new coping mechanisms) can be fast with respect to some psychopathology (e.g. slowly evolving negative symptoms of schizophrenia). In addition, some aspects of personality dynamics can operate on a faster time scale (e.g. Fleeson, 2001; Cervone, 2005; Mischel & Shoda, 1995; Wood et al., 2015). The current approach should not be interpreted as suggesting a fundamental distinction in this respect. However, we do suggest that, in general, the development of personality involves the generation of a relatively stable and coherent pattern of thoughts, affect states, and dispositions to behave in characteristic ways, while episodes of psychopathology typically are seen as reflecting relatively fast processes by which people move into and out of psychopathological states. In addition, for the disorders that show the strongest relations between psychopathology and personality (e.g. consider the relation between neuroticism and depression or anxiety disorders), it appears that the time scales at which the relevant processes operate are in fact different. We discuss the feedback mechanisms of the slow process (i.e. personality) on the fast process (i.e. psychopathology) and vice versa.
Effects of Personality (Slow Network) on Psychopathology (Fast Network)
A central idea in network approaches to psychopathology is that certain network structures make it easier for activation to ‘spread through’ the network. For instance, it has been shown that very strong interactions between symptoms can lead to a situation in which the symptoms sustain each other—a state of consistent symptom activation that we phenomenologically recognize as a mental disorder (Cramer et al., 2016). This directly suggests a way to integrate personality and psychopathology, namely, we can set up a model in which personality traits and their architecture (i) shape the person's psychopathology network parameters and, in doing so, indirectly control a person's resilience to external shocks, and (ii) influence the probability of such shocks as emanating from the external field, by predisposing the person to seek out or get caught up in situations that harbour more potential for shocks (Figure 1).
Psychopathology networks are governed by three sets of parameters, each of which may stand under the influence of the personality network. First, symptoms in the psychopathology network have a specific probability of activation, independent of the influence of other symptoms in a network. This probability is represented by their threshold parameters. Second, symptoms are influenced by other symptoms, as represented by their edge weight parameters, which indicate how sensitive symptoms are to activation by their neighbours. Third, symptoms can be activated through events in the external field (the total set of factors outside of the network that impinge on it). Personality factors may affect each of these parameters in characteristic ways.
Thresholds
If one peruses personality questionnaires and diagnostic systems, the relation between personality items and psychopathology symptoms immediately stands out. In their meta–analysis, Steel, Schmidt, and Shultz (2008) examined 2142 correlation coefficients to study the relationship between subjective well–being and personality. They found strong relationships for many items, over different facets of various personality questionnaires. In fact, this is exactly the feature that generates doubt on whether personality items and psychopathology symptoms measure truly distinct entities. For example, Mõttus (2016) has already argued for a more rigorous examination of the specific causal relationship between overlapping personality traits and psychopathology symptoms, suggesting a holistic and interdependent relationship. This strong relationship between personality items and psychopathology symptoms informs the hypothesis that personality predisposes a person to experience ‘subthreshold'symptomatology (e.g. Ormel et al., 2013; Campbell–Sills, Cohan, & Stein, 2006). In line with Scheffer et al. (2018)—who propose that nodes in a network can be understood as having their own resilience contributing to the resilience of the network as a whole—personality items could be said to measure properties that affect the threshold parameters of mental health symptoms. This is evident from studying items with content overlap. Taking neuroticism as an example, the items I get stressed out easily and I get upset easily [International Personality Item Pool (IPIP); Goldberg et al., 2006] may actually assess how easily the GAD symptom Restlessness or feeling keyed up or on edge, more days than not for at least 6 months (DSM–5; American Psychiatric Association, 2013) will present itself in a person. Therefore, one can hypothesize that a person's score on those two neuroticism items shapes the threshold parameters of the ‘restlessness’ symptom node in a psychopathology network. In the same way, a person's score on the neuroticism item I get irritated easily (IPIP; Goldberg et al., 2006) asks how easily the GAD symptom Irritability, more days than not for at least 6 months gets activated (DSM–5; American Psychiatric Association, 2013). Therefore, in a GAD network, this neuroticism item could be said to shape the threshold value for the ‘irritability’ symptom node. Consequently, we propose that personality items affect the resilience of specific nodes, with which they share content overlap, by shaping their threshold values in a psychopathology network. Following this line of reasoning, content overlap is thus no longer a validity threat, but instead an asset that can be exploited to inform models better.
Connections
A second way in which the slowly evolving personality factors can affect resilience is by altering the connectivity of the symptom network (Cramer et al., 2012). For instance, while it may simply be a feature of the human system that insomnia causes fatigue, the strength of this relationship plausibly may depend on a host of factors, which include those in the realm of personality (Blanken et al., 2019). Similarly, while feelings of worthlessness may cause suicidal ideation for many individuals (Williams, Crane, Barnhofer, Van der Does, & Segal, 2006), the degree to which one is prepared to engage in suicidal ideation plausibly depends on one's personality constitution.
In a previous work on network approaches to personality (Cramer et al., 2012), connectivity of the symptom network was in fact suggested to be the way in which neuroticism could be operationalized in a network model for MDD. Although this intuitively sits well with the idea that neuroticism has to do with the reactivity of the system (e.g. in the form of psychological reactions to stress; Kendler et al., 2004), the actual content of current operationalizations of neuroticism in personality questionnaires primarily formulates very general tendencies for feelings of worthlessness, anxiety, or depressed mood. We suggest that current operationalizations of neuroticism may therefore better be considered to assess threshold parameters of feelings of worthlessness, anxiety, or depressed mood, as they appear to concern not only reactivity to other symptoms but also reactivity to the external field.
With respect to the relation between thresholds and connectivity, it should be noted that these properties are in part communicating vessels: if one's symptom thresholds change, this has direct implications for the effective connectivity within the symptom network, as a more resilient symptom will ceteris paribus require more activation and thus stronger connections in order to be activated. Similarly, if one has two symptom networks with equal positive connectivity parameters in, for example, an Ising model (Marsman et al., 2018), then these need not be equally resilient; if the thresholds are different, then the network with higher thresholds will be less resilient. It should be noted that current tests for differences in symptom connectivity (Van Borkulo et al., 2015) do not account for differences in thresholds and thus should not be mistaken for tests of resilience. How to separate these effects from each other is an important question for future methodological research.
The External Field
Personality involves a general tendency to engage in certain types of interactions (Magnus, Diener, Fujita, & Pavot, 1993; Ozer & Benet–Martinez, 2006; Soto, 2019). For instance, extraverts are in part defined as people who seek out social situations (Ashton, Lee, & Paunonen, 2002), and conscientious individuals are more often found in more demanding job situations (Ng, Ang, & Chan, 2008). As the probability of events that may impinge on the symptom network is not likely to be equally distributed over these situations, it follows that personality may also influence the likelihood of relevant events in the external field. For example, as extraverts are more likely to settle in jobs that involve social interaction, any systematic effect of social interaction on psychopathology symptoms would be amplified for them. To the extent that personality factors are subject to genetic influences, this mechanism may in part explain the fact that environmental features (possibly including adverse life events) appear to be associated with genetic factors (Kendler & Baker, 2007; Krapohl et al., 2017).
Effects of Psychopathology (Fast Network) on Personality (Slow Network)
As the slow process of the personality network unfolds, certain states of the psychopathology network can become more likely. Importantly, however, these states can also feed back into the slow process. This may either increase the vulnerability of the psychopathology network or increase its resilience. These two categories of effects are referred to as scarring (Monroe & Harkness, 2005; Ormel et al., 2013) and steeling (Rutter, 2012a; Rutter, 2012b).
Scarring
It is possible that experiencing a mental disorder induces changes in the slow personality network, which alter that network in such a way as to reduce the resilience of the person to adverse events. This feature is known in the psychopathology literature as a kindling effect (Kessler & Wang, 2009). For instance, in the literature on depression, such effects have been repeatedly suggested (Hammen, Mayol, DeMayo, & Marks, 1986; Monroe, Rohde, Seeley, & Lewinsohn, 1999). In these accounts, the amount of stress or adverse life events necessary to trigger the onset of the first MDE is hypothesized to be higher than the amount of stress that triggers its recurrence (Monroe & Harkness, 2005). In other words, once a person has suffered from an MDE, he or she is more likely to have recurrent MDEs, even to the point that an MDE may develop in the absence of any triggering events (Monroe, Anderson, & Harkness, 2019).
This effect implies that the way the depression network reacts to stressors has changed once it has been in a depressed state. From our perspective, this suggests the hypothesis that the fast process (the MDD symptoms) feeds back into the slow process (the personality traits). That is, once a person has suffered from an MDE, this experience can in itself change the personality elements of the system (which then, in turn, lowers the resilience of the depression network). For example, the experience of an MDE may fuel the idea that one has failed in life, thereby increasing the tendency to experience feelings of worthlessness—a personality variable in the slow network. However, the effect might also be moderated via the external field: once the network is pulled into a disorder state because of a life event, it might react differently to future (minor) stressors because it has now shifted towards a different attractor basin. In other words, its equilibrium state is now changed to a disorder state, making it easier (i.e. less activation from the external field is necessary) for the MDE to recur.
Steeling
Another example of how the interaction between the different fields in our model might explain real–world phenomena from clinical practice is the steeling effect (Rutter, 2012b). The steeling effect entails the idea that resilience is built up through successful responses of the system to adverse events, which in themselves strengthen the resilience of the system. Thus, the steeling effect is the mirror image of the scarring effect.
Steeling effects are often observed in biological systems. The classic example is the human body building up resistance to viruses if injected by a small dosage of pathogens. Just like resistance to infections is induced by administering a small and modified dose of the pathogen in the body, thereby strengthening the immune system, resilience of mental health may arise from an increasing ability to cope with adverse life events after successfully having went through other adversities in the past (Rutter, 2012b). One way in which this may happen occurs when the experience of an episode of a mental disorder leads people to inquire new insights about themselves (e.g. through psychotherapy) that may allow them to increase their skills in dealing with adverse life events. Another example involves people who have experienced episodes of psychosis or depression and have learned to increase their resilience by setting up (social) early warning systems that may alert themselves and their environment to impending escalations of the system (Elder, 1974; Luthar, Cicchetti, & Becker, 2000; Troy & Mauss, 2011). Finally, a recent study found that an early career setback (viz., falling just below the threshold for receiving a research grant) actually had a positive impact on the future career of junior researchers (Wang, Jones, & Wang, 2019). Thus, the steeling effect entails that successfully surpassing adversity (meaning that there might be some temporary psychopathology symptom activation, but no development of a full–blown mental disorder) increases resilience.
In our model, this is represented as follows: when the psychopathology network structure is resilient, the fast process changes the variables in the slow process (personality network), which share content overlap, so as to increase resilience. In the next section, we apply the theoretical PRP model to neuroticism and MDD, showing how the scarring and steeling effects can be simulated.
Application: The Relationship between Neuroticism and Mdd
To illustrate the proposed framework, we apply the PRP model to the relationship between neuroticism and MDD. Figure 2 shows the applied model: the centre network represents the slow process of personality, and the network at the border represents the fast process of MDD. We propose that the slow process of neuroticism influences the development of MDD by altering the depression symptom network structure. We hypothesize that certain neuroticism items assess properties that affect the thresholds of depression symptoms; in particular, this occurs when a neuroticism item asks about a general tendency to display the states that define the corresponding MDD symptom. We refer to these neuroticism items showing content overlap with certain MDD symptoms as ‘overlapping items’.
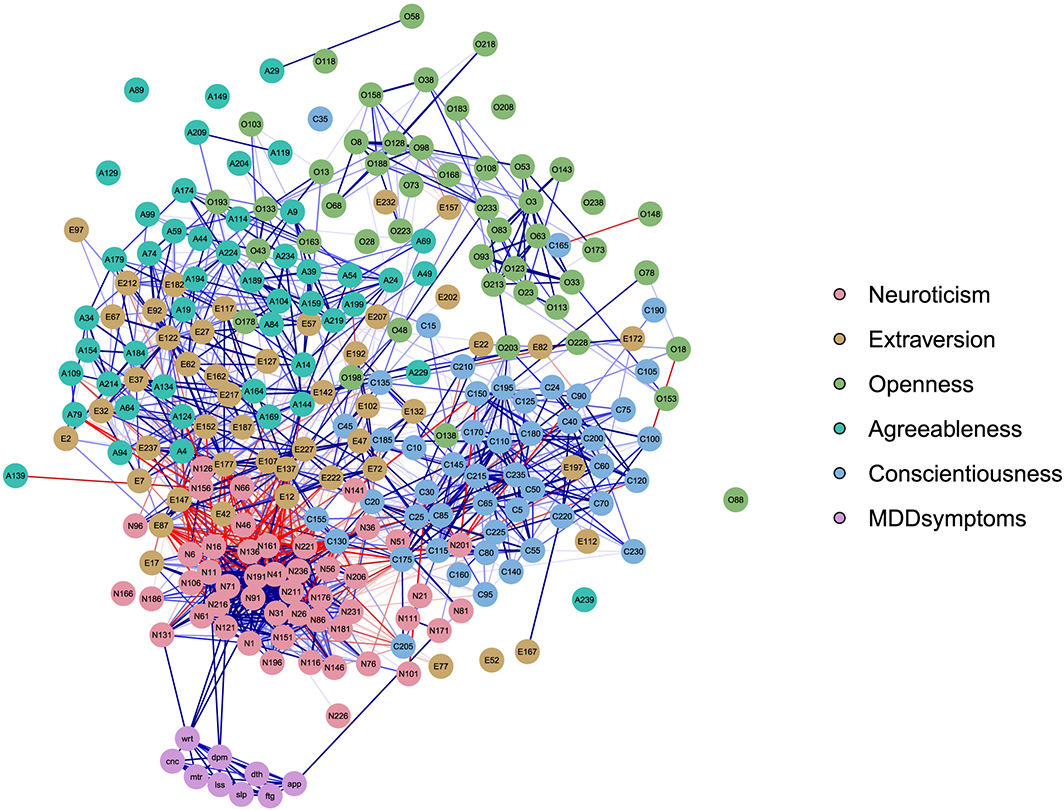
The applied personality–resilience–psychopathology model, with an example of the relationship between major depressive disorder (MDD) and neuroticism. The centre network represents the slow process (the personality elements) and the network at the border represents the fast process (the depression symptoms). The MDD symptoms are depressed mood, loss of interest, appetite disturbance, sleep disturbance, psychomotor agitation, fatigue, feelings of worthlessness, concentration problems, and thoughts of death. The MDD symptoms and neuroticism items that share content overlap are connected in the figure. In this way, one can imagine various mental disorder symptoms interacting with various personality factors.
The exact nature of the relationship between MDD and neuroticism remains an open question, which could have multiple answers. For example, one could say that there is a causal relationship, or a constitutive relationship. However, in order to provide concrete steps for the simulations, this relationship between the MDD symptom thresholds and neuroticism items needs to be specified. We propose that there is a supervenience relationship between the overlapping neuroticism items and the MDD threshold values. Supervenience is defined as follows: ‘A property X can be said to supervene on lower order properties Y if there cannot be X–differences without Y–differences. Thus, the presence of Y–differences is a necessary (but insufficient) condition for the presence of X–differences’ (Kievit et al., 2011, p. 70). This allows for multiple realizability, for example, where different item scores might lead to the same sum score: there cannot be a change from the sum score of 8 to a sum score of 9 without there also being changes in the item scores, but a sum score of 8 can be the result of the item scores of 4 and 4, 3 and 5, 2 and 6, and so on.
In our model, the MDD symptom thresholds supervene on the lower order personality items: differences in neuroticism item scores are a necessary but insufficient condition for differences in MDD threshold values. There cannot be differences in the threshold values without there also being a difference in the item scores, but there can be differences in the neuroticism item scores without altering the threshold values, because the changes in the neuroticism item scores can cancel each other out.
Phenomena to be Accommodated
We identify three important phenomena regarding the relationship between MDD and neuroticism that are well established in the literature and show how the applied PRP network model accounts for them in a simulation: (i) the strong correlation between MDD and neuroticism in the general population, (ii) the fact that this correlation remains relatively strong for the rest scores, and (iii) individual differences in the effect of SLEs on depression and neuroticism.
Strong Correlation between Mdd and Neuroticism
A widespread finding in the literature regarding the relationship between MDD and neuroticism is their strong correlation in the general population: Jylhä and Isometsä (2006) report a correlation of r = .71 (N = 441) between neuroticism and depression symptoms, and Fanous et al. (2002) report a correlation of r = .68 for men and r = .48 for women (N = 3771). Thus, our model should show a similar result. Because the model iterates over time, in which the fast and slow processes influence each other and are therefore updated with every iteration, we expect that the correlation between MDD and neuroticism increases with every iteration.
Robustness against Removal of Overlapping Items
It is a well–known phenomenon from the literature that the strong correlation between neuroticism and MDD and GAD holds after removing the neuroticism items that have content overlap with the psychopathology symptoms (Walton, Pantoja, & McDermut, 2018; Brandes et al., in press). From a latent variable model perspective, this can be explained by stating that the overlapping items and symptoms are only indicators of the underlying, correlating factors neuroticism and MDD or GAD. This phenomenon of the robustness of the rest score correlation is therefore used as an argument in favour of the latent variable approach, stating that the correlation between the neuroticism items and MDD or GAD cannot merely be a product of tautologies (Walton et al., 2018; Brandes et al., in press).
However, our model could provide an alternative explanation for the phenomenon of the robustness of the correlation between neuroticism and MDD after removing the overlapping items. In the current simulation setup, the sole point of contact between the neuroticism network and the MDD network lies in the three symptoms whose threshold is altered slightly as a function of the seven corresponding personality items. If the true data–generating mechanism is similar to the PRP model, then the correlation between non–overlapping neuroticism scores and non–overlapping depression symptoms will arise as a matter of necessity. The reason is that even though only a subset of the neuroticism items is connected to the MDD symptoms, individual differences in these items are nevertheless positively correlated with non–overlapping neuroticism items. For example, thoughts of death and loss of interest could be present due to direct activation by depressed mood and feelings of worthlessness, which could have been activated by the corresponding neuroticism aspects. Therefore, the non–overlapping neuroticism items will be correlated to the MDD symptoms. At the same time, non–overlapping MDD symptoms will ‘inherit’ the effects of neuroticism on the overlapping symptoms. Through this mechanism, non–overlapping MDD symptoms will get correlated to neuroticism. As a result, all MDD symptoms are correlated to all neuroticism items in the end. This means that because the data were generated with all variables, the non–overlapping variables were affected by and/or affected the overlapping variables, thereby causing the non–overlapping MDD and neuroticism variables to get correlated.
In order to test if the robustness of the rest score correlations between neuroticism and MDD arises from the simulations of our PRP model and to test if this is due to our proposed data–generating mechanism, the simulations should show two results:
If the overlapping neuroticism items and symptoms are removed from the data–generating mechanism, meaning that there is no point of contact between the neuroticism network and the MDD network, the correlation between neuroticism and MDD should approach zero. This can be tested by setting the scaling factor between the overlapping items and MDD symptom thresholds to zero and calculating the correlation between MDD and neuroticism after one iteration of the simulation. If the overlapping neuroticism items and symptoms are present in the data–generating mechanism, but removed from the rest score correlation calculations (as is done in studies such as Walton et al., 2018), the correlation between the MDD symptoms and neuroticism items should be robust against the removal of the overlapping item–symptom variables in the simulated data. This can be done by simulating the data according to the proposed PRP model and then calculating the rest score correlations between the MDD symptom sum score and the neuroticism item scores, without the overlapping items.
Individual Differences in the Effect of Stressful Life Events on Depression and Neuroticism
Individuals’ levels of neuroticism change over time (Costa et al., 1986; Steunenberg, Twisk, Beekman, Deeg, & Kerkhof, 2005), and this change seems to be driven by SLEs. After suffering from SLEs, levels of neuroticism are likely to increase (Riese et al., 2014), which, in turn, increase the probability of developing depression (Saklofske et al., 1995). People who have been diagnosed with an MDD once are not only more likely to suffer from another depressive episode again, but have also been found to have an increased level of neuroticism (Bolger & Zuckerman, 1995). On the other hand, individuals that show resilient coping mechanisms are less depressed after being exposed to significant trauma, despite controlling for levels of neuroticism (Sinclair, Wallston, & Strachan, 2016). Also, Roberts et al. (2017) found in their meta–analysis of 207 studies that emotional stability (which entails a low score on neuroticism) was the primary trait domain showing positive changes after psychotherapeutic interventions. Our model accommodates for these individual differences (Monroe et al., 2019; Monroe & Harkness, 2005) by proposing that an individual's resilience against developing MDD affects their level of symptomatology and neuroticism, via either scarring or steeling effects. Note that resilience is not conceptualized as a static trait, but as a global characteristic that supervenes on the MDD network structure. In other words, resilience is not a node in an individual's network, but a characteristic of the network structure itself.
Simulation
In this simulation, we connect an empirically estimated MDD network with an empirically (independent) estimated neuroticism network. All the simulations are executed in r (R Core Team, 2013).
To translate the above ideas into a formalized computational model, we need to choose a model structure to inform the dynamics and interaction between neuroticism and MDD symptomatology. Ideally, such models would be based on data gathered and analysed in a longitudinal prospective study that both contained sufficient repeated personality assessments to estimate the parameters of the slow process and tracked MDD symptomatology using intensive time series data as people moved in and out of MDEs. To the best of our knowledge, neither such data nor statistical models to analyse them with respect to the interaction between fast and slow processes currently exist in the context of (noisy) psychological data. Therefore, we have chosen to use two models that have been proposed to capture some of the structure (and, in the case of MDD, also some of the dynamics) of personality and MDD: we use the MDD simulation model proposed by Cramer et al. (2016) and connect it to the personality network proposed by Cramer et al. (2012). Importantly, the current modelling study aims to establish that the proposed theory can explain important phenomena in the relation between MDD and neuroticism; it is not intended as a fully realistic model of this interaction and should not be interpreted as such. Thus, the simulations have the limited but nevertheless important aim of establishing a proof of possibility.
Data
For the neuroticism network, we use the ‘big5’ data set as inventory as incorporated in the r package qgraph (Epskamp, Cramer, Waldorp, Schmittmann, & Borsboom, 2012). The data set contains the measurements of a Dutch translation of the NEO PI–R (Costa & Mac Crae, 1992) on 500 first year psychology students (Dolan, Oort, Stoel, & Wicherts, 2009). There are 48 neuroticism items, which will all be used in our simulation. For the MDD network, we use the Virginia Adult Twin Study of Psychiatric and Substance Use Disorders data set (Kendler, Karkowski, & Prescott, 1999). The participants are 8973 twins from the Mid–Atlantic Twin Registry. The MDD symptoms are measured during a psychiatric interview using an adaptation of the Structured Clinical Interview for DSM–III–R (Spitzer, Williams, Gibbon, & First, 1992), where each participant was asked if they had experienced any of the 14 disaggregated DSM–III–R symptoms. The data set contains binary data on the presence/absence of nine aggregated symptoms of MDD (criterion A for MDD in DSM–III–R; American Psychiatric Association, 1987). The symptoms are aggregated following recommendations as made in Aggen, Neale, and Kendler (2005) and following the criteria in the DSM. Table 1 shows the relation between the (dis)aggregated symptoms and the DSM criteria for MDD.
Aggregated/disaggregated criteria for major depressive disorder and the DSM symptomatology
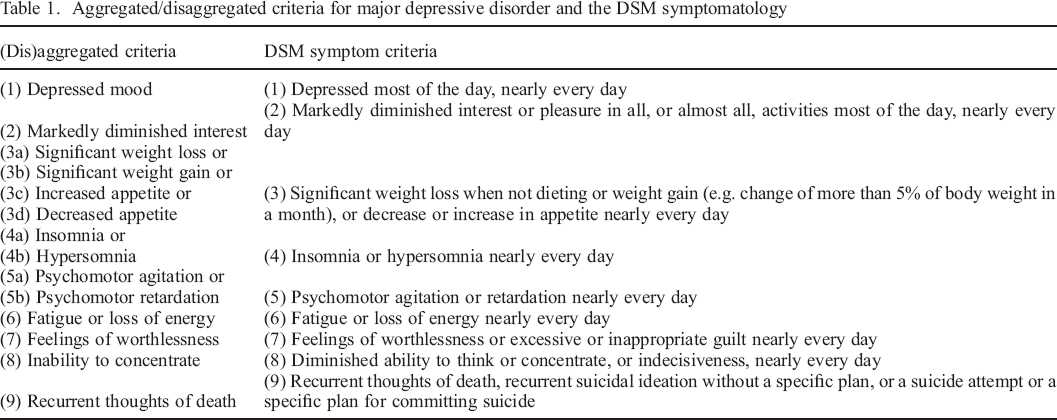
Table 2 shows the hypothesized relationships for these two sets of variables, based on the content of the items. This means that we hypothesize that there are seven NEO PI–R items that have content overlap with three MDD symptoms.
Hypothesized relationships for the personality–resilience–psychopathology network model applied to neuroticism and major depressive disorder (MDD)
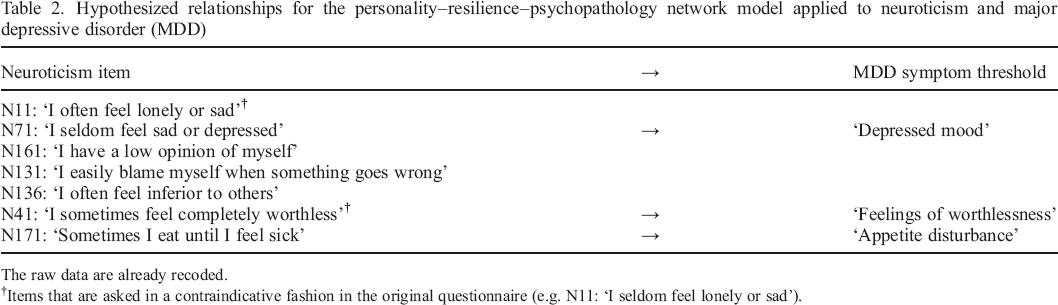
The raw data are already recoded.
Items that are asked in a contraindicative fashion in the original questionnaire (e.g. N11: ‘I seldom feel lonely or sad’).
For illustrative purposes, Figure 3 shows the applied PRP model with a subset of the 48 neuroticism items, in order to show how the overlapping MDD symptoms and neuroticism items are connected to each other in the simulation.
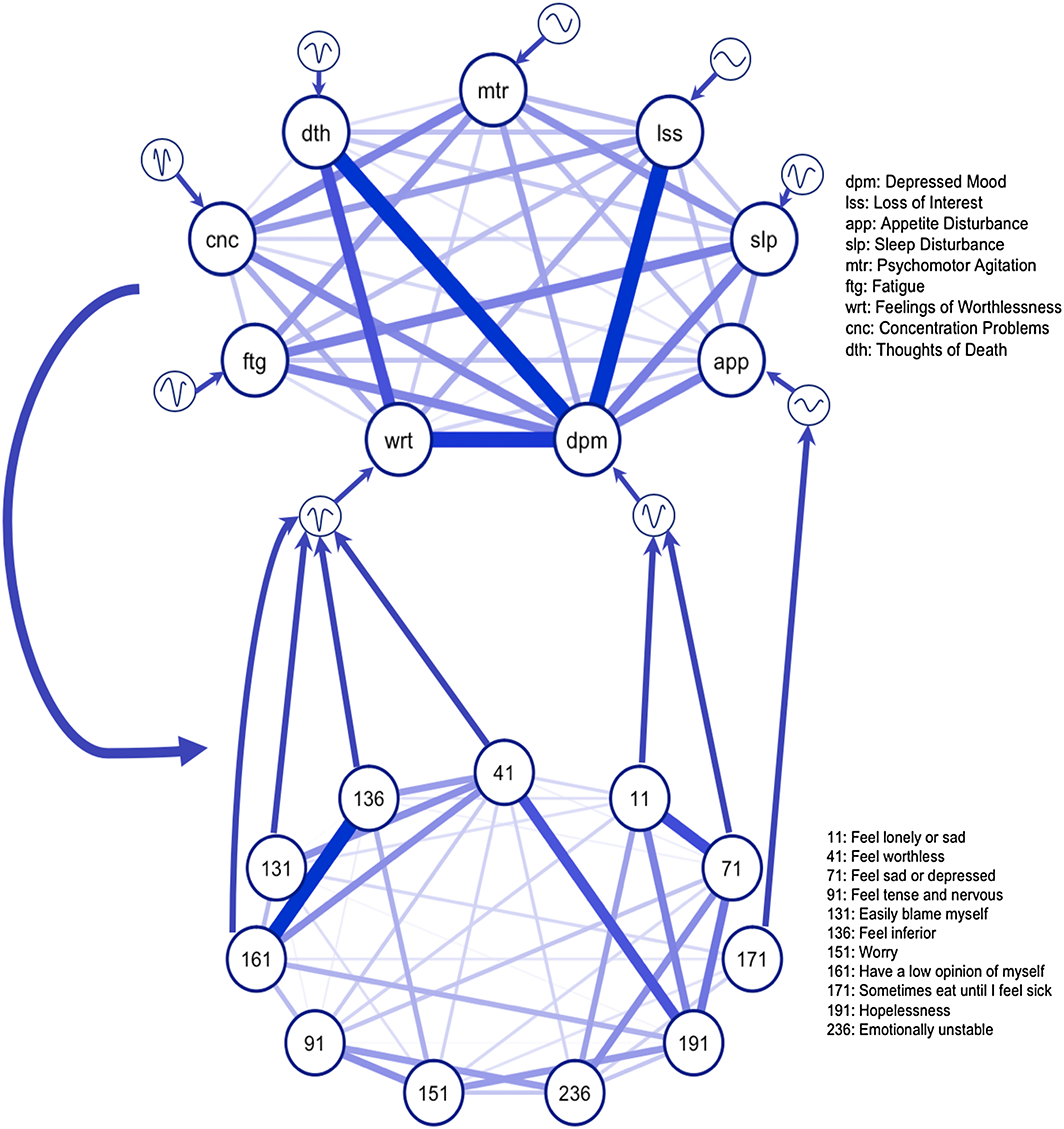
Relations between NEO PI–R neuroticism items (Costa & Mc Crae, 1992) and thresholds of major depressive disorder (MDD) symptomatology as based on the correspondence between the content of the items. The upper network represents an MDD network, and the lower network represents a neuroticism network. For illustrative purposes, only a small subset of the 48 neuroticism items are represented here, including the seven neuroticism items that are hypothesized to alter several MDD threshold values. A neuroticism item is connected to the threshold of an MDD symptom if the item formulates a general disposition to experience a phenomenon identified by a symptom. For instance, the disposition assessed through the item ‘Sometimes I feel completely worthless’ is taken to influence the threshold of the DSM–5 symptom ‘Feelings of worthlessness or excessive or inappropriate guilt, nearly every day for at least two weeks’. [Colour figure can be viewed at wileyonlinelibrary.com]
The Ising model (van Borkulo et al., 2014) was used as a prototype model for the organization and dynamics of an MDD symptom network, which represents the fast process. The Ising model is a straightforward model for binary (i.e. absent or present) symptoms that implements symmetric pairwise interactions. Although the Ising model is a toy model rather than a fully realistic model of symptom interactions, it is helpful as a simplest non–trivial case: its behaviour is sufficiently simple to be mathematically tractable and, at the same time, sufficiently rich to represent important phenomena in the aetiology of mental disorders, such as alternative stable states, critical transitions, and hysteresis (Cramer et al., 2016; Marsman et al., 2018; Van Borkulo et al., 2014). The Ising model is characterized by two parameters: a threshold parameter for each node (e.g. MDD symptom) in the network and a connectivity parameter for each edge (e.g. the connection between two symptoms). The threshold of a node represents the autonomous disposition of the node to be present and, thus, reflects the probability of being present in the absence of any influences of connected nodes. The connectivity parameter for each edge represents the strength of two nodes influencing each other. The parameters of the Ising model can be estimated with node–wise logistic regression, in which the intercept is an estimate of the threshold and the slope is an estimate of the edge strength. In addition, the model evolves in an external field (i.e. any factor outside the model, such as stressful events) that influences the node states.
The neuroticism network is estimated with a Gaussian graphical model using LASSO regularization (Epskamp, Waldorp, Mõttus, & Borsboom, 2018) and represents the slow process. The Gaussian graphical model handles continuous data, which is suitable for the 5–point Likert scale items of the NEO PI–R data set. LASSO regularization limits spurious edges, meaning that the estimated model is less likely to contain false positive connections (Epskamp & Fried, 2018).
Now there are two empirically estimated networks representing neuroticism and MDD. These are cross–sectional networks, meaning they are estimated from the differences between individuals. However, we assume that the estimated networks can be used as a blueprint for all individuals. To make sure we have enough power for our simulations, we use the estimated network parameters to simulate 1000 participants using the ggmGenerator function from the ‘bootnet’ r software package (Epskamp, Borsboom, & Fried, 2017). To make explicit that we are analysing data of simulated individuals, we will refer to these simulated individuals as ‘sims’. With these neuroticism scores, our simulation study begins.
Sims differ in the starting point of the simulation. That is, they differ on their neuroticism item scores, which are generated according to the empirically estimated network structure. For each sim, the networks communicate as shown in Figure 3. The sim's overlapping neuroticism score is thus connected to the MDD network parameters. This works as follows. For every iteration, both the neuroticism and MDD networks influence each other: every sim's neuroticism item scores will affect their MDD network structure (by altering the relevant MDD symptom thresholds), which results in an altered level of resilience. Every sim's own resilience against developing MDD then affects their neuroticism item scores at the next iteration of the model. Thus, even though this application of the PRP network model is derived from cross–sectional data, we simulate individual–level dynamics in order to generate hypotheses regarding personalized trajectories over time. Next, we describe the simulation process in more detail.
Simulating the Fast Process
From the PRP model, it follows that neuroticism items that have content overlap with depression symptoms should influence the threshold values of the respective symptoms. This is modelled as follows: (i) all neuroticism item scores are standardized for all sims, (ii) standardized item scores of the neuroticism traits that we hypothesize to alter a certain MDD symptom (Table 2) are summed, (iii) multiplied by a scaling factor that represents the influence of neuroticism on MDD (in our case, we use a scaling factor of 0.1), and (iv) added to the MDD threshold of the focal MDD symptom. For example, to compute the novel threshold value of the sims's MDD node ‘feelings of worthlessness’ on each iteration, the standardized scores on the neuroticism items ‘N41: I sometimes feel completely worthless’, ‘N131: I easily blame myself when something goes wrong’, ‘N136: I often feel inferior to others’, and ‘N161: I have a low opinion of myself’ are summed, multiplied with a scaling factor (in our case .1), and added to the participant's original MDD symptom ‘worthlessness’ threshold value. This is repeated for every MDD symptom that is expected to be influenced by neuroticism items. Then, the MDD network parameters are updated for every individual, based on their neuroticism item scores. This is done on every iteration; thus, the thresholds of the focal MDD symptoms are updated based on their value on the previous iteration. 1
As an example, we can calculate the novel threshold value of the ‘feelings of worthlessness’ (FoW) MDD symptom for simulated participant 104. Their standardized item scores on the overlapping neuroticism items are ‘N11’: −020, ‘N41’: −0.44, ‘N71’: −0.02, ‘N131’: −1.64, ‘N136’: −1.08, ‘N161’: 0.18, and ‘N171’: −0.54. To compute the novel threshold values of the overlapping MDD nodes, we sum the following: Threshold FoW sim104,iteration + 1 = Threshold FoW sim104,iteration + (‘N41’ + ‘N131’ + ‘N136’ + ‘N161’) × ScalingFactor. This results in Threshold FoW sim104,iteration + 1 = −4.44 + (−2.98) × 0.1 = −4.73. In a similar way, the novel threshold values for ‘depressed mood’ and ‘appetite disturbance’ for simulated participant 104 can be computed and updated.
Glauber dynamics (Glauber, 1963) are used to simulate time points from our PRP network, in order to study the influence of neuroticism on the depression network. This process operates as follows. For every time point, the algorithm selects one randomly chosen MDD node. This node can be active (encoded by a ‘1’) or inactive (encoded by a ‘0’). 2 Subsequently, the state of this node gets temporarily flipped, meaning that an active (inactive) node gets deactivated (activated). Then, the current and flipped state are compared with each other, and the likelihoods of the resulting system states are compared. On the basis of this evaluation, the most probable state for the relevant node is chosen for the next time point, based on the state of all other nodes, taking the network architecture into account. As a result, the most likely trajectory of the depression network can be simulated, mimicking a continuous process. Figure 4 shows an example of an individual's simulated dynamics using Glauber dynamics.
Following the suggestions as made in Haslbeck, Epskamp, Marsman, and Waldorp (2020), we use the transformed {0,1} parameters of the Ising model to compute the Glauber dynamics.
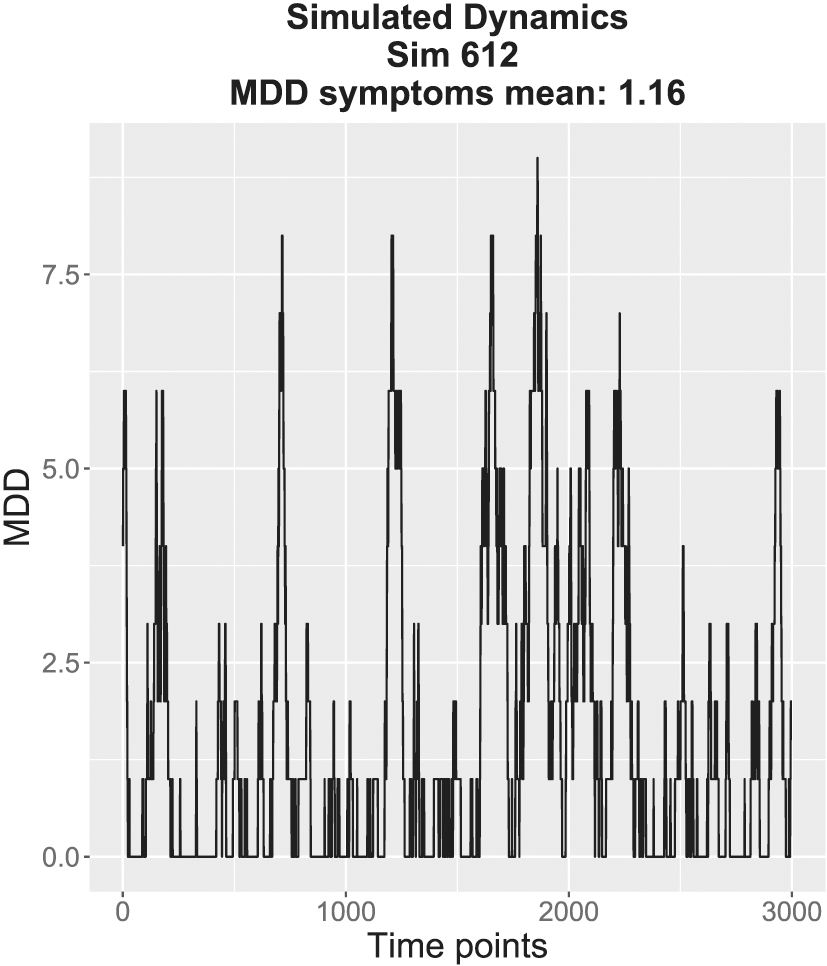
An example of the simulated dynamics of the fast process for one simulated participant (sim 612). The x axis shows the time points, and the y axis shows the sum score of the active major depressive disorder (MDD) symptoms. This participant shows a sum score of 0–2 active MDD symptoms most of the time, but there are also some peaks leading to more than 5 active symptoms. However, these peaks are episodic, and the participant does not get ‘stuck’ in the depressed state (i.e. this sim seems to recover).
By simulating the evolution of the system in this manner, we can study the dynamics that are implied by any given network structure. Of course, the veracity of these dynamics depends on the degree to which the Glauber dynamics approximate the actual process operative in the aetiology of MDD. Because this is unknown at the moment, this model should primarily be seen as a first approximation that allows us to model the process. However, as science progresses and more information about the relevant etiological processes becomes available, the current model can straightforwardly be adapted according to new scientific insights.
Simulating the Slow Process
For every iteration of the model, the sim's fast process affects their slow process. 3 If a person has a vulnerable MDD network structure and is therefore more likely to suffer from a depressive episode, this can have a scarring effect. We account for this in our simulation by slightly increasing certain neuroticism item scores (we increase the standardized overlapping scores with 0.3) in the next iteration of the model. This will, in turn, affect the thresholds of certain MDD symptoms (Table 2), making them more vulnerable and therefore more likely to suffer from a depressive episode. We follow the opposite procedure for a sim with a strongly resilient network structure. This sim is unlikely to suffer from an MDE despite facing adversity, and therefore, we lower the relevant neuroticism item scores on the next iteration of the model (we lower the standardized overlapping item scores with 0.3). This will implement the steeling effect, because this sim is more likely to also have a more resilient network structure because of the lower neuroticism level.
We want to note that in our simulation study, we model the influence of the fast process (MDD) on the slow process (neuroticism) but do not let neuroticism evolve over time. That is, in our simulation model, the effect of the depression symptoms on the overlapping neuroticism indicators does not spread through the neuroticism network.
Naturally, not every resilient individual will always show steeling effects, because steeling effects are more likely to occur within highly resilient individuals who successfully surpass adversity (Rutter, 2012b). Therefore, we also consider the individuals who show moderate resilience, which show no further change (Bonanno, 2004; Masten, 2001). In our simulation, sims with moderate resilience will show no scarring nor steeling effects in the next iteration of the simulation, meaning their neuroticism scores stay the same for the next iteration.
To assess the resilience of the MDD network structure, we again simulate Glauber dynamics but add an artificial ‘shock’ to the system by forcing all nodes to be active for one time point. This allows us to see how the system bounces back from these short but intense perturbations, representing an SLE. Then, dynamics with and without the perturbations are compared and the resilience of the system can be quantified. 4
This is quantified with a resilience indicator that measures the degree to which the system is susceptible to shocks. See the code of our simulations and Lunansky et al., in preparation, for the computations.
We can now iterate the whole model simulating both the fast and slow process at every iteration. The strength of the relationships between the fast and slow processes can be altered to study the effects of different levels of feedback between the slow and fast network processes. That is, we can alter how strongly the neuroticism items affect the MDD symptom threshold values and how strongly the resilience of the MDD network influences the neuroticism item scores at the next time point by altering the scaling factor. We have developed an interactive simulation tool for users to replicate our simulations with different values of the scaling factor, to study its impact on the influence of the slow and fast processes. This simulation tool can be found at https://gabylunansky.shinyapps.io/PRPmodel/.
Results
Strong Correlation between Mdd and Neuroticism
The first phenomenon that should follow from the applied model is the strong correlation between MDD and neuroticism. Figure 5 shows how the correlation between the MDD symptom sum scores and neuroticism item scores increases across the three iterations of the model with a scaling factor of 0.1: from r = .41, to r = 0.59 and r = 0.66. Importantly, this means that small influences of the processes on each other, which arise only from the contact points between the seven neuroticism and three MDD networks (Figure 3), are able to generate strong correlations between the total scores computed on these networks.
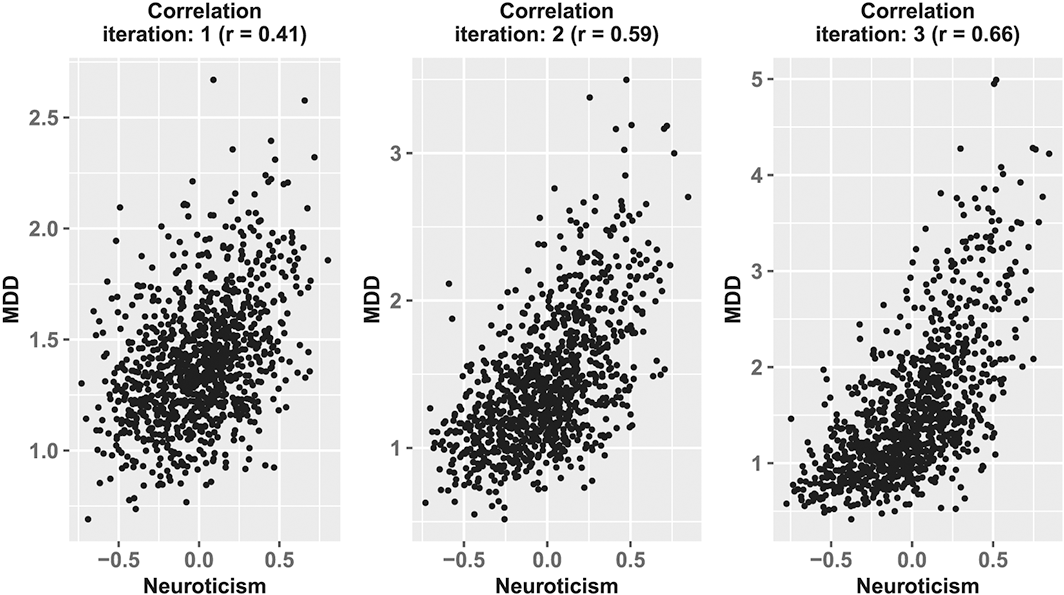
The increasing correlation between major depressive disorder (MDD) and neuroticism. On the x axis are the standardized neuroticism item scores, and on the y axis are the mean MDD symptom sum scores. The data are generated with a scaling factor of 0.1. As the personality–resilience–psychopathology model iterates, meaning that both the fast and slow processes influence each other, the correlation between neuroticism and MDD increases.
Robustness against Removal of Overlapping Items
Next, we investigated whether the proposed model can demonstrate the strong correlation between MDD and neuroticism, even after removing overlapping MDD symptoms and neuroticism items from both the data–generating mechanism and the computations of the rest score correlations from the simulated data.
First, to remove the overlapping MDD symptoms and neuroticism items from the data–generating mechanism, we implemented a simulation wherein both neuroticism and depression are scaled to have no effect on each other. In other words, all the arrows in Figure 3 from the neuroticism items to the MDD symptom thresholds and from the MDD network to the neuroticism item scores are set to zero (scaling factor = 0). Because, in this case, the dynamic processes on the networks are independent, there should be no relationship between MDD and neuroticism across all iterations of the simulation. As the scaling factor increases, however, the feedback between the networks should increase and the correlation between MDD and neuroticism should get stronger as a result. Figure 6 shows that this is the case: the correlation for the simulation with a scaling factor of 0 is r = .01, as expected, but when the scaling factor increases to.05 or.1, the correlation between MDD and neuroticism is respectively r = .21 and r = .41 for the first iteration (i.e. the first round in the simulation in which the neuroticism and MDD network affect each other).
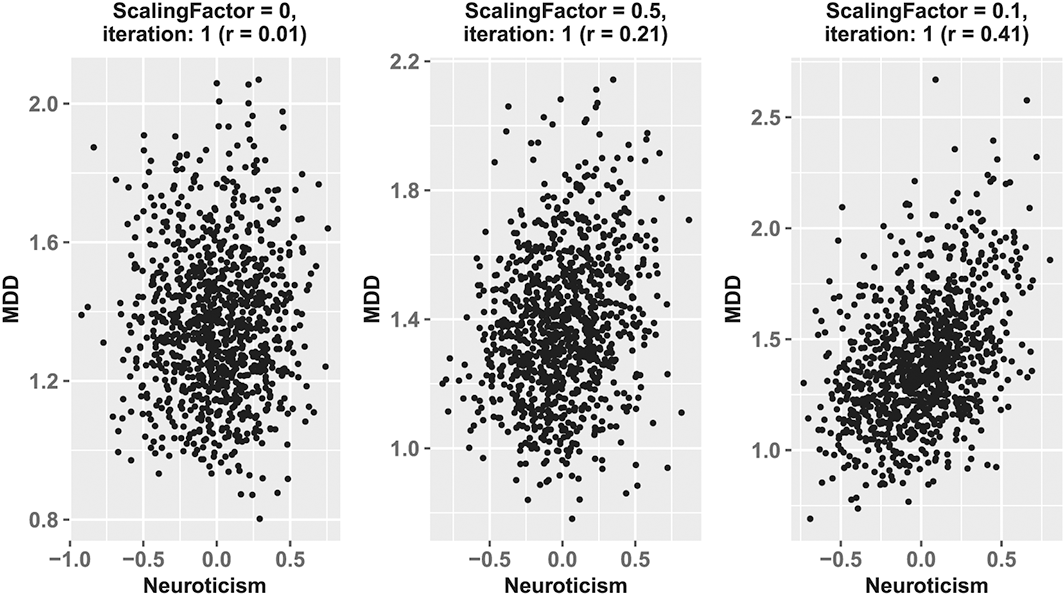
The rest score correlations: removal of the overlapping items from the data–generating model. On the x axis are the standardized neuroticism item scores, and on the y axis are the expected values of the major depressive disorder (MDD) symptoms. On the left panel, the scaling factor of the personality–resilience–psychopathology model is zero, meaning that there is no relation in the data–generating model between neuroticism and MDD. In the middle panel, this scaling factor is set to 0.5 and in the right panel to .1. The correlation increases with the scaling factors.
Second, to check the robustness of the rest score correlations after removing the overlapping items from the simulated data, we simulated data with the PRP model (i.e. including overlapping items) with scaling factor = 0.1 and simulated data for three iterations. This resulted in three data sets including overlapping items. Figure 7 shows what happens if we calculate the correlation between simulated neuroticism and MDD data after removing the overlapping items in the same way as has been done in the literature to test the effects of item overlap (Walton et al., 2018). Next, we computed the mean rest scores of MDD and neuroticism for each individual and correlated those scores. The rest score correlations over the three iterations are respectively r = 0.3, r = 0.41, and r = 0.43. As Figure 7 evidences, the resulting correlation between the rest scores after removal of overlapping items is only slightly weaker than the correlation between the total scale scores. Clearly, the correlation between neuroticism and MDD is robust against removal of overlapping items.
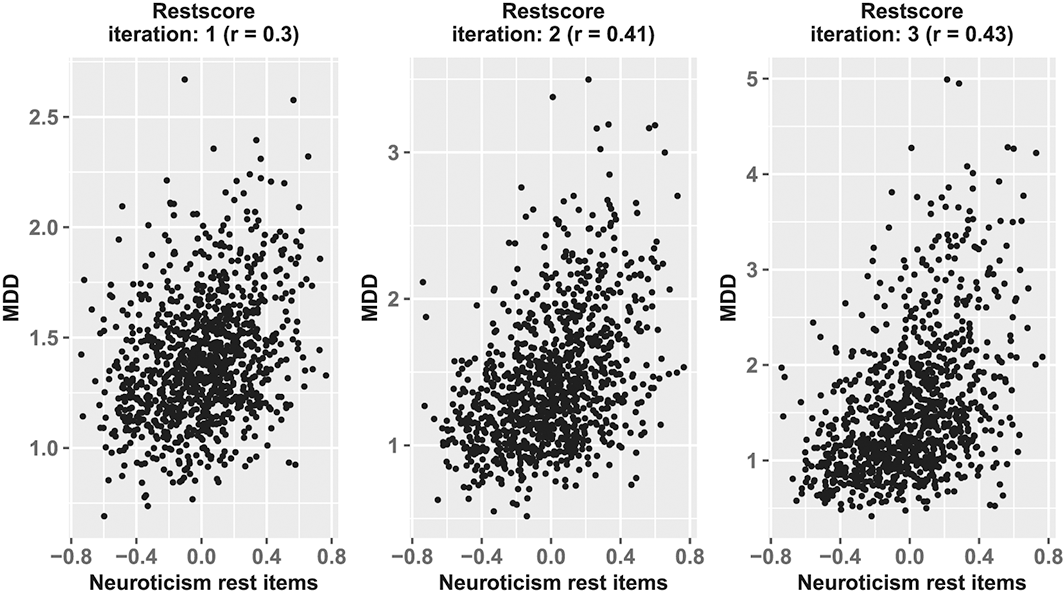
The rest score correlations: removal of the overlapping items from the rest score calculation. On the x axis are the standardized neuroticism item scores that have no overlap with the major depressive disorder (MDD) symptoms, and on the y axis are the mean MDD symptom sum scores. The data are generated with a scaling factor of 0.1. The correlation of the rest scores between neuroticism and MDD increases over the iterations of the personality–resilience–psychopathology model.
Individual Differences in the Effect of Stressful Life Events on Depression and Neuroticism
To facilitate the presentation of these results, we categorized simulated individuals into three groups: sims that always show the steeling effect (i.e. across all iterations of the model, their depression network is resilient and thus their neuroticism score lowers), sims that always show the scarring effect (i.e. across all the iterations of the model, their depression network is vulnerable and thus their neuroticism score increases), and sims that show a combination or neither of these effects (i.e. across all iterations, the depression networks are sometimes resilient and sometimes vulnerable; therefore, sometimes their neuroticism items might increase or decrease, but most of the time, their neuroticism item scores will remain the same).
Figure 8 shows individual trajectories of three randomly selected sims, each from a different group, to show scarring effects, steeling effects, or neither of these effects. For instance, sim 338, showing scarring effects, shows sudden jumps into a disorder state (where the sum score of activated symptoms is >5) and stays in that state for a relatively prolonged time. This dynamic increases over the iterations, because the vulnerable network structure leads to a higher neuroticism item score, which in turn negatively affects their MDD network structure. On the contrary, sim 418 shows steeling behaviour: there is spontaneous recovery after short peaks of an increased sum score of MDD symptoms, and as the model iterates, the participant shows no symptom activation for most of the time and less peaks. Lastly, sim 1 shows no clear scarring or steeling behaviour. This means that this sim sometimes shows moderate vulnerability when facing an SLE and, at other times, moderate resilience, without a clear pattern or changes in the level of neuroticism.
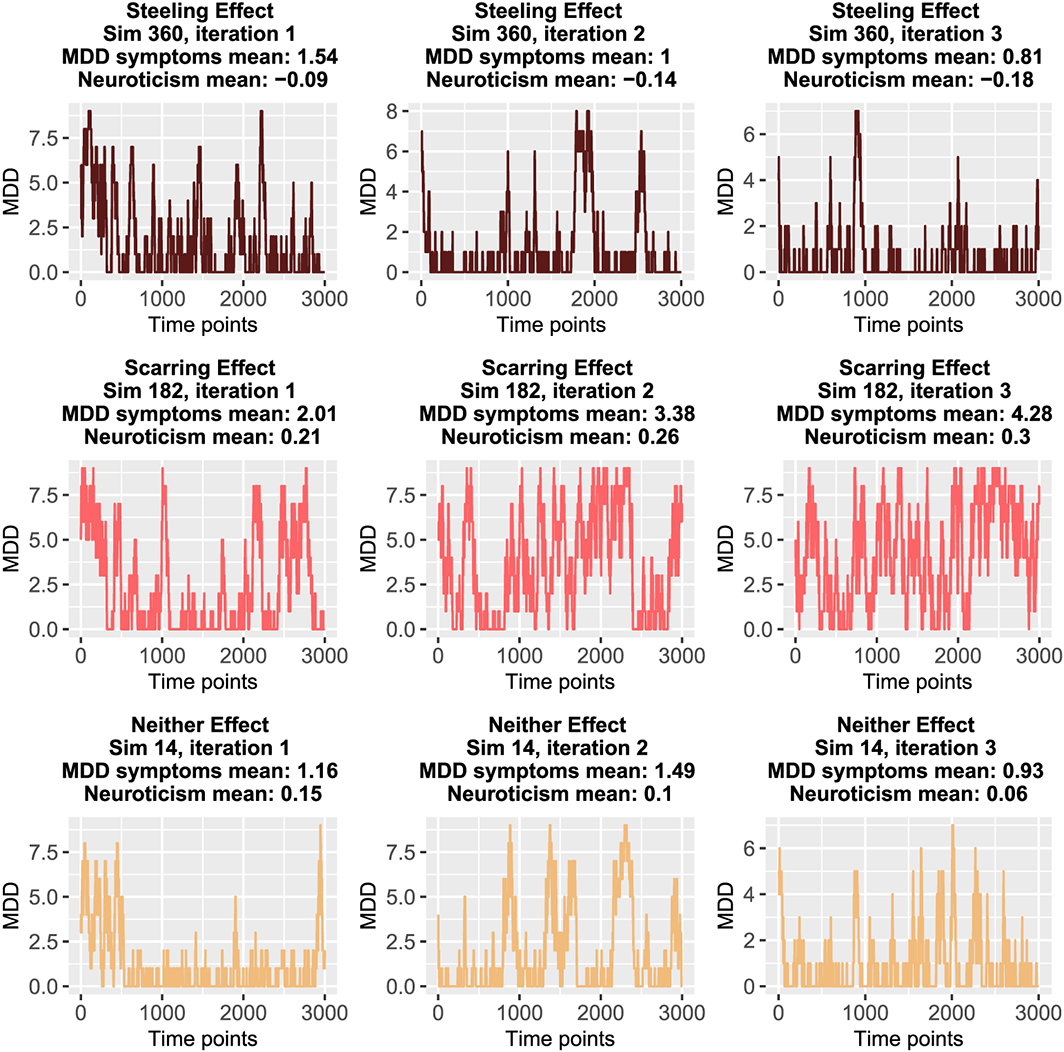
Individual trajectories. The dynamics over time of three randomly selected sims from each group (scarring, steeling, or neither effect) are plotted. The x axis represents time, while the y axis shows the sum score of the active major depressive disorder (MDD) symptoms. The upper row shows the dynamics of a sim from the steeling effect group, the middle row the dynamics of a sim from the scarring effect group, and the lower row the dynamics of a sim belonging to neither group. The expected values of MDD are calculated after 10.000 Glauber dynamics iterations; however, here, we only show 3000 time points in order to increase the visibility of the dynamics. [Colour figure can be viewed at wileyonlinelibrary.com]
Discussion
In this paper, we have proposed to model the relation between personality and psychopathology using interacting networks that operate on slow and fast time scales. At the level of the slow process, personality traits affect the threshold and connectivity parameters of the psychopathology symptom network, thereby affecting the resilience of mental health. At the level of the fast process, (alterations in) resilience of the psychopathology network can influence the slow process through scarring and steeling effects. This model is integrated, in the sense that it does not conceptualize personality and psychopathology as qualitatively and categorically distinct entities. In fact, in a non–trivial sense, the components of personality and psychopathology are the same: they both involve thoughts, affect states, and behaviours that influence each other. Items as characteristically worded in personality scales aim to pick up the average levels at which these components arise, while psychopathology symptoms tap distinct episodes of increases or decreases in these levels. Our model represents the way these processes interact, but should not be read as proposing an ontological distinction between the components themselves.
The implementation of a first–order approximation to this theoretical model in a simulation, which connects empirically informed MDD and neuroticism networks, shows that the model results in plausible empirical patterns and can accommodate (i) the strong correlation between MDD and neuroticism, (ii) the robustness of this correlation against removal of overlapping items, and (iii) individual differences in the effect of SLEs on depression and neuroticism. Thus, by taking a complexity perspective, we have been able to integrate personality and psychopathology into a single model with empirically plausible properties.
In the proposed model, the resilience of the psychopathology network influences the level of the traits in the personality network. In our simulation, we operationalize resilience by simulating the dynamics of the MDD network and comparing its equilibrium state with and without perturbations. The perturbations in this simulation are forcing all the nodes (symptoms) in the model to be active for one time point, which represents the situation of briefly being in a full–blown MDE after facing an SLE. In this way, we can study to what extent the system bounces back from these perturbations and compare the sum score of active symptoms for both situations with and without perturbations. Thus, in our simulation, we alter the state of the nodes, which reflect activating the symptoms. Another interesting possibility for studying the resilience of networks would be to use percolation analysis, such as is done by Kenett et al. (2018). Here, the network edges are systematically removed until the point that the system collapses. The application of percolation methods to study the resilience of networks is a current topic of active research (van Borkulo et al., 2016). However, in the present study, we are specifically interested in how altering threshold parameters relates to symptom activation. Therefore, we have chosen to alter the symptom states, instead of the network edges. Even though the optimal operationalization of studying the resilience of psychological networks is beyond the scope of this paper, we encourage future research to focus on this pressing issue.
The PRP framework is generic, meaning it does not only apply to specific disorders, personality traits, or environmental factors, but provides a general way to study those specific contexts systematically. One can imagine extending the model in Figure 2 with other mental disorder symptoms on the borders of the PRP model. The exact influence of the different components of the model on each other, such as the environment on the fast symptom network, might vary across different types of mental disorders, personality factors, and life events. For example, a particular (childhood) trauma might have such a substantial, direct impact on mental health that the influence of personality on mental health plays a relatively small role (Isvoranu et al., 2016). Also, some mental disorders, such as depression, are highly heterogeneous, so that the disorder manifests itself in different combinations of symptoms for different people (Fried, 2017). Additionally, different symptoms may have distinct roles in the network, such as stabilizing the disorder state or communicating between various disorders (Blanken et al., 2018). Therefore, the impact of altering the thresholds of one mental disorder symptom will vary depending on the symptomatology of the individual and the network architecture. In this way, distinct symptom patterns can emerge from the architecture of psychopathology networks, with subtle differences in this architecture resulting in possibly large differences in vulnerability to disorders (Borsboom, 2017; Borsboom & Cramer, 2013). Instead of only focusing on mental disorders, the proposed PRP framework also offers a novel and fruitful way for investigating the relationship between personality and positive mental health, such as the positive impact of conscientiousness and agreeableness (Strickhouser, Zell, & Krizan, 2017).
Although the simulation model built to implement the theoretical framework shows promising results, it is primarily intended to illustrate the operating principles of the PRP network. In many ways, the simulation model is a first approximation of the theory, and as such, it is subject to many limitations. For instance, the model is now solely informed by networks estimated on cross–sectional data, and although we suspect that such data will remain indispensable for assessing relations between symptoms, the simulation would ideally also be informed by longitudinal studies that chart the time dynamics of the system. How such data could be integrated into the model represents an important question for further research. Another interesting question for future research is how to specify the nature of the relationship between MDD and neuroticism. If one follows the reasoning in this paper, future researchers could focus on empirically validating the strong assumptions in our model regarding the supervenience relationship between personality and psychopathology.
Another limitation is that in the current setup, the model can infinitely update the MDD symptom thresholds and neuroticism item scores. Undoubtedly, this is not a plausible empirical scenario. Not only should the MDD symptom thresholds and neuroticism items be updated within a certain interval, but updating should also consider that levels of personality may change for reasons other than the factors described here (i.e. independently of the steeling and scarring processes) as individuals age (Roberts & Mrozeck, 2008; Walton & Viechtbauer, 2006). This also implies that the effect of psychopathology on personality, or vice versa, might be dependent on age. The PRP model may accommodate for this possibility by letting the scaling factors in the simulations be a function of time. Such work could also incorporate insights from studies investigating the underpinnings of slow changes in personality (Lodi–Smith & Roberts, 2007; Bleidorn, 2015; Bleidorn et al., 2013). Future research may thus focus on extending the PRP model in order to make it both more empirically plausible and suitable to represent differences between age groups.
The PRP network provides novel avenues for future research to explore therapeutic interventions for mental health. Because mental disorders are thought to emerge from direct symptom–symptom interactions (Borsboom & Cramer, 2013), it should, in theory, be possible to influence this development in an earlier stage, that is, before the network has spiralled into a stable disorder state. The PRP network suggests that the resilience of mental disorders can be affected by personality dispositions, which in themselves are elements in an interconnected network. These direct interactions lay out various possibilities for psychotherapy, for example, by intervening on the individual's tendency to worry frequently, thereby lowering the probability of developing the MDD symptom excessive worrying. Importantly, the PRP network offers a simple and transparent scenario for projecting the effects of such interventions in the slow process of personality on the psychopathology network.
The network perspective has successfully set out a novel research agenda that has led to many estimated network models from empirical data over a variety of psychological research fields (Robinaugh, Hoekstra, & Borsboom, 2020). The next question is how these estimated relationships between psychological variables arise, what causal processes they imply, and how they develop over time. Therefore, theoretical work is needed to develop formal models that can inform specific hypotheses and thinking tools for studying these research questions (e.g. van der Maas et al., 2006; Cramer et al., 2016). In addition, if mental disorders really arise from a web of interconnected, clustering symptoms that evolve in an external field of life events and other factors (Borsboom, 2017; Fried et al., 2015), more research and theoretical work is needed on how to connect different sources of information as they relate to different features of this network. The simulation work in this paper can be regarded as a first attempt to achieve this, by integrating two different research fields, namely, personality and psychopathology, into one dynamical model. In the past century, psychology has fruitfully isolated variables and studied them with standardized tests and methodologies, but now is the time to start connecting the dots again and to build a theoretical framework that can generate the bigger picture of how all the parts of the human system work together to generate an integrated whole (Cervone, 2005).
Declaration of Interest
None.
Acknowledgements
We would like to thank Han van der Maas and Maarten Marsman for their helpful feedback on the simulations in this paper and the editor and reviewers for their thoughtful comments on earlier versions of this paper. All authors are supported by ERC Consolidator Grant 647209, awarded to Denny Borsboom.
Supporting Information
Supporting Information, per2263 - Personality, Resilience, and Psychopathology: A Model for the Interaction between Slow and Fast Network Processes in the Context of Mental Health
Supporting info item
Supporting Information, per2263 for Personality, Resilience, and Psychopathology: A Model for the Interaction between Slow and Fast Network Processes in the Context of Mental Health by GABRIELA LUNANSKY, CLAUDIA VAN BORKULO and DENNY BORSBOOM, in European Journal of Personality
Supporting info item
Footnotes
Supporting Information
Additional supporting information may be found online in the Supporting Information section at the end of the article.