
Abstract
Cynical hostility (or cynicism) is often considered as a major factor leading to bad health outcomes. The present research proposes that poor health might represent both a consequence and a source of cynicism. Using cross–lagged path analyses, we documented bidirectional associations between health and cynicism in a nationally representative sample of Germans (Study 1) and a large sample of the American elderly (Study 2): cynical individuals were more likely to develop health problems, and poor health promoted the development of a cynical worldview over time. These results were obtained using different indicators of health status, including both self–reported and interviewer–administered physical measures. Longitudinal mediation analyses showed perceived constraints to mediate the effect of poor health on cynicism. This effect remained robust even when adding an alternative mediator—depressive symptoms. Additional analyses showed that any particular health limitation was prospectively related to cynicism to the degree to which this limitation was associated with an increased sense of constraints in individuals’ life. © 2018 The Authors. European Journal of Personality published by John Wiley & Sons Ltd on behalf of European Association of Personality Psychology
On 24 January 1536, Henry VIII was thrown from his horse during a jousting tournament. The accident made him lose consciousness for several hours and resulted in serious injuries and health problems that he has been plagued with for the rest of his life. Even more, according to historical records, the accident led to major changes in his character, turning a once progressive and open–minded king into a paranoid and suspicious tyrant, who believed everyone—including his court members and close ones—to be untrustworthy and mean spirited (McCarthy, 2009). Psychologists would tell that this accident made Henry VIII endorse a cynical worldview, a belief that, at their core, most people are self–interested, dishonest and untrustworthy (Cook & Medley, 1954; Stavrova & Ehlebracht, 2016; Wrightsman, 1992). Recent advances in personality research have shown that declines in health status might indeed lead to changes in dispositional characteristics, such as the Big Five personality traits (Jokela, Hakulinen, Singh–Manoux, & Kivimäki, 2014; Kornadt, Hagemeyer, Neyer, & Kandler, 2017; Leonhardt, Schmukle, & Exner, 2016; Mueller et al., 2016). The present studies extended this research by exploring whether changes in health affect individuals’ worldview. Specifically, we examined the role of deteriorating health in the development of cynical beliefs about human nature and its underlying mechanisms.
Theoretical Background
The concept of cynicism has a long history in psychology and social sciences alike. In clinical psychology and epidemiology, cynicism represents a cognitive component of hostility (Miller, Smith, Turner, Guijarro, & Hallet, 1996; Smith, 1992; Smith, Glazer, Ruiz, & Gallo, 2004). It is defined as a negative appraisal of other people's motives and moral character, a belief that self–interest is the primary driver of human behaviour and that most people would compromise their moral values if they could gain by it (Greenglass & Julkunen, 1989; Smith et al., 2004; Stavrova & Ehlebracht, 2016). Cynicism describes propositions people endorse about entities other than the self—human nature and people in general. Therefore, it can be considered as a worldview, that is, a set of generalized beliefs about the world (Chen et al., 2016; Koltko–Rivera, 2004; Leung et al., 2002). Given its cognitive nature, cynicism predominantly refers to how people think of others’ nature and motives, as opposed to how they feel about others or behave towards them (Smith et al., 2004; Stavrova & Ehlebracht, in press).
So far, psychological research on cynicism has attested to its negative consequences across various life domains, including social relationships, marital adjustment, financial and occupational success (Baron et al., 2007; Houston & Kelly, 1989; Kaplan, Bradley, & Ruscher, 2004; Stavrova & Ehlebracht, 2016, in press). The vast majority of the existing literature on cynicism has focused on its relations with health (for reviews, see Miller et al., 1996; Smith, 1992; Smith et al., 2004). Numerous studies provided evidence for a detrimental effect of cynicism on health outcomes. Cynicism has been associated with an elevated level of inflammatory biomarkers (Boyle, Jackson, & Suarez, 2007), metabolic syndrome (D'Antono, Moskowitz, & Nigam, 2013; Gremigni, 2006; Nelson, Palmer, & Pedersen, 2004), incidence of a large number of diseases, including cardiovascular and coronary heart disease (Chida & Steptoe, 2009), atherosclerosis (Pollitt et al., 2005), ulcer (Lemogne et al., 2015), diabetes (Wylie–Rosett et al., 2010) and dementia (Neuvonen et al., 2014) and consequently even increased mortality risks (Everson et al., 1997; Klabbers, Bosma, van den Akker, Kempen, & van Eijk, 2013; Smigelskas, Joffe, Jonyniene, Julkunen, & Kauhanen, 2017; Wong, Sin, & Whooley, 2014). Importantly, longitudinal studies have shown cynicism to predict health deterioration and disease onset years later, supporting the frequently held assumption of a causal effect of cynicism on poor health (Adams, Cartwright, Ostrove, Stewart, & Wink, 1998; Boyle et al., 2007; Keith et al., 2017; Lemogne et al., 2015; Vahtera, Kivimäki, Koskenvuo, & Pentti, 1997). Yet, none of the existing studies examined the reverse causal pathway: does poor health contribute to cynicism development as well?
Herein, we propose that poor health might be not only a consequence but also a source of cynicism. The idea that changes in health can trigger changes in individuals’ dispositions is not new. Several studies have shown declines in health to be associated with changes in major personality traits, including decreased emotional stability, extraversion, openness and conscientiousness (Jokela et al., 2014; Kornadt et al., 2017; Leonhardt et al., 2016; Mueller et al., 2016). One of the well–established consequences of deteriorating health is a loss of personal control. Personal control is defined as a belief about one's ability to affect and control the course of one's life (Lachman, 2006; Rotter, 1966). It includes two components—mastery and perceived constraints. Mastery reflects individuals’ sense of efficacy in achieving one's goals, whereas perceived constraints describe the perception of being unable to overcome external factors (luck, other people, etc.) that interfere with one's goal progress. Numerous studies have reported that health problems are related to a diminished sense of mastery and elevated levels of perceived constraints (Infurna, Gerstorf, Ram, Schupp, & Wagner, 2011; Infurna, Ram, & Gerstorf, 2013; Lachman & Agrigoroaei, 2010; Paquet, Dubé, Gauvin, Kestens, & Daniel, 2010; Roepke & Grant, 2011). Health problems typically impose restrictions on individuals’ life, including physical and activity limitations and an increased dependence on others—factors that are likely to reduce one's sense of control. Indeed, longitudinal studies have attested to the role of deteriorating health in declining perceptions of control (Cairney, Corna, Wade, & Streiner, 2007; Infurna & Okun, 2015). For example, functional limitations and a major disease onset were shown to lead to declines in perceived control over years (Drewelies, Wagner, Tesch–Römer, Heckhausen, & Gerstorf, 2017; Infurna & Okun, 2015).
Declining health and the resulting activity limitations and dependence on others might in turn increase one's propensity to endorse a cynical worldview. The feeling of being out of control and at other people's mercy might increase one's perceived vulnerability and activate self–protection strategies, including suspiciousness and hostility. Indeed, a reduced sense of personal control has been shown to result in increased hostility in the context of interethnic relations (Fritsche et al., 2017). Similarly, sociological research has proposed experiences of resource scarcity and collective threat to amplify the feeling of powerlessness and helplessness, giving rise to mistrust, suspiciousness and an increased fear of betrayal and exploitation (Ross, 2011). Finally, Stavrova and Ehlebracht (2018) explored the associations between the two facets of personal control—mastery and perceived constraints—and cynicism longitudinally. The authors proposed that, compared with mastery, the perception of constraints might be particularly important for fuelling cynicism, as it involves a sense of being dependent on other people, which might in turn elicit fear of exploitation, suspiciousness and hostility. Indeed, their results showed that a heightened sense of perceived constraints (but not mastery) predicted the endorsement of a cynical worldview over time.
Taken together, these findings suggest that poor health might be not only an outcome but also a source of a cynical worldview. Moreover, we propose that poor health and cynicism reinforce each other in a vicious cycle: a cynical worldview prospectively predicts health deterioration (H1) and poor health is prospectively associated with increasing cynicism (H2). To test these assumptions, we analysed the data from two large–scale longitudinal studies and examined bidirectional associations between poor health and cynicism (Studies 1 and 2). As the prospective effect of cynicism on health and its mechanisms received substantial research attention (for a review, see Smith et al., 2004), we concentrated our effort on understanding the mechanism underlying the reverse causal path instead: the effect of poor health on cynicism. Drawing from previous research on personal control, we examined the role of mastery and perceived constraints as potential mechanisms underlying the hypothesized effect of poor health on cynicism development (Study 2). Following Stavrova and Ehlebracht (2018), we assumed perceived constraints, but not mastery, to mediate the effect of poor health on cynicism (H3).
As cynicism has been previously shown to be preferentially endorsed by individuals with certain socio–demographic characteristics, such as male gender, younger age as well as lower education and income (Haukkala, 2002; Stavrova & Ehlebracht, in press), and these characteristics are in turn associated with health (e.g., Adler et al., 1994); we included age, gender, education and income as covariates in both studies.
We used publicly available datasets, referenced in the Method sections. The analysis scripts can be accessed at https://osf.io/pn3vt/?view_only=cb754de30ea046b9a11d74a8c4d60823. As these are secondary data analyses, our hypotheses were not preregistered.
Study 1
Study 1 used a three–wave longitudinal dataset from about 20 000 individuals collected over 10 years. It examined whether subjective health is prospectively associated with lower cynicism and cynicism is prospectively associated with worsened subjective health.
Method
We used the data from the German Socio–Economic Panel study (v.32). German Socio–Economic Panel is a large nationally representative panel study in Germany that has been conducted since 1984 by DIW Berlin. A measure of cynicism was included in three waves, separated by a time lag of five years: 2003 (t1), 2008 (t2) and 2013 (t3). All three waves included a measure of subjective health. Overall, 40 445 (Mage = 41.05, SDage = 18.36, 47% male) individuals had valid values on the key measures (cynicism and health) in at least one of these waves. A total of 14 702 had valid values at t1 and t2; 11 335—at t2 and t3; 9169—at t1 and t3; and 8882—in all three waves. To increase the precision of the estimation of both concurrent and lagged effects, we decided to use the overall sample. Full maximum likelihood estimation method was used to deal with missing values. The questionnaire and the data are available online (Wagner, Frick, & Schupp, 2007).
To measure cynicism, we used the five items that originated in the Faith in People Scale (Rosenberg, 1956): ‘Do you believe that most people would exploit you if they had the opportunity or would attempt to be fair toward you?’, ‘Would you say that for most of the time, people attempt to be helpful or only act in their own interests?’, ‘On the whole one can trust people’, ‘Nowadays, one cannot rely on anyone’ and ‘If one is dealing with strangers, it is better to be careful before one can trust them’. The former two items were answered on a binary scale and the latter three on a 4–point agree–disagree scale. The responses were recoded such that higher values reflected stronger cynicism, normalized to vary between 1 and 10 and combined into a cynicism scale (2003: Cronbach's α = 0.69; 2008 and 2013: Cronbach's α = 0.69).
To measure subjective health, participants responded to the following item: ‘How would you describe your current health?’ (1 = very good, 2 = good, 3 = satisfactory, 4 = poor and 5 = bad). Responses were recoded such that higher values indicate better health.
Control variables included age (at t1), gender (1 = male and 0 = female), years of education and personal annual income before taxes in euros (a natural logarithm of income was taken to adjust for a skewed distribution).
Analytic strategy
First, we examined the measurement model of cynicism. The model yielded a good fit [χ2(72) = 3300.33, p < .001, comparative fit index (CFI) = 0.957, Tucker–Lewis Index (TLI) = 0.938, root mean square error of approximation (RMSEA) = 0.033 and standardized root mean square residual (SRMR) = 0.026; see Table S1]. Next, to make sure that our measure of cynicism has a sufficient level of measurement invariance over time, we compared the model with free versus constrained factor loadings (Little, Preacher, Selig, & Card, 2007). Here and throughout the paper, to compare nested models, we used the change in the fit indices, rather than the χ2 difference test, because the latter tends to be too conservative in large samples (Cheung & Rensvold, 2002). The differences in the fit indices between these models were smaller than the usual cut–off values for model comparison (Chen, 2007; Cheung & Rensvold, 2002), suggesting that the measure of cynicism has metric measurement invariance and can be used for longitudinal analyses (fit statistics are reported in Table S1).
To test the reciprocal bidirectional relations between cynicism and subjective health, we used a cross–lagged panel analysis. The analyses were conducted with the
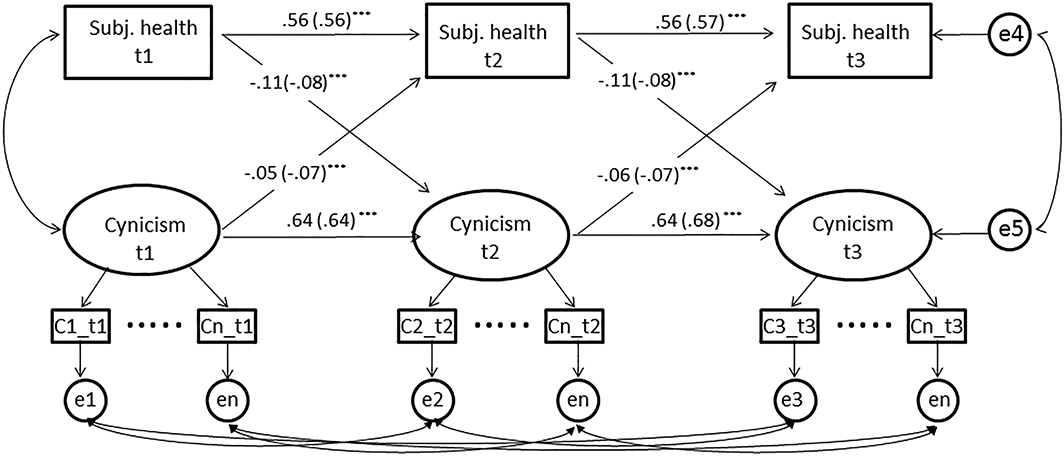
Standard cross–lagged panel model, Study 1. ***p < .001, **p < .01, and *p < .05. Unstandardized path coefficients. Standardized path coefficients are in the brackets.
Given an increasing consensus in the methodological literature regarding the importance of disentangling between–persons and within–persons effects (Berry & Willoughby, 2017; Hamaker, Kuiper, & Grasman, 2015), we additionally examined the cross–lagged associations between health and cynicism at the within–persons level, using a random–intercept cross–lagged panel model (Hamaker et al., 2015). This approach entails adding random intercepts of health and cynicism that capture between–persons variance in these constructs (Figure 3). As a result, variance captured by autoregressive and cross–lagged effects reflects individuals’ fluctuations in health and cynicism over time, or, in other words, how much their scores at each measurement occasion deviate from their expected scores. Hence, the cross–lagged effects in this model inform us as to whether individuals with worse health at t (relative to their typical health) tend to score higher on cynicism at t+1 (relative to their typical cynicism level) and whether participants with higher cynicism at t (relative to their typical cynicism) will report a poorer health status at t+1 (relative to their typical health). These analyses were conducted with
Results
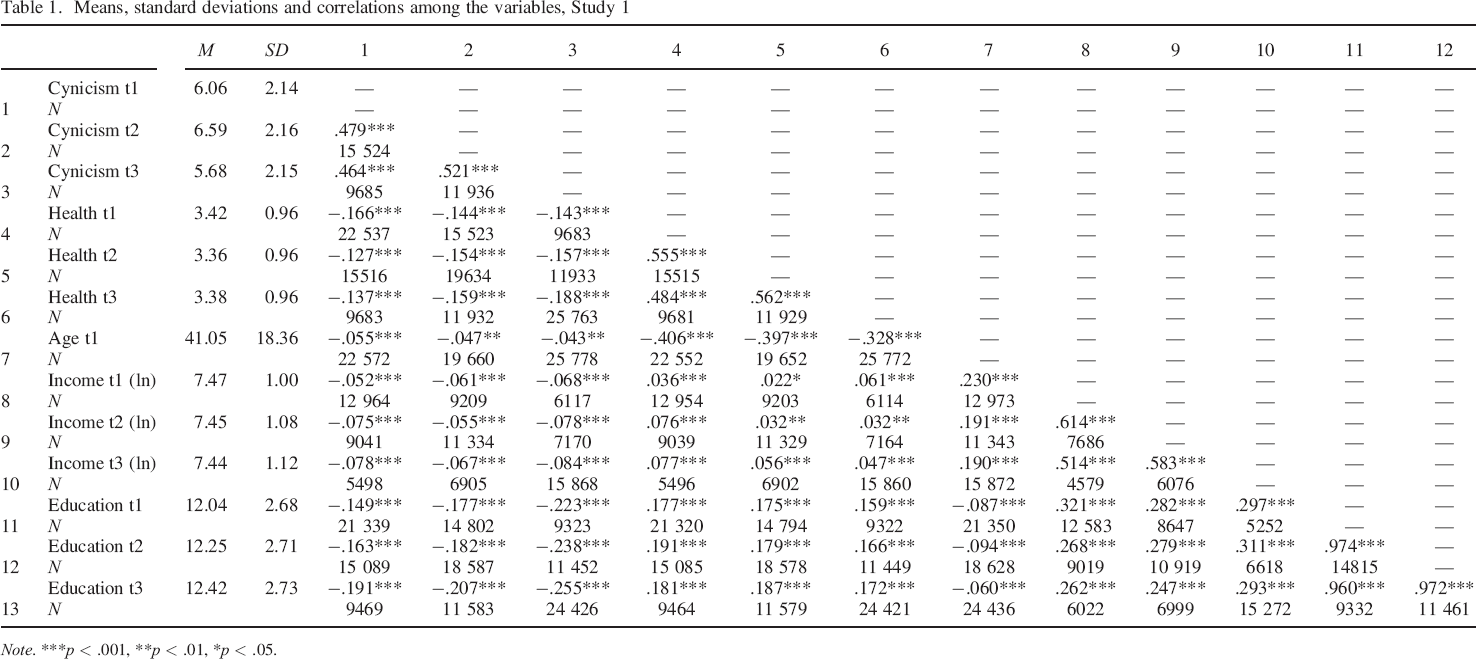
Means, standard deviations and zero–order correlations among the variables are reported in Table 1. At all three measurement occasions, cynicism showed negative associations with subjective health [t1: r = −.17, p < .001, 95% confidence interval (CI; −0.18, −0.15); t2: r = −.15, p < .001, 95% CI (−0.17, −0.14); t3: r = −.19, p < .001, 95% CI (−0.20, −0.18)].
Means, standard deviations and correlations among the variables, Study 1
Note.
p < .001,
p < .01,
p < .05.
Between–persons analysis: Standard cross–lagged panel model
The first tested model estimated autoregressive and cross–lagged effects between health and cynicism without socio–demographic controls (Figure 1). The model showed appropriate fit: χ2(114) = 4715.015, CFI = 0.933, TLF = 0.910, RMSEA = 0.042 and SRMR = 0.049 (Hu & Bentler, 1999; Marsh, Hau, & Grayson, 2005). Constraining autoregressive and lagged parameters to be equal across time resulted in a nearly identical fit: χ2(118) = 4742.072, p < .001, CFI = 0.933, TLI = 0.913, RMSEA = 0.042 and SRMR = 0.050. Therefore, we decided to report the results of the constrained model (Figure S1 displays the results of the unconstrained model). The examination of cross–lagged effects revealed significant bidirectional associations between cynicism and health. On the one hand, consistent with existing longitudinal studies, cynicism at time t predicted worse health at time t+1 (β = −.07, p < .001), when controlling for health at time t. At the same time, individuals with lower levels of self–rated health at time t reported higher cynicism scores at time t+1 (β = −.08, p < .001), when controlling for their cynicism level at time t.
In a second step, we estimated a model that included additional paths of control variables (gender, age, education and income) on all endogenous variables (cynicism and health at t2 and t3). The model showed appropriate fit: χ2(204) = 2701.006, p < .001, CFI = 0.923, TLI = 0.904, RMSEA = 0.040 and SRMR = 0.055. Importantly, both lagged effects were robust against these controls (Figure 2).
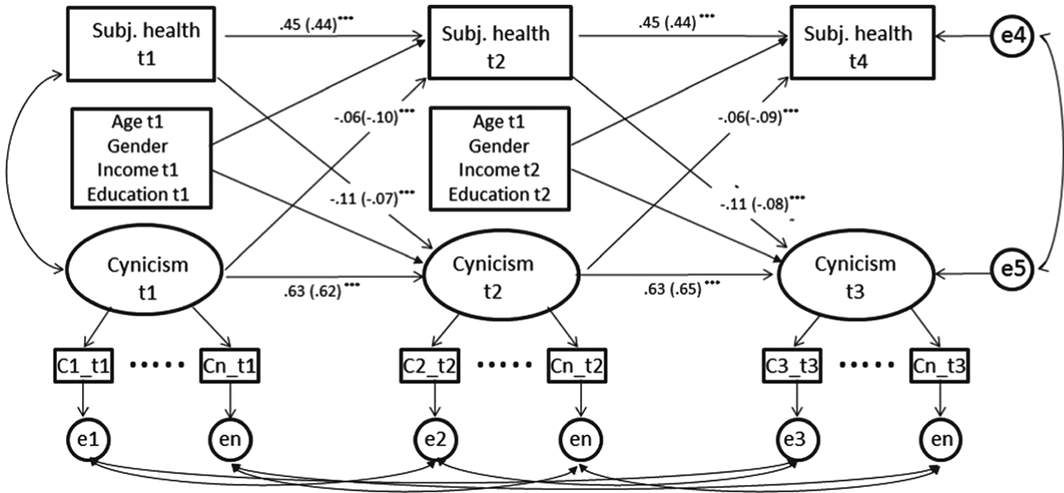
Standard cross–lagged panel model with control variables, Study 1. ***p < .001, **p < .01, and *p < .05. Unstandardized path coefficients. Standardized path coefficients are in the brackets. Age at t1 was used in both waves, as age at t1 and t2 are perfectly correlated.
Finally, as previous research has shown the associations between personality (e.g., neuroticism) and health to depend on age (Mueller, Wagner, Smith, Voelkle, & Gerstorf, 2017), we examined whether the cross–lagged associations between health and cynicism differ across different age groups using a multiple group analysis. We divided the dataset into three age groups: early adulthood (<40, n = 20 566), adulthood (40–60, n = 12 017) and old age (>60, n = 7862). The cross–lagged effects were very similar across these three groups, and constraining the regression weights to be equal across the different age groups did not result in a worse fit (Table S2). Therefore, we concluded that the results do not differ by age.
Within–persons analysis: Random–intercept cross–lagged panel model
First, we computed how much variance in both health and cynicism is between and within individuals. The intraclass correlation coefficients for health and cynicism reached 0.51 and 0.48, respectively, suggesting that about half of the variance in both constructs can be explained by differences between individuals, while the other half can be explained by differences within individuals (i.e. by temporal fluctuations). Following the Hamaker et al. (2015) modelling recommendations, to capture between–persons differences in health and cynicism, we created two random–intercept factors (using observed scores as indicators of these factors with all factor loadings constrained to a value of 1). Observed scores of cynicism and health were regressed on their latent factors (with the loadings constrained to a value of 1), and these latent factors (rather than observed scores) were used to estimate the model parameters. As these latent factors reflect individual's temporal deviations from their expected scores on cynicism and health, cross–lagged parameters indicate whether deviations in an individual's expected score on one variable (e.g. health) at t predict deviations from this individual's expected score on the other variable (e.g. cynicism) at t+1 while controlling for this individual's deviations from his/her expected score on this other variable (e.g. cynicism) at t. As there were changes in mean levels of both cynicism and health over time, the mean structure of the model was left unconstrained (i.e. mean levels of health and cynicism were not held constant across waves).
We first fitted a model in which autoregressive and cross–lagged effects were allowed to vary across time. The model fitted the data perfectly: χ2(1) = 0.08, p = .77, CFI = 1.00, TLI = 1.00, RMSEA = 0.000 and SRMR = 0.001. We then imposed constraints on autoregressive and lagged parameters (constraining them to be equal across the three waves). The differences in the fit indices between this model and the unconstrained model (∆CFI = 0.002, ∆TLI = 0.005, ∆RMSEA = 0.023 and ∆SRMR = 0.016) were smaller than the usual cut–off values for model comparison (Chen, 2007; Cheung & Rensvold, 2002); therefore, we retained the constrained model as our final model (Figure 3).
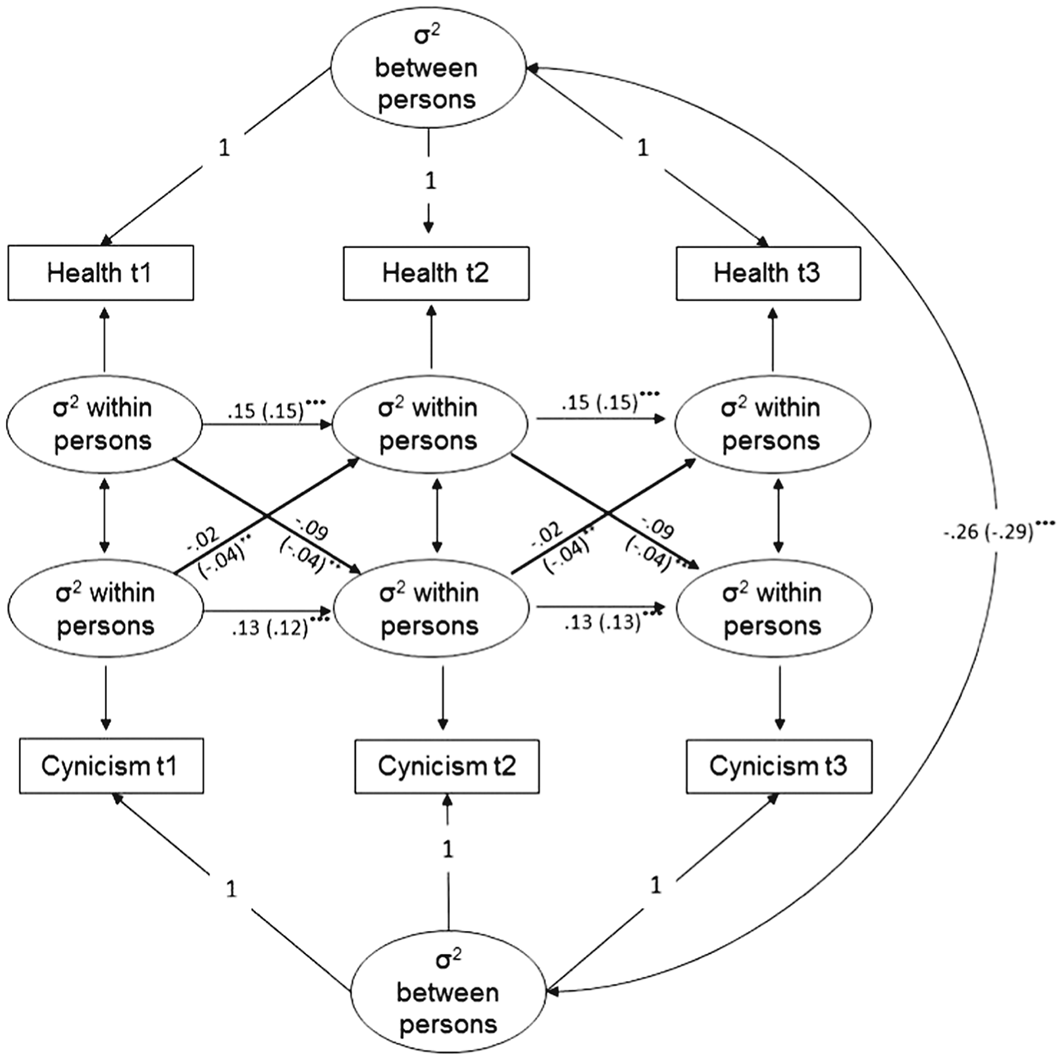
Random–intercept cross–lagged panel model, Study 1. ***p < .001, **p < .01, *p < .05. Unstandardized path coefficients. Standardized path coefficients are in the brackets.
At the between–persons level, the random intercepts of health and cynicism were negatively associated with each other (β = −.29, p < .001), suggesting that individuals who reported poor health on average across the three waves scored higher on cynicism across these waves. An examination of the cross–lagged effects showed that individuals with worse (than expected) health at time t experienced higher (than expected) cynicism at t+1 (β = −.04, p = .009). Similarly, higher (than expected) cynicism at t led to worse (than expected) health at t+1 (β = −.04, p = .008). These findings are consistent with the results of the standard cross–lagged analysis.
Finally, we added socio–demographic control variables as predictors of the random intercept factors of cynicism and health (thereby individuals’ observed scores on education at t1–t3 and income at t1–t2 were regressed on their latent factors with all factor loadings constrained to 1). Following Ellen Hamaker's (2018) recommendations, covariances between the between–persons continuous variables (age, education and income) and the within–persons variables (used in the model) were fixed to zero. The model showed appropriate fit: χ2(64) = 2245.94, p < .001, CFI = 0.949, TLI = 0.928, RMSEA = 0.090 and SRMR = 0.069. Importantly, the addition of the control variables did not change the cross–lagged effects (health → cynicism: β = −.04, p = .043; cynicism → health: β = −.05, p = .035).
Discussion
In summary, these results provided first evidence for bidirectional prospective effects of cynicism and self–rated health status. Across three measurement occasions that spanned over 10 years, cynicism was associated with declining health, and poor health was associated with increasing levels of cynicism over time. Importantly, this pattern was reliably obtained using both a standard and a random–intercept cross–lagged panel analyses.
Study 2
Study 2 extended the results of Study 1 in several ways. First, we replicated the bidirectional reciprocal relations between health and cynicism in a large sample of elderly Americans. Second, we extended the effect to a wider range of health measures, including self–rated health status, number of doctor–diagnosed chronic conditions, functional limitations, sensory problems and objective physical measures (blood pressure and pulse rate, lung function, hand strength and balance and timed walk tests). Finally, we explored the hypothesized mechanisms through which poor health might contribute to cynicism. Specifically, we used a longitudinal mediation analysis in which the effect of poor health on increasing cynicism is mediated via decreases in personal control (mastery and perceived constraints). Following previous studies (Stavrova & Ehlebracht, 2018), we expected perceived constraints, but not mastery, to mediate the effect of poor health on cynicism. Additionally, making use of a wide range of health indicators available in this study and between–indicators variation in the association with personal control, we examined whether the effect of any specific health limitation on cynicism depends on the degree to which this limitation is associated with a sense of constraints in an individual's life.
We also tested whether the proposed mediation effect of perceived constraints is independent from the processes associated with psychological distress more generally. For example, health deterioration is likely to be associated with declining psychological health, particularly with increased depressive symptoms (e.g. Uchmanowicz & Gobbens, 2015), which might in turn prompt individuals to see human nature in a negative light. Therefore, to make sure that the mediation via perceived constraints is not a result of an overlap with this alterative process, we included depressive symptoms as another competing mediator.
Finally, cynical individuals tend to score higher on neuroticism than their less cynical counterparts (Stavrova & Ehlebracht, 2016), and neuroticism appears to be both an antecedent and a consequence of poor health (e.g. Kornadt et al., 2017; Mroczek & Spiro, 2007). Therefore, in addition to age, gender, education and income, we included individual differences in neuroticism as another control variable in Study 2. 1
Method
This study used the data from the Health and Retirement Study (HRS; 2012). HRS is a nationally representative panel study of Americans aged 50 and older. The study includes a wide range of self–report health measures as well as a range of physical measures and is therefore particularly suited for our investigation. In half of the sample, the measures of interest were assessed in 2006 (t1) and 2010 (t2). For the other half, they were administered in 2008 (t1) and 2012 (t2). We combined these two subsamples.
At t1, 14 583 (Mage t1 = 68.83, SDage t1 = 10.49, 40.4% male) adults participated in the study and at t2, 15 533 (Mage t1 = 63.23, SDage t1 = 11.27, 40.8% male). A total of 10 324 individuals (Mage t1 = 67.53, SDage t1 = 9.62, 39.7% male) completed both t1 and t2. Like in Study 1, our analyses included individuals who completed at least one wave, and full maximum likelihood estimation method was used to deal with missing values.
Measures
The survey included a 5–item version of the cynical distrust scale (Cook & Medley, 1954; Greenglass & Julkunen, 1989) (sample items: ‘Most people will use somewhat unfair means to gain profit or an advantage rather than lose it’ and ‘I think most people would lie in order to get ahead’; Cronbach's α = .79 at both t1 and t2). The complete list of items is provided in the Supporting Information. Responses were given on a 6–point scale (1 = strongly disagree and 6 = strongly agree).
Mastery and perceived constraints were measured with five items each (mastery, sample item: ‘Whether or not I am able to get what I want is in my own hands’; Cronbach's α = .89 at t1 and .90 at t2; perceived constraints, sample item: ‘Other people determine most of what I can and cannot do’; Cronbach's α = .86 at t1 and .87 at t2). A 6–point agree–disagree response scale was used. The two–factorial structure was confirmed in a confirmatory factor analysis that modelled mastery and constraints at t1 and t2 as four latent correlated factors (CFI = 0.94, TLI = 0.93, RMSEA = 0.06 and SRMR = 0.03; Table S1).
Depressive symptoms were measured with nine items from the CES–D (Centre for Epidemiological Studies—Depression) scale (Radloff, 1977). Participants were asked to indicate whether within the last week they felt depressed, everything they did was an effort, their sleep was restless, they were happy (reverse–coded), lonely, enjoyed life (reverse–coded), felt sad, could not get going or had a lot of energy (reverse–coded) (yes vs. no; Cronbach's α = .80 at both t1 and t2).
To maximize the generalizability of our results, our analyses were based on all health indicators available in HRS from 2006 to 2012: self–reported health status, functional health limitations and symptoms, doctor–diagnosed conditions and a battery of physical measurements. All these measures are described below.
Subjective health
Participants rated their health on a 5–point scale (1 = excellent, 2 = very good, 3 = good, 4 = fair and 5 = poor). The responses were recoded such that higher values reflect better heath.
Number of chronic conditions
Participants reported whether they had been diagnosed (by a doctor) with any of the following 12 chronic conditions since the last interview (1 = yes and 0 = no): hypertension, diabetes, cancer, lung disease, coronary heart disease, stroke, arthritis, incontinence and psychiatric problems. We computed a sum score reflecting the number of reported diseases.
Experience of pain
Participants indicated whether they were ‘troubled with pain’ or not (1 = yes and 0 = no).
Functional limitations: Difficulties with physical activities
Participants indicated whether they had difficulties (1 = yes and 0 = no) performing 12 physical activities (e.g. climbing stairs, jogging, walking one block, pushing, lifting or carrying over 10 lb). The complete list of activities is presented in the Supporting Information. We computed the number of activities participants reported having difficulties with as an index of difficulties with physical activities.
Functional limitations: Difficulties with basic activities
A subsample of participants completed a measure of difficulties with basic activities. 2 They indicated whether they had difficulties (1 = yes and 0 = no) with any of the six basic daily activities, such as dressing, walking across the room, eating or using the toilet (see Supporting Information for complete list). As the number of activities participants reported difficulties with included an excessive number of zeros (75.8% and 71.4% had a value of 0 at t1 and t2, respectively), the analyses involving this variable relied on a zero–inflated Poisson model (Coxe, West, & Aiken, 2009).
Functional limitations: Difficulties with instrumental daily activities
A subsample of participants completed a measure of difficulties with instrumental daily activities. 3 These participants indicated whether they had difficulties (‘yes’, ‘no’, ‘cannot do’ and ‘do not do’) with six instrumental activities of daily living because of physical, mental, emotional or memory problems. The activities included grocery shopping, managing money or preparing meals (see Supporting Information for complete list). Participants who indicated that they cannot do the activity were further asked if it was because of health or memory problems. We computed the number of activities participants had difficulties with or could not do because of health or memory problems. As the number of activities participants reported difficulties with included an excessive number of zeros (82.3% and 75.8% had a value of 0 at t1 and t2, respectively), we used a zero–inflated Poisson model (Coxe et al., 2009).
Sensory problems
To measure sensory problems, participants rated their general eyesight, distant and near vision as well as hearing (when using glasses or corrective lenses/hearing aids) (1 = excellent and 5 = poor). Responses were combined into an index of sensory problems. Higher values on this index reflect impaired senses.
Finally, participants were asked to rate their hand strength (self–rated hand strength), indicate how often they become short of breath when awake, excluding periods of exercise (self–rated lung function) and how often they have difficulties with balance (self–rated balance). Responses to these three questions were given on a 4–point scale and were recoded such that higher values reflect a better self–rated hand strength, lung function and balance.
The study included the following physical measures of health status.
Hand grip strength
Participants were asked to squeeze the metre as hard as they could for a couple of seconds. Two measures were taken with each hand. These four measures were averaged and, consistent with established practice (Bohannon, Peolsson, Massy–Westropp, Desrosiers, & Bear–Lehman, 2006; Günther, Bürger, Rickert, Crispin, & Schulz, 2008), adjusted for participants’ age, gender and height. Specifically, for each participant, we computed a predicted hand grip strength value, using age, gender and body size as predictors in a regression analysis. This predicted value reflects the hand grip strength one ‘should’ have given one's age, gender and body size. To capture participants’ deviation from this normative value, we divided their actual hand grip strength value by their normative (or ‘should’) value. The computed value was used as an indicator of relative hand grip strength.
Lung function
The peak expiratory flow (PEF) test was used with a Mini–Wright peak flow metre with a disposable mouthpiece. The test requires participants to blow in the device as hard as they can. Three measurements were taken. As PEF is defined as the maximum expiratory flow that a subject can produce, the highest measure obtained was used in the analyses (like in previous studies, e.g. Terracciano, Stephan, Luchetti, Gonzalez–Rothi, & Sutin, 2017). PEF is typically used to diagnose a chronic obstructive pulmonary disease (Jackson & Hubbard, 2003), with the clinical cut–off of PEF less than 80% of normative values as an indicator of the presence of the disease. Therefore, following this existing practice (Jackson & Hubbard, 2003; Roberts & Mapel, 2012; Terracciano et al., 2017), we used participants’ PEF value to compute the clinical cut–off of PEF less than 80% of normative values. Similar to previous studies (see aforementioned discussion), normative values were obtained by regressing PEF on age, sex (1 = male and 0 = female), height and race (1 = Caucasian and 0 = other) in a subsample of participants with no history of smoking, chronic lung disease and who indicated to never experience breathing problems (shortness of breath) (the equations used to compute the predicted values are given in the Supporting Information). Participants’ PEF was then divided by the predicted values and dichotomized, with scores less (vs. more) than 80% of the normative value reflecting a good (vs. poor) lung function.
Balance test
Static balance was measured with three progressively difficult tests: side–by–side, semi– and full–tandem tests. These tests require participants to take on a specified posture and hold it for a certain amount of time. Participants started with the semi–tandem stand. If they were unable to hold it for 10 seconds, they proceeded with an easier test—side–by–side tandem; 3.8% (t1) and 4.3% (t2) were successful, whereas 0.1% (t1 and t2) were not. Participants who were able to hold the semi–tandem stand for 10 seconds, proceeded with the full–tandem stand that they were required to hold for either 60 seconds (if aged below 65) or 30 seconds (if aged 65 or older); 74.1% (t1) and 70.6% (t2) were successful, whereas 22.0% (t1) and 25.0% (t2) were not. Following previous studies (Stevens, Lang, Guralnik, & Melzer, 2008), participants who successfully completed both the semi–tandem and the full–tandem tests were given a score of 1 (good balance), whereas all other participants were given a score of 0 (impaired balance).
Arterial blood pressure (systolic and diastolic) and pulse rate were measured three times, 45 seconds apart. Invalid values (specifically, zeros) were coded as missing (0.01–0.26% cases). We computed an average of three measurements.
Timed walk
Participants were asked to walk the 98.5–in. course two times (there and back) and were timed using a stopwatch. Higher values indicate slower walk gait. Only individuals who were 65 years old or older were eligible for this test.
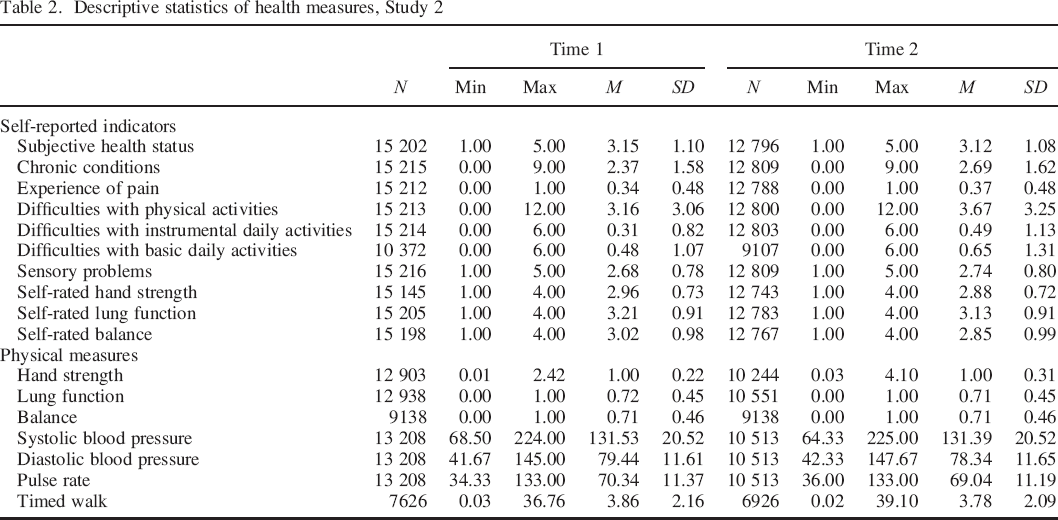
A detailed description of all physical measures is provided in the HRS codebook. The descriptive statistics for each physical measure are summarized in Table 2.
Descriptive statistics of health measures, Study 2
As in Study 1, control variables included participants’ age (at t1), gender (1 = male and 0 = female), education (1 = lower than high school, 2 = generational educational development degree, 3 = high school diploma, 4 = some college and 5 = college and above) and log–transformed income (at t1, total annual household income in dollars). In addition, we controlled for individual differences in neuroticism (four items: moody, worrying, nervous and calm (reverse–coded); 4–point scale). The scale originated in the International Personality Item Pool (https://ipip.ori.org/) and showed an acceptable internal consistency: Cronbach's α = .71 (t1) and .72 (t2).
Results
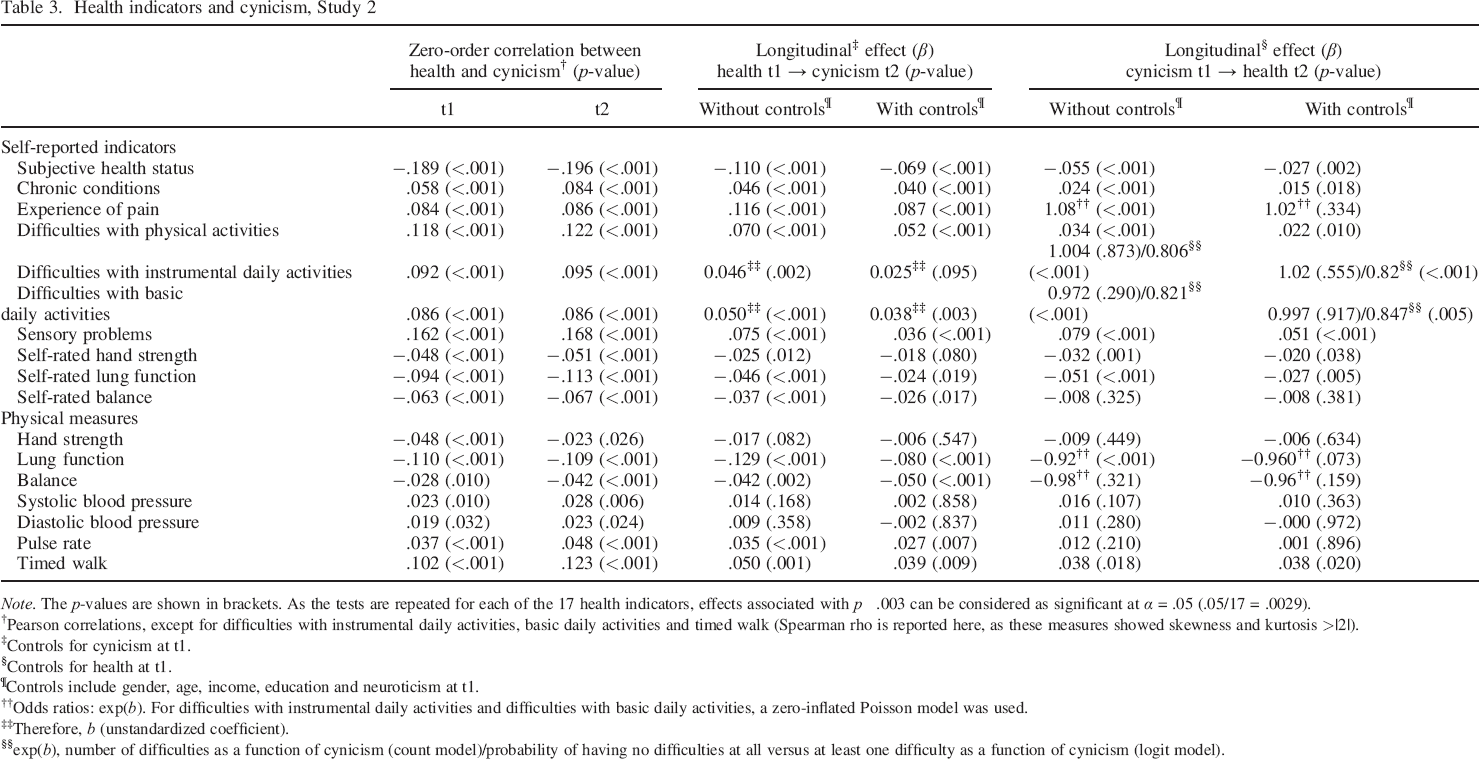
Table 3 gives an overview of the study results. Given that this study included 17 different health indicators, we adjusted for multiple testing and interpreted the effects associated with p < .003 as “significant” (.05/17 = .0029).
Health indicators and cynicism, Study 2
Note. The p–values are shown in brackets. As the tests are repeated for each of the 17 health indicators, effects associated with p ˂ .003 can be considered as significant at α = .05 (.05/17 = .0029).
Pearson correlations, except for difficulties with instrumental daily activities, basic daily activities and timed walk (Spearman rho is reported here, as these measures showed skewness and kurtosis >|2|).
Controls for cynicism at t1.
Controls for health at t1.
Controls include gender, age, income, education and neuroticism at t1.
Odds ratios: exp(b). For difficulties with instrumental daily activities and difficulties with basic daily activities, a zero–inflated Poisson model was used.
Therefore, b (unstandardized coefficient).
exp(b), number of difficulties as a function of cynicism (count model)/probability of having no difficulties at all versus at least one difficulty as a function of cynicism (logit model).
First, we computed the zero–order correlations between cynicism and each health indicator at t1 and t2. At both measurement occasions, cynical individuals were more likely to report a higher number of doctor–diagnosed chronic conditions, were more likely to be troubled with pain, have difficulties with physical, instrumental and basic daily activities and sensory problems. The correlations ranged between r = .058 [p < .001, 95% CI (0.04. 0.07)] and r s = .122 [p < .001, 95% CI (0.10, 0.14)]. Cynical individuals were also more likely to report worse subjective health status [r = −.189, p<< .001, 95% CI (−0.20, −0.17) and r = −.196, p < .001, 95% CI (−0.21, −0.18), at t1 and t2, respectively].
Cynicism showed negative associations with self–rated hand strength, self–rated lung function and self–rated balance {r between −.048 [p < .001, 95% CI (−0.07, −0.03)] and −.113 [p < .001, 95% CI (−0.13, −0.09)]}. The associations between cynicism and physical measures followed a similar pattern. For example, cynical individuals needed longer to walk a set distance [t1: r s = .102, p < .001, 95% CI (0.08, 0.12); t2: r s = .123, p < .001, 95% CI (0.10, 0.14)], performed worse on the lung function test [t1: r s = −.110, p < .001, 95% CI (−0.13, −0.09); t2: r s = −.109, p < .001, 95% CI (−0.13, −0.09)] and showed an elevated pulse rate [t1: r = .037, p < .001, 95% CI (0.02, 0.06); t2: r = .048, p < .001, 95% CI (0.03, 0.07)]. The associations between cynicism and blood pressure, balance and hand strength were in the expected direction but did not reach the conservative level of significance (p < .003) we set for this study (see Table 3).
Cross–lagged path analyses
To test the prospective associations between health and cynicism, we conducted a series of cross–lagged path analyses. As this study included only two measurement points, we could only use the standard cross–lagged panel models (a random–intercept cross–lagged panel model requires at least three waves of data). The models included both cross–lagged and autoregressive effects. Cynicism was modelled as a latent variable and health indicators as observed variables. 4 Separate models were conducted for each health indicator. Like in Study 1, in the first step, we estimated the models including just the cross–lagged and the stability paths. In the second step, we added the control variables (age, gender, income, education and neuroticism at t1) as predictors of both cynicism and health at t2. Full maximum likelihood estimation was used, except for the models with binary endogenous variables, in which case a diagonally weighted least squares estimator was used (Rosseel, 2012).
The results of these analyses are summarized in Table 3. All models reached an at least appropriate fit (see Table S2). Consistent with previous findings, cynical individuals were more likely to develop health problems over time than less cynical individuals. Specifically, cynicism at t1 predicted an increased experience of pain (OR = 1.08, p < .001), more chronic conditions, difficulties with physical activities and sensory problems at t2, when controlling for the respective health indicators at t1 (β between .024 and .079, all ps < .001). For difficulties with instrumental and basic daily activities, a zero–inflated Poisson model revealed that cynicism was associated with a decreased likelihood of reporting ‘no difficulties’ (OR = 0.81 and OR = 0.82, p < .001) but was not associated with the number of difficulties reported (ps > .003). Cynicism at t1 prospectively predicted poorer self–rated health, self–rated hand strength and lung function (β between −.031 and −.051, all ps < .001) as well as a poorer performance in the lung function test (OR = 0.92, p < .001). The prospective effects of cynicism on several other physical measures (self–rated balance, hand strength and balance tests, blood pressure and pulse rate) did not reach significance (ps > .003). Finally, after introducing the control variables (age, gender, education, income and neuroticism at t1), the prospective effect of cynicism on some health indicators (self–rated health, difficulties with instrumental daily activities and sensory problems) remained stable, whereas for the others, it disappeared (Table 3). Overall, cynicism appears to contribute to health decline over time, yet its effect is mainly restricted to subjective health measures, sensory problems and functional limitations.
A look at the effects denoting a reversed direction (from health at t1 to cynicism at t2) suggests that poor health represents a likely antecedent of cynicism. Specifically, chronic conditions, experience of pain, functional limitations and sensory problems at t1 predicted an increased level of cynicism at t2, when controlling for cynicism at t1 (β between .046 and .116, all ps < .001). On the opposite, the better participants rated their general health, lung function and balance at t1, the less likely they were to endorse a cynical worldview at t2 (when controlling for cynicism at t1) (β between −.037 and −.110, all ps < .001). Finally, not only self–reported but also physical health measures showed significant prospective effects on cynicism. Specifically, individuals who performed poorly on the lung function and balance and timed walk tests a t1 were more likely to report increased cynicism at t2 (when controlling for baseline cynicism) (β = −.129, p < .001; β = −.042, p = .002; and β = .50, p < .001, respectively). In fact, the only physical test that did not prospectively predict cynicism was the hand strength test (p > .05). High pulse rate at t1 was also positively associated with cynicism at t2 (β = .035, p < .001); however, blood pressure (neither systolic nor diastolic) was not (p > .05). All these effects remained stable when controlling for age, gender, education, income and neuroticism at t1 (Table 3), except for the effects of self–rated lung function and balance, pulse rate and timed walk test, as well as difficulties with instrumental daily activities, which became non–significant (ps > .003).
Longitudinal mediation analyses
We used a longitudinal mediation analysis to examine whether the prospective effects of health at t1 on cynicism at t2 were mediated by increased levels of perceived constraints, depressive symptoms and decreased levels of mastery. As we only have two measurement points, following the recommendations by Cole and Maxwell (2003) as well as Preacher (2015), we conducted pairs of longitudinal tests that controlled for scores of the mediators and dependent variable at the previous time point. In other words, we constructed a structural equation model that included the effects of health at t1 on each proposed mediator at t2, when controlling for mediator scores at t1 (path a), as well as the effects of each mediator at t1 on cynicism at t2, when controlling for cynicism at t1 (path b) (see Figure 4). In other words, our estimates of both paths a and b represent longitudinal effects, making this approach particularly suitable for two–wave panel data (Cole & Maxwell, 2003). We conducted separate tests for each health indicator (overall, 17 models were estimated). All three mediators (perceived constraints, mastery and depressive symptoms) were tested simultaneously. The indirect effect was computed by multiplying path a by path b. Standard errors were computed using bootstrapping; all variables were modelled as observed variables.
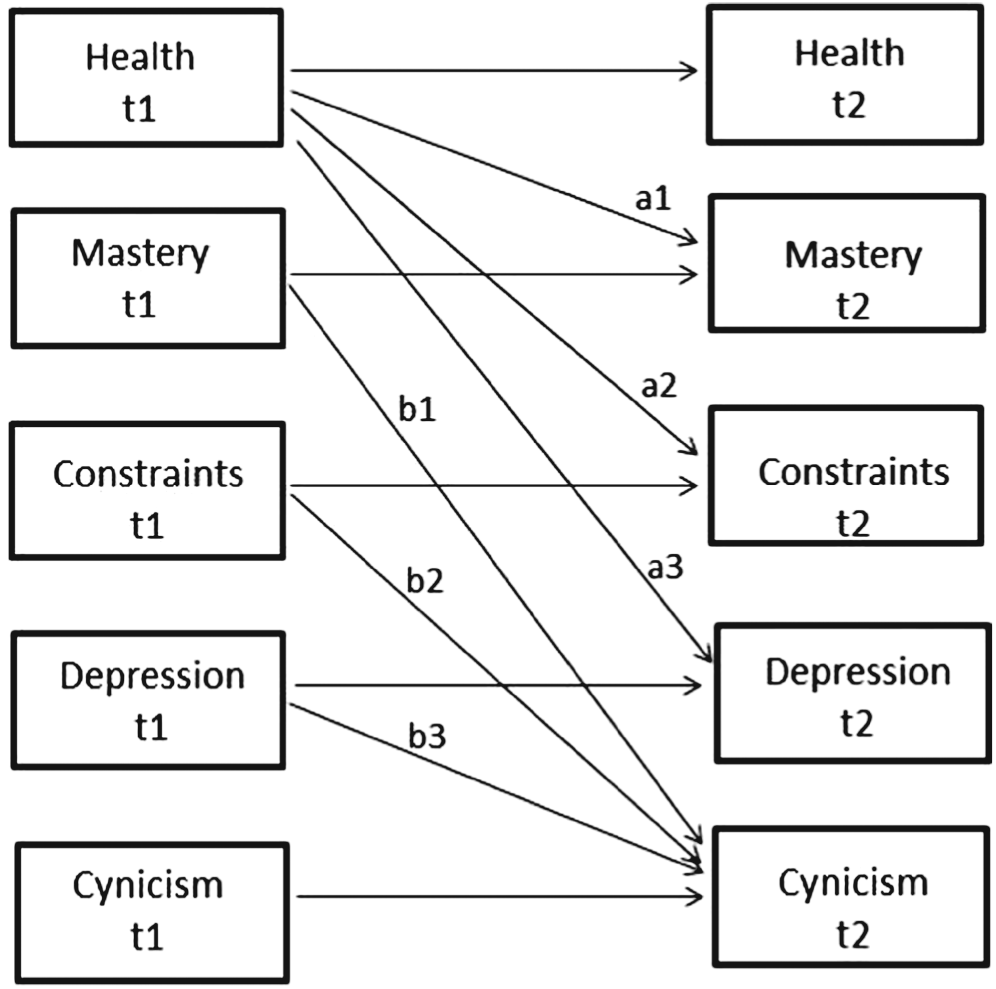
Longitudinal mediation model, Study 2.
The results of the mediation analyses are presented in Table 4. Baseline health predicted perceived constraints (β between |.03|, p = .002 and |.17|, p < .001, except for diastolic blood pressure and pulse rate), depressive symptoms (β between|.03|, p = .002 and |.23|, p < .001, except for diastolic blood pressure and pulse rate) and mastery (β between |.04|, p < .001 and |.19|, p < .001, except for systolic and diastolic blood pressure and pulse rate) at a follow–up, controlling for perceived constraints, depressive symptoms and mastery at baseline. In turn, perceived constraints (β between .07 and .10, p < .001), depressive symptoms (β between .04 and .07, p < .001) but not mastery (all ps > .05) predicted changes in cynical beliefs from baseline to the follow–up. The indirect effect via perceived constraints and depressive symptoms reached significance (all ps < .001), whereas the indirect effect via mastery did not (all ps > .05). These results were obtained with respect to all health indicators, except for blood pressure and pulse rate. All the coefficients are presented in Table 4 (fit statistics can be found in Table S4).
Mediation analyses, Study 2
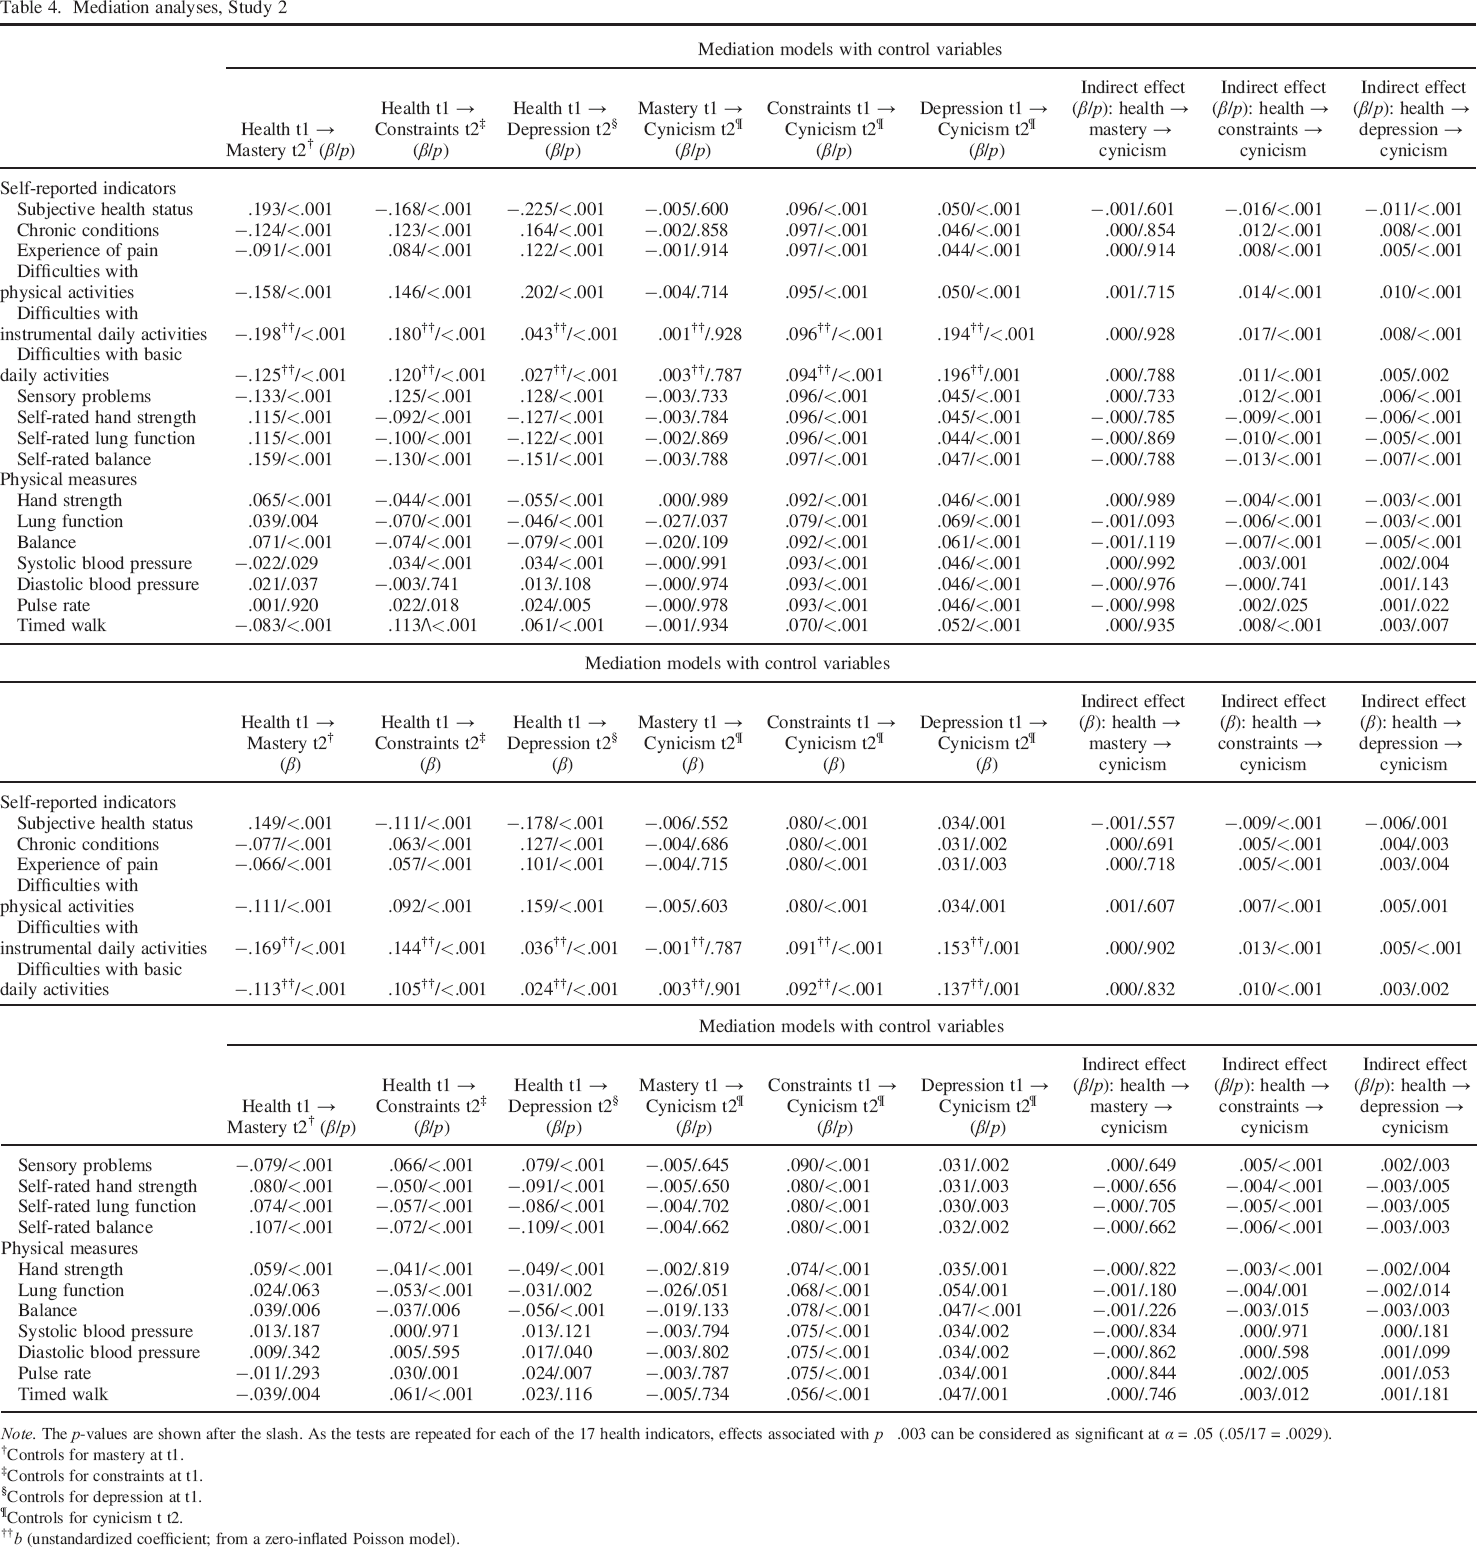
Note. The p–values are shown after the slash. As the tests are repeated for each of the 17 health indicators, effects associated with p ˂ .003 can be considered as significant at α = .05 (.05/17 = .0029).
Controls for mastery at t1.
Controls for constraints at t1.
Controls for depression at t1.
Controls for cynicism t t2.
b (unstandardized coefficient; from a zero–inflated Poisson model).
Additional analyses revealed that these mediation results were robust against controlling for the effects of age, gender, education, income and neuroticism at t1 on all endogenous variables (i.e. health, perceived constraints, mastery, depressive symptoms and cynicism at t2), with the following exceptions: the indirect effect of the lung function test via depressive symptoms and the indirect effect of the balance test via perceived constraints turned non–significant (see Table 4). To summarize, the longitudinal mediation analyses pointed at the role of perceived constraints and depressive symptoms, but not mastery, in explaining the prospective effects of health on cynicism.
Explaining between–indicators variability
A look at Table 3 shows that even though nearly all health indicators included in the survey prospectively predicted cynicism, the effect sizes varied substantially between indicators. For example, while blood pressure was unrelated to cynicism, the prospective effects of the lung function test and self–rated health status reached −0.129 and −0.114, respectively, representing substantial longitudinal effect sizes (Adachi & Willoughby, 2014). Given the large number of different health indicators and the fact that some of them were more strongly associated with cynicism than others, we assumed that the stronger a specific health indicator is related to perceived constraints, the stronger will be its prospective effect on cynicism. To test this assumption, we computed the association between each health indicator and perceived constraints. To increase the number of data points and account for potential variations within each type of health indicators, we considered all health items separately, resulting in 49 health indicators overall (9 chronic conditions, difficulties with 12 physical activities, 6 instrumental daily activities, 6 basic daily activities, 4 sensory problems, 7 physical measures and 1 indicator of self–rated hand strength, lung function, balance, subjective health status and experience of pain). For consistency reasons, we reverse–coded subjective health status, self–rated and measured hand strength, lung function and balance. In this way, higher values in all health indicators indicate poor health or health limitations. Therefore, stronger associations between health limitations and perceived constraints reflect a stronger degree to which each particular health limitation gives rise to a feeling of being constrained in one's daily life. The associations between health limitations and perceived constraints ranged between r = −.031 (diastolic blood pressure) and r = .326 (subjective health status). As shown in Figure 5, this variation nearly perfectly corresponded to the longitudinal effect of health limitations on cynicism [r = .665, N = 49, p < .001, 95% CI (0.47, 0.78)]. 5 In other words, a particular health limitation contributed to increased cynicism over time as long as it was associated with stronger perceived constraints. In contrast, health limitations that were not associated with perceived constraints were not associated with increased cynicism either (e.g. blood pressure). This effect persisted when adding all control variables [r = .587, N = 49, p < .001, 95% CI (0.37, 0.75)].
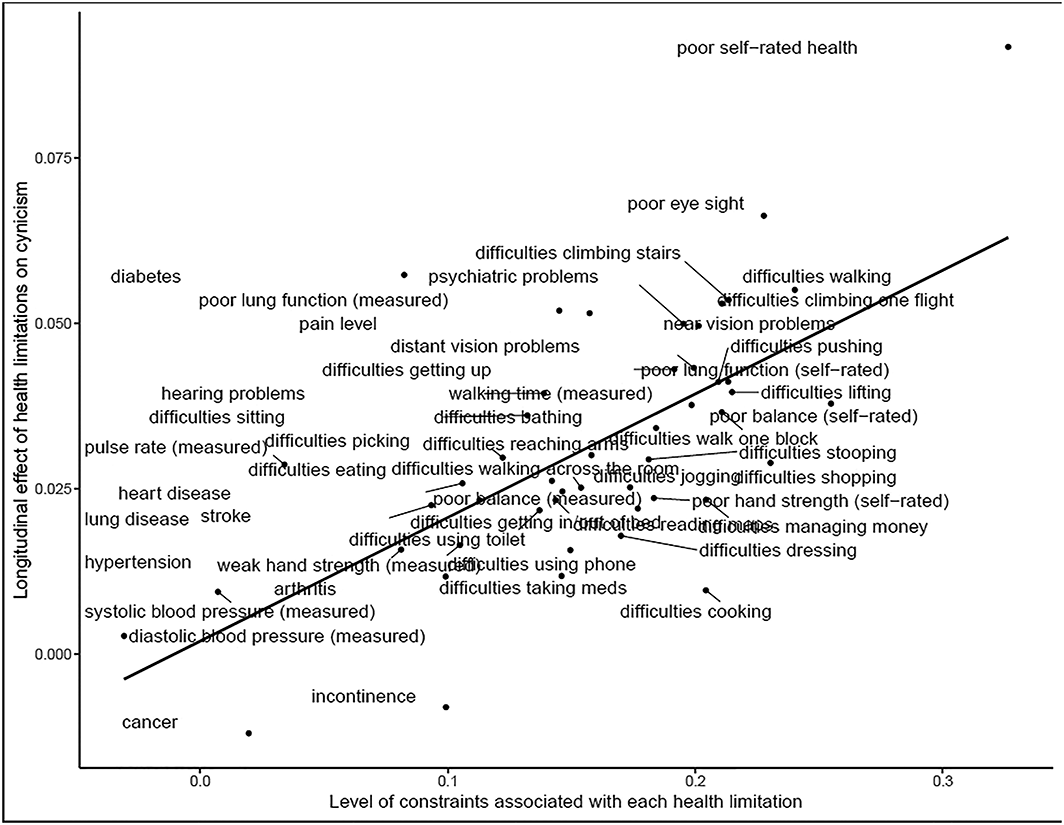
Longitudinal effect of health limitations on cynicism as a function of the degree to which each health limitation contributes to increased constraints (r = .67, N = 49, p < .001). X–axis: Association (r) between health limitations and perceived constraints; Y–axis: effect of health limitations at t1 on cynicism at t2 (β) while controlling for cynicism at 1.
Discussion
Supporting the results of Study 1, Study 2 showed that cynicism is not only a source but also a consequence of poor health. In fact, while the prospective effect of cynicism on health was partially due to an overlap with neuroticism and certain socio–demographic variables, the prospective effect of health on cynicism was more stable against these controls and more consistent across the numerous different health indicators. Not only self–reported but also physical indicators of poor health were associated with increased cynicism over time.
Study 2 further showed perceived constraints (but not mastery) to represent the potential mechanism underlying this effect. The prospective effect of poor health on cynicism was mediated by a sense of perceived constraints that some health limitations typically bring about. Importantly, the indirect effect via perceived constraints was independent from another typical consequence of poor physical health—depressive symptoms—that acted as another mediator of the association between health deterioration and a cynical worldview.
General Discussion
Existing literature has consistently shown cynicism to predict bad health outcomes and increased mortality risks (Boyle et al., 2007; Smigelskas et al., 2017; Smith et al., 2004). In fact, medical researchers proclaimed cynicism to be ‘one of the most widely studied psychosocial risk factors’ for morbidity and mortality (Smith et al., 2004, p. 1218) and a ‘key concept of behavioral medicine’ (Hakulinen et al., 2013, p. 2417).
Herein, we proposed that cynicism might be not only a source but also a consequence of poor health. Health deterioration inevitably leads to impairments and constraints in everyday life, increased dependence on others and a stinted sense of control over one's life (Drewelies et al., 2017; Infurna & Okun, 2015). A lack of control might activate self–protection strategies, including suspiciousness and hostility, contributing to the endorsement of a cynical worldview (Stavrova & Ehlebracht, 2018). Consistent with this reasoning, a series of cross–lagged path analyses (at both between–persons and within–persons levels) based on the data from a large nationally representative sample of German adults and another large sample of the American elderly demonstrated that poor health predicts a higher level of cynicism over time.
A longitudinal mediation analysis supported the personal control explanation of the health effect: declining health was associated with stronger perceived constraints, which in turn contributed to an increased cynicism over time. Interestingly, another facet of personal control—mastery—was not a significant mediator. While health deterioration was associated with both reduced mastery and higher perceived constraints, only the latter predicted cynicism over time. A similar pattern of results was reported in previous studies on personal control and cynicism (Stavrova & Ehlebracht, 2018). Consistent with these previous findings, we assumed that a feeling of being constrained by external factors, including other people, might be a particularly important source of feelings of vulnerability, effectively fuelling a cynical worldview. In contrast, a perceived lack of mastery might predominantly be attributed internally and result in blaming oneself rather than others. Overall, we hope that future studies will replicate this finding and provide a more fine–grained analysis of the different worldview consequences of mastery and perceived constraints.
Finally, including a competing mediator—depressive symptoms—showed that the indirect effect via perceived constraints was independent from the effect of depressive symptoms that physical health problems frequently lead to. In fact, depressive symptoms emerged as an equally robust mediator of the effect of physical health on cynicism. Although not central to the present research, this finding potentially points at the role of depressive symptoms as a source and not only a consequence (Chow & Roberts, 2014) of personality change and thus represents a potential contribution to the existing literature on the psychological consequences of depression, including the question of co–development of personality and psychopathology (Durbin & Hicks, 2014).
One of the strengths of the present investigation consists in the large number of health indicators we used, including self–reported health status, number of doctor–diagnosed diseases, functional limitations, sensory problems and even physical measures taken by trained personnel during the interview. The cross–lagged path analyses established nearly all these indicators as longitudinal predictors of cynicism. Yet, some types of health limitations were substantially more strongly associated with cynicism than others. Drawing from our findings on the role of perceived constraints as a mechanism of the effect of poor health on cynicism, we assumed that this variability might be explained by the different levels of constraints associated with different health limitations. Supporting this reasoning, a comparative analysis demonstrated that the longitudinal effect of any specific health limitation on cynicism depends on the degree to which this particular limitation puts constraints on an individual's life. Health limitations associated with a higher level of constraints (e.g. difficulties walking or poor vision) were more likely to contribute to a cynical worldview over time, while health problems that were somewhat impalpable (e.g. high blood pressure) were only weakly associated with constraints and did not lead to increased cynicism.
Interestingly, neither did baseline blood pressure predict follow–up cynicism nor did baseline cynicism predict increased blood pressure at a four–year follow–up. At first glance, this finding seems to be at odds with previous literature that established cynicism as a major risk factor for high blood pressure–related diseases (e.g. coronary artery disease; see Chida & Steptoe, 2009). We speculate that cynicism might be associated with higher blood pressure predominantly in specific situations. Indeed, according to the psychophysiological reactivity model (Williams, Barefoot, & Shekelle, 1985), cynical individuals display an elevated cardiovascular reactivity to interpersonal stressors, which ultimately puts them at risk for coronary heart disease (Brondolo et al., 2009; Gallo, Smith, & Kircher, 2000; Powch & Houston, 1996). The fact that the blood pressure was measured during the interview (which is unlikely to represent an interpersonal stressor for most people) might possibly explain why cynicism was unrelated to blood pressure in the present study.
While the prospective effect of declining health on cynicism turned out to be robust across different methods, samples and various indicators of health status, its effect size was (very) small. Yet, when evaluating the magnitude of this effect, it is important to point out that it reflects longitudinal rather than cross–sectional associations. Consequently, the relevance of these findings should not be assessed using standard rules of thumb. Given a strong temporal stability of both cynicism and health (r in the range of .40–.60) and a relatively large time lag between the measurement points (five and four years in Studies 1 and 2, respectively), even small longitudinal effects can be considered meaningful (Adachi & Willoughby, 2014; Dormann & Griffin, 2015). Importantly, the size of the association between health and cynicism in the present studies is comparable with the previously reported associations between health and neuroticism, a personality trait considered as one of the most important personality correlates of physical health (Smith, 2006). Finally, even effects that might be considered small at the individual level can have important consequences at the population level. For example, in Study 2, a 1 standard deviation decrease in an individual's subjective health is predicted to result in a 0.11 standard deviation increase in cynicism. Even though this seems negligible at the individual level, an increase in societal cynicism of this magnitude is associated with a $1500 smaller GDP per capita (calculated based on Stavrova & Ehlebracht, 2016).
Limitations and directions for future research
The present research has a number of strengths, including a longitudinal design with up to three measurement occasions spread across a total timespan of 10 years (Study 1), large representative samples (Study 1 and Study 2) and a large number of health measures, including both subjective and objective physical indicators (Study 2). Yet, it has a number of limitations as well. Most importantly, even though the use of longitudinal data allows us to make conclusions regarding the temporal precedence of declines in health and increases in cynicism, it does not allow us to make causal conclusions. For example, the association between poor health and cynicism might be explained by a negative response bias—a tendency to see everything in a dark light, both human nature and one's own health (Asch, 1958). However, as cynical individuals were not only more likely to report health problems but also to score lower on objective physical measures of health (e.g. lung function, timed walk test and balance test), we believe that even if cynical individuals tend to overstate their health limitations, this is very unlikely to fully explain our findings. Nevertheless, we admit that a more thorough causality investigation would advance our understanding of the worldview consequences of poor health. While experimental manipulations of poor health seem implausible, future studies might focus on testing/establishing the causality behind the effect of perceived constraints as a mechanism linking health deterioration and cynicism. In fact, experimental manipulations of perceived control are frequently reported in psychological literature (Stavrova & Meckel, 2017; Whitson & Galinsky, 2008) and might represent a promising tool for establishing the causal role of perceived constraints in cynicism development.
Besides experimental designs, using data with more than just two measurement occasions would allow for better tests of the mediation effects. The two–wave mediation analysis we used has two major limitations. First, it did not allow us to test what proportion of the total effect could be accounted for by the indirect effect (for details, see Cole & Maxwell, 2003). Second, it relies on the assumption of stationarity (i.e. the effects between t1 and t2 being the same as between t2 and t3, etc.), which cannot be tested with just two waves of data. Hence, we hope that future studies would resolve these issues by collecting multi–wave longitudinal data and using alternative analysis techniques (e.g. a parallel process latent growth modelling; Cheong, MacKinnon, & Khoo, 2003). Similarly, using the data with more than two measurement occasions would advance our understanding not only of the mediation processes but also of the trajectories of cynicism development in response to changes in health (e.g. using latent growth curve modelling). In fact, very little is currently known about the developmental changes in cynicism across the life span. Hence, using long–term panel data is particularly advisable in this context, as it would allow us not only to explore the developmental trajectories of cynicism as a function of health changes but also to compare it with those of more basic personality dimensions, such as agreeableness and neuroticism that have been in the focus of personality development literature so far (e.g. Kornadt et al., 2017).
In the present studies, we focused on establishing the effect of health decline on cynicism and perceived constraints as its mechanism. However, perceived constraints might represent a mechanism of the effect of cynicism on health decline as well: cynical individuals might be more likely to feel that their choices are constrained by others, and perceptions of constraints have been associated with health deterioration in prior studies (Infurna et al., 2011). An examination of perceived constraints as a mediator of the effect of cynicism on health might contribute to the extant literature on the mechanisms underlying the health consequences of cynicism, which so far include increased physiological reactivity to anger–inducing stimuli, poor relationships and unhealthy habits (for a review, see Smith, 1992).
By establishing a vicious cycle of poor health and cynicism, the present findings paint a rather gloomy picture. Plagued with pain and health–related constraints, individuals embrace a suspicious, cynical mindset, which brings about further health deterioration. This bleak view of cynicism is consistent with existing research that almost exclusively focused on depicting the negative consequences of cynicism, raising the question of whether cynicism has any beneficial effects at all. We speculate that there might be circumstances or social environments where endorsing a cynical worldview might in fact protect vulnerable individuals from incurring adverse social experiences. For example, cynicism might represent an adaptive strategy in particularly hostile social environments (Stavrova & Ehlebracht, 2016). In addition, consistent with the literature on person–environment fit (Curhan et al., 2014; Stavrova, 2015), cynicism might have beneficial (or at least, no adverse) consequences in cultures where it represents a widely shared, normative worldview. Hence, exploring the associations of cynicism and health across diverse cultural environments might represent a promising path for detecting possible adaptive effects of cynicism.
The vicious–circle findings raise the question of whether there is a ‘saturation point’ in the vicious cycle of health and cynicism. For example, similar to ‘decreasing marginal utility’ in an economic context, the adverse impact of any additional health problem might be declining with an overall increase in health problems. It is also noticeable that, in contrast to the effect of health on cynicism, the effect of cynicism on health appeared to be less robust against controlling for socio–demographic factors and individual differences in neuroticism. Potentially, individual differences in life circumstances or other personality dispositions might counteract cynicism development in response to health deterioration, ‘breaking’ the vicious cycle.
Given the importance of interpersonal relationships for psychological adjustment (Baumeister & Leary, 1995), high levels of social support might represent such a protective factor. Individuals embedded in strong supporting networks of family and friends might have an easier time coping with health setbacks without developing a cynical worldview. Similarly, high–quality institutional support provided by public or private healthcare organizations (high–quality and accessible healthcare systems, decent assisted living facilities and retirement homes) might prevent cynicism development in individuals stricken with poor health.
Also, given the role of religious and spiritual beliefs (Krause & Hayward, 2014) as well as beliefs in scientific–technological progress (Stavrova, Ehlebracht, & Fetchenhauer, 2016) as a source of personal control, future research might explore whether these beliefs can offset the effect of health problems on cynicism development. Finally, recent and future technological developments (e.g. prosthetics, virtual assistant technology and autonomous vehicles) might give individuals with impaired health a possibility to regain control over their life and thus represent another factor counteracting cynicism development. Overall, understanding the psychological consequences of health declines and establishing factors that can mitigate cynicism development in response to health deterioration seem to be of a particularly high importance in the ageing Western societies.
Supporting info item
Supporting info item, per2183-sup-0001-Data_S1 - Broken Bodies, Broken Spirits: How Poor Health Contributes to A Cynical Worldview
Supporting info item, per2183-sup-0001-Data_S1 for Broken Bodies, Broken Spirits: How Poor Health Contributes to A Cynical Worldview by Stavrova Olga, Ehlebracht Daniel and Laceulle Odilia in European Journal of Personality
Table S1: Measurement invariance analyses
Table S2: Cross-lagged models, multiple group comparison, Study 1
Table S3: Overview of model fit indices: Cross-lagged models, Study 2
Table S4: Overview of model fit indices: Mediation models, Study 2
Figure S1: Cross-lagged effects (unconstrained models), Study 1
Figure S2: Random-intercept cross-lagged panel model (unconstrained), Study 1
Supporting info item
Supporting info item, per2183-sup-0002-Open_Practices_Disclosure_Form - Broken Bodies, Broken Spirits: How Poor Health Contributes to A Cynical Worldview
Supporting info item, per2183-sup-0002-Open_Practices_Disclosure_Form for Broken Bodies, Broken Spirits: How Poor Health Contributes to A Cynical Worldview by Stavrova Olga, Ehlebracht Daniel and Laceulle Odilia in European Journal of Personality
Footnotes
Notes
References
Supplementary Material
Please find the following supplemental material available below.
For Open Access articles published under a Creative Commons License, all supplemental material carries the same license as the article it is associated with.
For non-Open Access articles published, all supplemental material carries a non-exclusive license, and permission requests for re-use of supplemental material or any part of supplemental material shall be sent directly to the copyright owner as specified in the copyright notice associated with the article.