Research article
 Restricted accessResearch articleFirst published 2006pp. 3-3

Select search scope: search across all journals or within the current journal


 Restricted accessResearch articleFirst published 2006pp. 3-3Restricted accessResearch articleFirst published 2006pp. 5-12
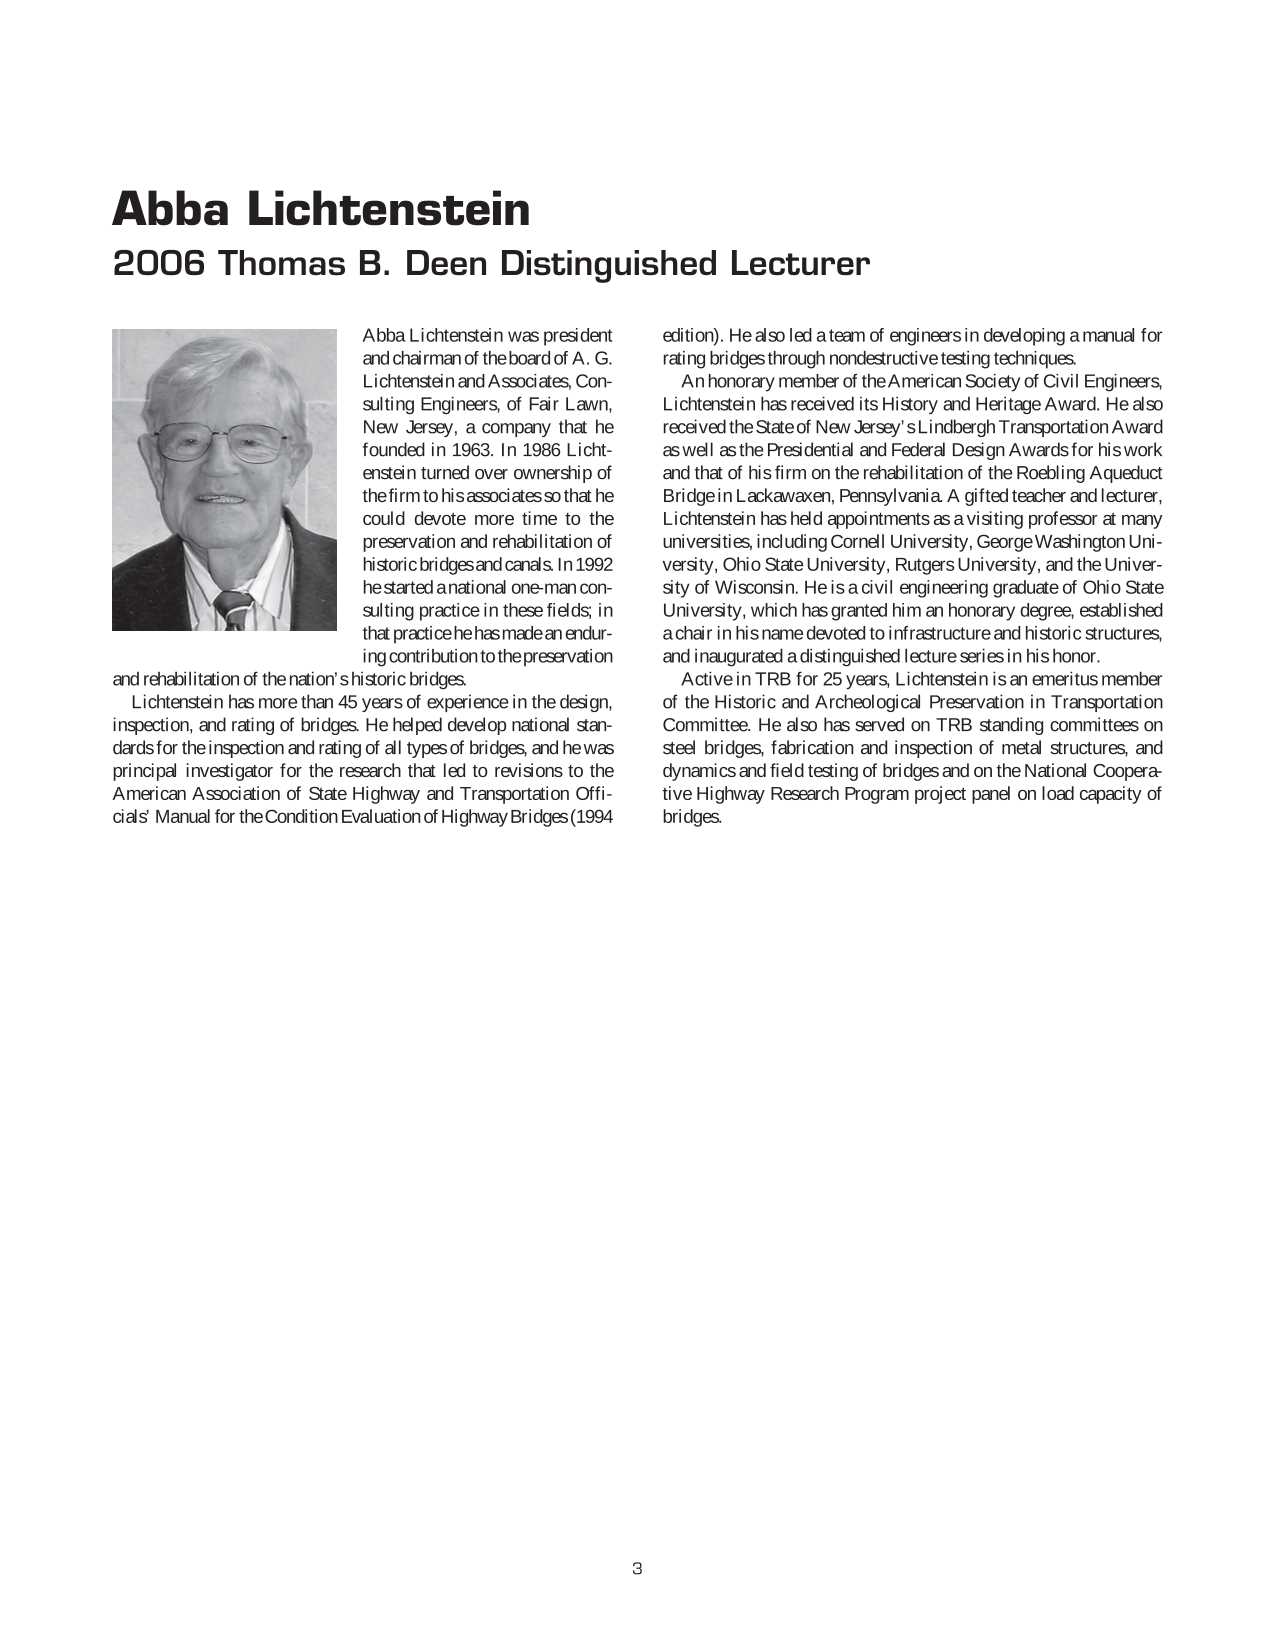
About 10,000 highway bridges in the United States qualify for inclusion on the National Register of Historic Places, but the path to preservation is full of obstacles, both political and financial. This lecture deals with highway bridges and aqueducts and includes photographs of the various projects discussed. It is hoped that no deserving historic facility will disappear without a public hearing and discussion.
Restricted accessResearch articleFirst published 2006pp. 9-9 Restricted accessResearch articleFirst published 2006pp. 14-23
Florida's Efficient Transportation Decision Making (ETDM) process, developed in response to the U.S. Congress Environmental Streamlining initiative, is a new way of accomplishing transportation planning to achieve early agency participation, efficient environmental review, and meaningful dispute resolution. ETDM is accomplished through the environmental screening tool (EST), a technological solution to integrate resource and project information from multiple sources, to provide quick and standardized analysis of environmental and sociocultural effects of proposed projects, and to support effective communication of results to all stakeholders, including the public. EST was developed through a methodology of rapid software prototyping, frequent user feedback, and flexible architecture designed to adapt to the ETDM evolution process. This development resulted in an Internet-accessible interactive database and mapping application that integrates a georelational database of ETDM projects, more than 200 environmental resource geographical information system data layers, automated and standardized GIS-based environmental screening analysis, and numerous data entry, review, and reporting tools. For more than 2 years of operation with a user community from seven Florida Department of Transportation districts, 26 metropolitan planning organizations, 24 resource agencies, and the public, EST has proved successful in supporting the ETDM process. More than 600 projects are in the EST database, and more than 160 of them have completed the environmental review process. Examples of many benefits of the EST in the ETDM process include early identification of avoidance or minimization options, improved interagency communication and coordination, and the use of EST for applications beyond the ETDM purview.
Restricted accessResearch articleFirst published 2006pp. 24-32This paper describes the application of geographic information system methodology in the appraisal—as an approach on a strategic scale—of the characteristics of a territory likely to be affected by new land transportation infrastructures across particularly sensitive areas. The chosen scope of study covers the Pyrenean region, which marks the border between France and Spain and is considered one of Europe's richest enclaves from an environmental viewpoint. The analysis focuses on the identification of areas where induced impact on the environment could be higher and therefore where focus should be placed on the assessment. This focus was made possible by the construction of an environmental quality map—through the integration of a number of theme maps for different environmental variables—covering the entire area under study. At the same time, a calculation model was built to determine the accessibility before and after construction of the proposed transportation infrastructures. The combination of accessibility and environmental quality maps provides useful results to improve the strategic environmental assessment process by incorporation of indirect effects. To discuss the likely implications of a rise in accessibility and as a test for the indicator used, an analysis of land use changes for the period from 1992 to 2004 has also been done for a smaller area where a motorway was built in the late 1990s; this analysis provides an idea of the potential development of the area and a good amount of data for discussion.
Restricted accessResearch articleFirst published 2006pp. 33-41Storm water quantity control has long been a challenge for highway designers. Traditionally, centralized best management practice designs are often cost prohibitive and inefficient in many rural highway applications. The use of existing vegetated rights-of-way as a method of treating storm water, a component of the broader storm water treatment concept more generally referred to as low-impact development, has become a primary focus of the Washington State Department of Transportation. To design and use such storm water management controls adequately, however, further research and correlation between numerical infiltration–runoff models and field experiments were needed. This paper focuses on evaluating natural dispersion performance through the use of simulated rainfall runoff data collected with a field-scale rainfall simulator and a numerical model to study the effects of slope length, angle, and impervious contributory area on natural dispersion applications. A simple new equation was developed to analyze natural dispersion performance on the basis of multiple variables. The research and resulting evaluation procedure indicated that the use of natural dispersion as a storm water quantity control strategy is applicable to many roadside areas in Washington State.
Restricted accessResearch articleFirst published 2006pp. 42-50Ground vibration induced by traffic, such as occurs on roads, highways, and railroads, may become a nuisance to nearby inhabitants and buildings. These problems have recently increased, especially in urban areas as higher environmental quality is required. Although many efforts have been made to mitigate ground vibration, in some cases, more powerful measures are needed. In this paper, a three-layered hybrid-type vibration isolation wall that uses gas cushions was developed. To confirm the vibration isolation performance of this wall, field experiments were conducted. Ground vibration generated by a mechanical oscillator was measured before and after the construction work at the same points. Ground deformation was also measured when the wall was built and when some cushions burst. It became clear from the measurements that the wall was as effective as open trenches, especially in lower frequencies such as 5 to 10 Hz. On the basis of the findings, vibration isolation effects are highly recommended.
Restricted accessResearch articleFirst published 2006pp. 51-58A portion of I-76 near Akron, Ohio, was reconstructed by the Ohio Department of Transportation with concrete pavement to replace the previous asphalt surface. During reconstruction, the concrete surface was textured with random transverse grooves. After construction, residents living in the project area as far as 800 m (2,600 ft) from the roadway perceived an undesirable increase in noise level, which they attributed to the new concrete pavement in the reconstruction project. Therefore, another project was initiated to retexture the pavement surface by diamond grinding. The transverse grooves were replaced with longitudinal grooves. Traffic noise measurements were made before and after grinding at five sites in the project area, at distances of 7.5 m (24.6 ft) and 15 m (49.2 ft) from the center of the near travel lane. The average reduction in the A-frequency–weighted broadband noise levels at 7.5 m (24.6 ft) was 3.5 dB, and the average reduction at 15m (49.2 ft) was 3.1 dB. Spectrum analysis showed that the greatest reduction in noise occurred at frequencies above 1 kHz and that the retexturing had little to no effect on frequencies less than 200 Hz.
Restricted accessResearch articleFirst published 2006pp. 59-66This paper explores analytical techniques to identify the environmental justice (EJ) population in a racially diverse area and to evaluate the benefits and burdens of transportation projects upon EJ and non-EJ populations. A statistical technique was developed to identify the block groups where minority and low-income populations were disproportionately concentrated, with variation in the size of the block groups taken into account. Four performance measures that represent the transportation benefits of and burdens on the identified EJ and non-EJ areas were determined to evaluate accessibility, mobility, safety, and equity. Specific questions and indexes for each performance measure were developed to define disproportionate impacts. To establish transportation projects’ connection with local communities, those projects were categorized and selected on the basis of their type in addition to their geographical location. The method developed for Oahu, Hawaii, is transferable to states, cities, and metropolitan areas throughout the United States.
Restricted accessResearch articleFirst published 2006pp. 67-74This paper aims at equity implications of transportation policies by using a range of equity measures in two case studies. Different measures of inequality embrace different normative judgments. Early studies have warned about placing too much trust in a single measure. One approach is to address equity considerations by assuming an explicit form of social welfare function and the choice of a desired inequality aversion parameter. A second approach is to apply an inequality measure to a given pair of distributions of a variable (e.g., income and accessibility) that changes as the result of a policy. The latter approach is adopted in this paper. A partial equilibrium model of transportation is used for the calculation of the changes in income, accessibility, and the net benefit for different social groups. This paper demonstrates the challenges that arise in addressing equity with a partial equilibrium model of transportation. An overview of some equity measures and their properties is provided first. The performances of these equity measures are evaluated for alternative road pricing schemes for Oslo, Norway. The paper illustrates that relating the equity objective to a predefined value of any of these measures is not desirable. It is difficult to make a judgment about the equity implication of a policy on the basis of a single measure and without a thorough examination of several measures. The paper also shows that the sizes of the equity measures are quite sensitive to the level of spatial disaggregation.
Restricted accessResearch articleFirst published 2006pp. 75-80Environmental justice (EJ) becomes a concern when minority or low-income communities (referred to as EJ populations) are disproportionately affected by transportation projects. The disproportionate impacts may relate to social, economic, or environmental burdens that EJ populations living in affected project areas will be forced to endure. An important component of any EJ assessment methodology is therefore the identification of EJ communities in a project area. The conventional approach classifies communities by means of threshold values into target and nontarget EJ populations. Research has demonstrated, however, that threshold values are largely influenced by the chosen community of comparison. In addition, the spatial distribution of target and nontarget EJ populations within the affected area changed when the scale of geographic analysis changed. Because it has been argued that effective EJ analysis should consider all minority and low-income population groups regardless of their size, this research presents an innovative approach to identify the concentration of EJ individuals in affected project areas. The approach consists of five steps. First, the spatial distribution of minority and low-income populations is estimated by means of census data at the block level. Second, local measures of spatial autocorrelation for EJ populations are computed for each census block. Third, the EJ concentration levels are conceptualized on the basis of spatial-cluster patterns. Fourth, the concentration levels of minority and low-income populations are combined into a single raster model. The outcome is a map in which each cell has a value that represents its concentration level. Finally, these values and specified spatial connectivity criteria are used to define EJ concentration zones. The objective of this paper is to describe the approach and to present the results from testing it.
Restricted accessResearch articleFirst published 2006pp. 81-90Traffic congestion continues to be a major concern for policy makers and transportation professionals in most large U.S. metropolitan regions. While demand for travel continues to increase, traditional sources of revenue used to finance transportation at the state and local levels are yielding fewer resources (or at least slowing in their rate of growth). As a result, transportation decision makers continue to seek new sources of revenue to finance expansive highway and transit plans. While much effort is expended in seeking adequate revenue sources, little effort is given to determining the equity effects of these new revenue sources, much less the policies they are designed to support. This paper investigates one particular aspect of equity, vertical equity, in relation to transportation finance and policy. Through the use of sets of data (travel demand, financial, and operational) from Minnesota and specifically from the Twin Cities region as illustrations, the authors argue that current policies toward transportation finance and congestion do little to further the interests of low-income individuals and may in fact benefit others at their expense. The authors conclude with some recommendations aimed at redistributing more equitably the burden of financing transportation programs among users and nonusers.
Restricted accessResearch articleFirst published 2006pp. 91-98This paper uses the recently published 2002 Vehicle Inventory and Use survey to determine the number of commercial trucks in the categories that are most likely to idle for periods of more than 0.5 h at a time. On the basis of estimated numbers of hours for both overnight idling by sleepers and long-duration idling by all size classes during their workdays, the total fuel use by idling trucks is estimated to be more than 2 billion gallons per year. Workday idling is determined to be a potentially much larger energy user than overnight idling, but data are required before any definitive conclusions can be reached. Existing technologies can reduce overnight idling, but development may be needed to reduce workday idling.
Restricted accessResearch articleFirst published 2006pp. 99-105The usefulness of the U.S. Environmental Protection Agency's (EPA) passenger car and light truck fuel economy estimates has been the subject of debate for the past three decades. For the labels on new vehicles and the fuel economy information given to the public, the EPA adjusts dynamometer test results downward by 10% for the city cycle and 22% for the highway cycle to better reflect real world driving conditions. These adjustment factors were developed in 1984 and their continued validity has repeatedly been questioned. In March 2005, the U.S. Department of Energy and EPA's fuel economy information website, www.fueleconomy.gov, began allowing users to voluntarily share fuel economy estimates. This paper presents an initial statistical analysis of more than 3,000 estimates submitted by website users. The analysis suggests two potentially important results: (
Restricted accessResearch articleFirst published 2006pp. 106-113Two factors are important for assessment of the fuel-saving potential of hybrid vehicles. First is the future market share, which depends on the present status of hybrid vehicles in the technology adoption life cycle. The latter can be assessed by examination of characteristics and preferences of hybrid vehicle buyers. Second is consumer behavior, with the key issue being whether the purchase of a new hybrid vehicle is related to above-trend increases in vehicle size or vehicle ownership. Two groups were surveyed: (
Restricted accessResearch articleFirst published 2006pp. 114-120As with the distribution of any commodity, distribution of hydrogen depends on how the hydrogen is packaged, how far it must travel, and how much must be delivered. Few would argue that transporting a high-pressure gas is markedly different from transporting a cryogenic liquid—or even a liquid at standard temperature and pressure. Packaging affects not only density (weight/volume) but also the operation of potential delivery modes and onboard storage, a problem that has been called the grand challenge of the hydrogen economy. These three factors—packaging (which in turn affects shipment size and modal attributes), delivery distance, and demand—affect both the structure of potential delivery systems and their contribution to unit costs. This paper describes the hydrogen delivery scenario analysis model, a generalized model of hydrogen delivery that can be used to analyze the economic feasibility of various options for hydrogen distribution to markets of different sizes and types. Inputs may be user defined, or default values developed for the U.S. Department of Energy's Hydrogen Analysis project may be used. This paper describes the model's structure and capabilities, presents initial results, and discusses ongoing enhancements.
Restricted accessResearch articleFirst published 2006pp. 121-128Station availability is a major concern when the deployment of an alternative fuel such as hydrogen is considered. Too few stations will make the network inconvenient, while too many will make the refueling network cost prohibitive. As a follow-up analysis to two station siting analyses completed by the authors for the California Hydrogen Highway Network, this report takes a closer look at the regional differences between the four main metropolitan areas in California: Greater Los Angeles, the San Francisco Bay Area, the Sacramento metropolitan area, and the San Diego metropolitan area. The purpose of this analysis is twofold: to generate a general model to assess hydrogen needs in different regions, and to apply the model to compare its results with the California hydrogen highways report. In the analysis that follows, average driving time to the nearest station (convenience metric) is used to determine the number of stations necessary for each region. By using convenience to determine the share of stations, regions that are less dense will be served as well as those regions with high density. The results suggest that the percentage of stations needed to meet a convenience target differs among regions depending on density. For example, a 4-min average travel time in Sacramento requires 7.2% of stations, whereas it requires only 3.3% of stations in Los Angeles. The developed equation predicts station needs as a function of population density and a desired level of convenience; if the caveats explained in the paper are observed, the prediction equation can be applied to any region.
Restricted accessResearch articleFirst published 2006pp. 129-139The U.S. government is carefully considering the merits and the long-term prospects of hydrogen-fueled vehicles. The National Academy of Sciences has called for the careful application of systems analysis tools to structure the complex assessment required. Others, raising cautionary notes, question whether a consistent and plausible transition to hydrogen light-duty vehicles can be identified and whether that transition would, on balance, be environmentally preferred. Modeling the market transition to hydrogen-powered vehicles is an inherently complex process encompassing hydrogen production, delivery and retailing, vehicle manufacturing, and vehicle choice and use. This paper describes the integration of key technological and market factors in a dynamic transition model, HyTrans. The usefulness of HyTrans and its predictions depends on three key factors: the validity of the economic theories that underpin the model, the authenticity with which the key processes are represented, and the accuracy of specific parameter values used in the process representations. The paper summarizes the theoretical basis of HyTrans and, with sensitivity analysis, highlights the implications of key parameter specifications.
Restricted accessResearch articleFirst published 2006pp. 140-150This paper provides an overview of recent developments in urban mobility and sustainability in Asia and highlights the significance of understanding the power of context when relevant policy and planning responses to urban transportation challenges are being formulated. The author argues that the challenge of how best to go about enhancing mobility and sustainability in today's urban Asia is clearly a strategic megaissue that requires a thorough appreciation of the dynamics and the influence of the context in which current Asian developments are taking place. Citing Naisbitt, the paper suggests that this is significant, for what is happening in Asia today is by far the most important current development in the world not only for Asians but for the entire planet. The author concludes by citing critical areas in need of research and claiming that the translation of the aims of the sustainable development vision into the urban transportation sector is one of the most problematic and challenging aspects of urban transportation strategy formulation—a task made more difficult by recent forces of globalization that actively encourage a departure from past practices of using transportation infrastructure to bind and unite cities and regions.
Restricted accessResearch articleFirst published 2006pp. 151-157Indicators of sustainability and environmental performance can be useful for comparing modes, discerning trends, and formulating appropriate policies. This paper considers the performance of U.S. transportation service sectors through use of 1992 and 1997 benchmark input–output models. Use of these models permits assessment of not only the direct performance of the sectors but also the supply chain impacts required for operation of the transportation sectors. Consideration of indirect impacts is critical for assessment of the overall costs and impacts of particular products or services. Six transportation service sectors (air, rail, water, truck, transit, and pipeline) are examined. Economic impact, energy, greenhouse gas emissions, and toxic emissions are examined. The transportation sectors use large amounts of energy, both in total and per dollar of output and on a per service basis. Pipeline and water transportation have particularly large energy requirements per dollar of output, likely reflecting higher energy intensity and lower labor intensity in these modes. Truck transportation is the most energy intensive of the freight transportation modes per ton-mile of service, but it has a trend toward greater energy efficiency. For greenhouse gas emissions, truck, water, and air transportation have the highest emissions per dollar of output. Water transportation freight rates are sufficiently low that emissions on a per ton-mile basis would be correspondingly low. Finally, the supply chain (indirect) toxic emissions per dollar of output are highest for rail and pipeline transportation. There is considerable work to be done to improve the overall sustainability of the different transportation modes.
Restricted accessResearch articleFirst published 2006pp. 158-166This paper assesses the possibility for changing urban development patterns to reduce transportation greenhouse gas (GHG) emissions. The analysis was carried out as part of a larger project exploring the possibility of using the clean development mechanism (CDM) to reduce transportation GHG emissions in Santiago, Chile. The paper provides an overview of the analytical approach, which includes an integrated travel demand model with sensitivity to mesolevel land use variations, a method to generate optimal land use scenarios that relate to emission reductions, and a process to estimate the level of subsidies needed to produce those land use scenarios. Limitations to the approach and suggestions for future research are discussed. The paper concludes with an assessment of the results in the face of the fairly strict requirements for project development and implementation implied by the CDM.
Restricted accessResearch articleFirst published 2006pp. 167-174Many urban developers recommend mixed land use to achieve urban sustainability. One primary reason is that mixed land use reduces trip generation by enhancing multipurpose and pass-by trips and contributing to development efficiency and environmental protection. This study empirically investigated the effect of mixed land use on trip generation by examining 187 traffic analysis zones in Taipei City, Taiwan. Excessive and intense mixed land use increases trip generation, whereas mixed land uses job–housing and retail–job to reduce trip generation. The retail–housing mix increases trip generation. On the basis of empirical findings, this study presents feasible strategies for both adjusting land use regulations and restraining trip generation to move Taipei City toward sustainability.
Restricted accessResearch articleFirst published 2006pp. 175-182In 2003, Oregon's legislature passed and funded a transportation initiative that provided $1.3 billion for a bridge repair and replacement program, tripling the Oregon Department of Transportation's (ODOT) construction funding. That same year, a governor's executive order directed ODOT to develop sustainability measures for that program. Therefore, ODOT requested the assistance of the state department of environmental quality (DEQ) in developing performance standards that ensure regulatory compliance and facilitate environmental stewardship. DEQ realized that the proposal could help it meet its agency goals, and the two agencies signed an agreement under which ODOT paid DEQ staff to help develop the performance standard and DEQ absorbed the costs of senior management review. The ODOT-DEQ team developed performance standards that provide consistent regulatory interpretations specific to bridge construction, promote reuse over virgin materials, provide materials handling and waste management guidance for common bridge materials, ensure contamination is identified before construction, and facilitate data sharing with DEQ. The team provides a hierarchy for waste management and materials procurement practices that encourages consideration of more environmentally beneficial options when those are technically and financially feasible. The development process has already had the benefit of improving interagency relationships. Implementation should also improve regulatory compliance, increase reuse and recycling, decrease land filling, and improve air quality, all without increasing overall project costs. Implementation may even reduce costs through decreased transportation, landfill fees, virgin materials costs, and time that would have been needed to negotiate alternative material uses and permits for each project.