
Abstract
Free and fair elections enable the nation's citizens to elect candidates whom they believe best represent their interests. When deciding who to vote for, individuals may consider a host of factors that ultimately improve their subjective well-being. Using data from the Gallup Sharecare Well-being Index (N = 3,208,924), we examined whether changes in subjective well-being predicted U.S. presidential, Senate, and House of Representatives election outcomes from 2010 to 2020. We tested this effect at county (n = 1,652–3,061), metropolitan statistical area (n = 191–363), state (n = 50), and district (n = 389–427) levels. Pre-registered multilevel models supported the notion that regions with growing discontent tended to have larger increases in non-incumbent vote shares. Establishing a link between subjective well-being and electoral outcomes has the potential to realign policymakers’ priorities with what truly matters to their constituents, thereby facilitating the promotion of population well-being.
Relevance Statement
Elections shape a country's political landscape. Our pre-registered study with 3.2 million U.S. participants found that declines in subjective well-being predicted a larger non-incumbent vote share in U.S. presidential, Senate, and House elections.
Key Insights
Subjective well-being predicts electoral outcomes. Regions with growing dissatisfaction tended to vote for non-incumbents. Effect sizes are comparable to battleground states’ vote margins. Supporting citizens' well-being is important to electoral success.
Keywords
Voters may use elections as an opportunity to express their sentiments about current affairs. Many studies have examined sociopolitical and economic factors that affect voting, but subjective well-being could be a more direct measure of the discontent that drives voters to vote for the non-incumbent—to vote for a change. Subjective well-being refers to the evaluative, affective, and eudaimonic dimensions of the quality of one's life (VanderWeele et al., 2020). The evaluative dimensions assess individuals’ global judgments of the quality of their lives including current and future life satisfaction, the latter of which will be referred to as hope. The affective dimensions include positive and negative affect, which describe the degree to which one experiences various positive and negative emotions. The eudaimonic dimension includes purpose, which refers to one's sense of fulfillment and meaning. Previous research has examined the link between subjective well-being and voting behaviour at individual (Ward et al., 2021) and regional levels of analysis (Herrin et al., 2018; Ward et al., 2021). The current study tested how changes in subjective well-being predicted changes in electoral outcomes at multiple regional levels, with the aim of looking at broader-scale changes. The regional-level focus is motivated partly because policymakers enact policies at the regional level, and their electoral success is determined by regional-level election outcomes. Due to concerns about the ecological fallacy (i.e., associations between variables may differ in both direction and magnitude depending on the level of analysis; Openshaw, 1984), our literature review focused on regional-level work. Based on the regional-level theory of ecological influence (Rentfrow, 2020), public policies that form part of our social environment can shape psychological processes. To the extent that public policies can impact people's well-being, citizens may vote based on how the current administration affected their well-being.
Past longitudinal studies found that declines in subjective well-being were associated with voting for non-incumbents in U.S. elections (Herrin et al., 2018; Ward et al., 2021). These exploratory studies provided key but tentative evidence that can be further replicated by confirmatory analyses (Wagenmakers et al., 2012). The existing longitudinal evidence focused on presidential elections (Herrin et al., 2018; Ward et al., 2021), with one cross-sectional study conducted in the House of Representatives election (Park & Peterson, 2019). Whether the findings are applicable to specific presidential candidates or broadly applicable across wider contexts remains an open question. The overarching goal of the current study is to perform a comprehensive set of confirmatory analyses that examine the link between subjective well-being and election outcomes across different election years, election types, and spatial levels. The contribution of our study is thus to provide a confirmatory test to the hypothesis that regional well-being predicts election outcomes, and to the extent that our pre-registered analyses replicate past findings, the totality of evidence would further strengthen the policy relevance of subjective well-being.
Method
The present study tested the hypothesis that declines in subjective well-being predict larger increases in the non-incumbent vote share in line with past work. Specifically, we pre-registered multilevel analyses of U.S. presidential, Senate, and House of Representatives races spanning 2010 to 2020 at county (n = 1,652–3,061), metropolitan statistical area (MSA; n = 191–363), state (n = 50), and district (n = 389–427) levels using cross-temporal well-being data from the Gallup Sharecare Well-being Index (which comprised survey data from 3,208,924 Americans). The study was preregistered on the Open Science Framework (see Supplementary Materials).
Data Sources
Gallup Sharecare Well-Being Index
Subjective well-being data came from the 2008–2020 Gallup Sharecare Well-being Index, collected by Gallup (2020). Data were collected based on probability sampling and contain nationally representative samples of 3,208,924 U.S. adults aged 18 and above. Herrin et al. (2018) and Ward et al. (2021) used data from 2009, 2012, and 2016.
Dave Leip's Atlas of U.S. Presidential Elections
In line with previous studies (Herrin et al., 2018; Ward et al., 2021), data on U.S. elections were retrieved from Dave Leip's Atlas of U.S. Presidential Elections (Leip, 2020). Data were gathered at the county, state, and district levels. To acquire MSA-level data, we aggregated the county-level data to the MSA level. House elections data were not available in 2018 and 2020, so we used publicly available data from GitHub (see Method S1).
We aggregated the data to regional levels (i.e., MSA, county, state, and district). We excluded regions that did not have election outcomes data. Detailed sample sizes for each election are in Tables 2 and S1. Our analyses of de-identified datasets do not fall under the scope of human subject research according to local research ethics regulations.
Multilevel Modeling & Multiple Regression for Election Types, Geographical Levels, and Well-Being Variables

Note. This table displays a selection of the regression coefficients and standard errors from a model that contains control variables. The full model with the regression coefficients for the control variables can be found in the extended supplement. Multilevel modeling analyses were conducted for the presidential and Senate elections; multiple regression analyses were conducted for the House of Representatives elections. Additional information about the four subjective well-being measures can be found in the Method.
*p < .05. **p < .01. ***p < .001.
Measures
Subjective Well-Being
We included measures of current life satisfaction, hope, positive affect, negative affect, and purpose. For life satisfaction, participants were asked to imagine where they stand on a ladder from 0 at the bottom (worst possible life) to 10 at the top (best possible life). For hope, a similar measure was used, but participants were asked where they expect to stand on the ladder in five years. Single-item measures of well-being were found to have high reliability (Lucas & Donnellan, 2012) and validity (Cheung & Lucas, 2014). For positive and negative affect, participants were asked whether they experienced various positive and negative emotions during a lot of the day yesterday with a binary response option of 0 (no) or 1 (yes). The specific emotions asked about changed periodically (see Table S2), and we conducted separate analyses for all available emotions (see the extended supplement) and the emotions consistently measured—the latter of which is presented in the results and Tables S3 to S11. Purpose was measured with two items on a 5-point scale, with higher values indicating greater purpose. We analyzed purpose on an exploratory basis due to sparse data availability from 2013 to 2019 (see Method S5).
Election Outcomes
Presidential elections occur every four years, Senate elections occur every two years with one-third of Senate positions up for election every six years, and House elections occur every two years. There are two senators per state, whereas the number of House representatives in each state is proportionate to the state's population. Election outcomes were assessed by the change in the two-party non-incumbent vote share, which refers to the percentage of votes obtained by the candidate(s) in the non-incumbent party (e.g., Democratic or Republican), or the party that was not elected to office or did not have the majority in the last election. In line with past work (Ward et al., 2021), we excluded data from third parties, only keeping data from Democratic and Republican candidates. For example, in the 2020 presidential election, the non-incumbent vote share was the Democratic vote share because the last elected president in 2016 was a Republican. For Senate and House elections, the non-incumbent is the party that was in the minority in the last election.
Control Variables
We controlled for a range of demographic and socioeconomic variables based on control variables used in prior work (Ward et al., 2021). Some covariates could not be located at certain spatial levels (see Method S1).
We also preregistered analyses with a measure of mental distress from the Behavioral Risk Factor Surveillance System for the presidential elections in metropolitan and micropolitan statistical areas (n = 1,494,708). The results were mixed (see Table S3 and Table S9).
Analytical Strategy
Analyses were conducted in R Version 4.0.5 (R Core Team, 2021). Scripts and materials can be accessed via the Supplementary Materials. We conducted a cross-temporal analysis and examined how changes in subjective well-being are linked to changes in voting outcomes. Specifically, we looked at the change in regional well-being from the first election year starting when the winner entered office (i.e., January to December) to the second election year just before the next election (i.e., January to October). We aggregated data to several geographical levels by time period to address concerns about whether the results may differ depending on the spatial level (Openshaw, 1984). For the presidential and Senate elections, data were aggregated to the MSA and county levels. For the House elections, data were aggregated to the state and district levels. When data were not available at one level of analysis, we used crosswalks files to re-aggregate the data. This resulted in a panel dataset, and multilevel models were conducted.
Multilevel Models
Due to the nested structure of the data with years (level-1) nested into regions (level-2), we first estimated an intraclass correlation with a random-intercept model. We then estimated multilevel models to examine whether changes in subjective well-being were associated with changes in the non-incumbent vote share, controlling for demographic and socioeconomic variables. Separate models were estimated by the election type and geographical level. All predictors were grand-mean-centered (see Method S2). All multilevel models were weighted by regional sample sizes from the Gallup Sharecare Well-being Index to ensure that regions with fewer participants and thus lower precision were weighted less heavily in the analyses. To handle missing data in the covariates, we completed multilevel multiple imputation. Five imputed datasets were generated for our main analyses, with 1,000 burn-in iterations separated by 1,000 iterations. Estimates from the imputed datasets were combined using Rubin's rule. The multilevel models for the House elections, however, estimated no clustering of the outcome at regional levels. Therefore, we re-estimated the models for House elections using multiple regressions.
We complemented the multilevel analyses with yearly analyses for each election type and geographical level, with and without covariates (see Tables S3–S8). As robustness checks, we also conducted analyses that operationalized changes in subjective well-being as differences across the two most recent terms (Ward et al., 2021) and that controlled for incumbent tenure (see Methods S6 and S7 of the extended Supplementary Materials, respectively), and the results were largely similar. Therefore, our results focused on the adjusted preregistered analyses.
Results
Table 1 displays the descriptive statistics for the presidential, Senate, and House elections.
Descriptive Statistics

Note. This table displays the means and standard deviations for the changes in the well-being variables, non-incumbent vote share, and covariates before mean-centering.
Table 2 summarizes the key results from multilevel modeling and multiple regression analyses. Standardized results can be found in Table S9. The evidence generally replicated prior work showing that declines in subjective well-being predict larger increases in the non-incumbent vote share.
Presidential Elections
County
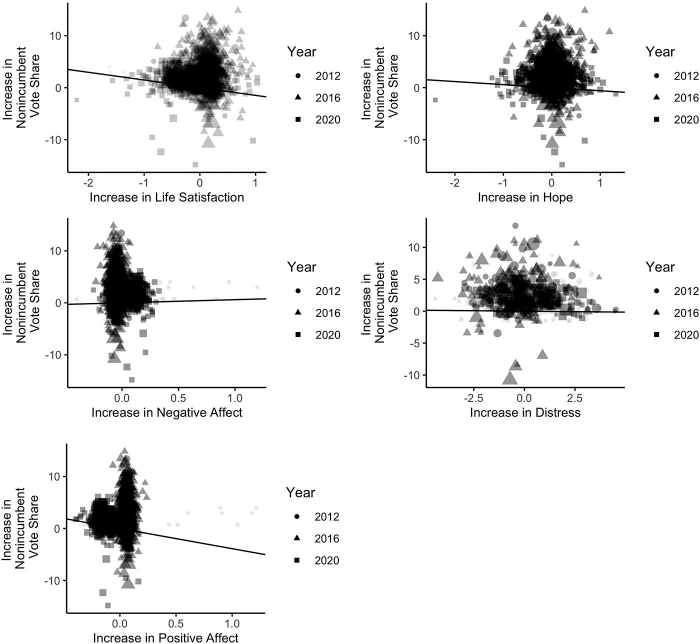
Multilevel models indicated that changes in life satisfaction, hope, and positive affect significantly predicted a greater non-incumbent vote share, in line with previous studies (see Figure 1). In particular, a 1-unit decrease in life satisfaction predicted a 0.49 percentage-point increase in the non-incumbent vote share, B = -0.49, p < .001, 95% CI [-0.66, -0.32]. Furthermore, a 10 percentage-point decrease in positive affect predicted a 0.17 percentage-point increase in the non-incumbent vote share, B = -1.72, p < .001, 95% CI [-2.64, -0.80].

Multilevel Modeling Plot for Presidential Elections (County)
Metropolitan Statistical Area
Consistent with prior work, changes in life satisfaction significantly predicted the non-incumbent vote share (see Figure 2). A 1-unit decrease in life satisfaction predicted a 1.48 percentage-point increase in the non-incumbent vote share, B = -1.48, p < .001, 95% CI [-2.35, -0.62]. The other results went in the expected directions but were not significant.
Multilevel Modeling Plot for Presidential Elections (MSA)
Senate Elections
County
Changes in life satisfaction, hope, positive affect, and negative affect significantly predicted non-incumbent vote share, replicating prior work (see Table 2 and Figure 3). A 1-unit decrease in life satisfaction predicted a 0.84 percentage-point increase in the non-incumbent vote share, B = -0.84, p < .001, 95% CI [-1.20, -0.48]. A 10 percentage-point decrease in positive affect predicted a 0.45 percentage-point increase in the non-incumbent vote share, B = -4.50, p < .001, 95% CI [-6.38, -2.62].
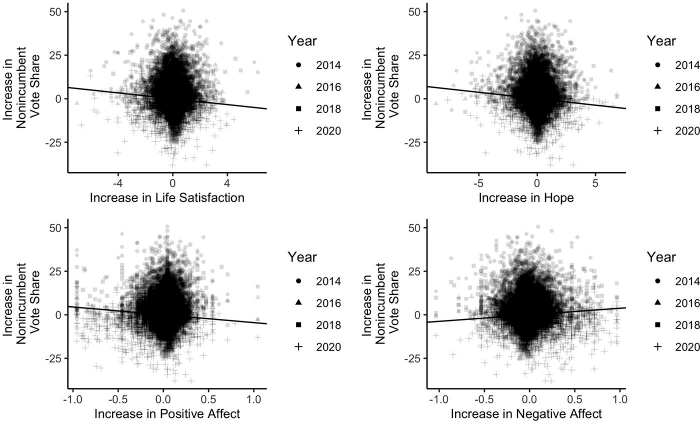
Multilevel Modeling Plot for Senate Elections (County)
Metropolitan Statistical Area
Changes in life satisfaction, hope, and positive affect did not significantly predict non-incumbent vote share, but the coefficients were consistent with the predicted direction (see Figure 4).
Multilevel Modeling Plot for Senate Elections (MSA)
House Elections
State
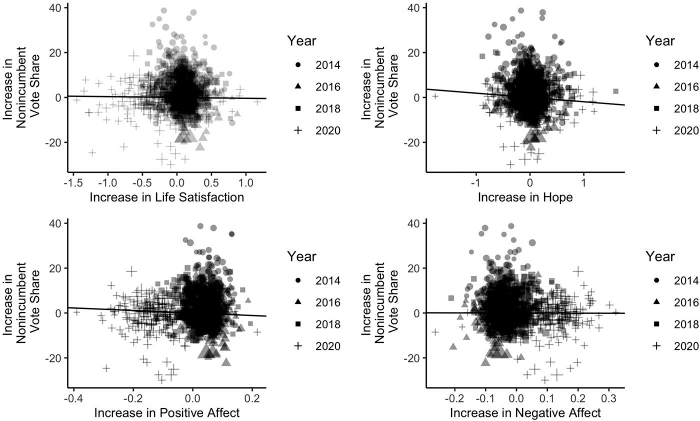
Multiple regression analyses indicated that changes in life satisfaction, hope, positive affect, and negative affect did not significantly predict non-incumbent vote share, but the coefficient for positive affect went in the anticipated direction (see Figure 5). A 10 percentage-point decrease in purpose significantly predicted a 4.51 percentage-point increase in the non-incumbent vote share, B = -45.07, p = .002, 95% CI [-73.42, -16.72].

Multiple Regression Plot for House Elections (State)
District
Changes in life satisfaction, hope, positive affect, and negative affect did not significantly predict non-incumbent vote share. Our exploratory analysis indicated that purpose did not significantly predict non-incumbent vote share, B = 3.03, p = .181, 95% CI [-1.41, 7.47].
Discussion
The current replication study tested whether regional shifts in subjective well-being over time predicted shifts in the non-incumbent vote share. Using aggregated data from the Gallup Sharecare Well-being Index, we examined this link in U.S. presidential, Senate, and House elections from 2010 to 2020 at several geographical levels. The pre-registered analyses largely confirmed prior work demonstrating that declines in subjective well-being tend to predict greater increases in the non-incumbent vote share.
Yet, the results showed heterogeneity when looking across different spatial levels. Whereas the associations were generally supported in the presidential and Senate elections at the county level, the associations tested at the MSA level went in the expected directions but were not statistically significant. This discrepancy potentially highlights the ecological fallacy (Openshaw, 1984). On one hand, the lack of significance at the MSA level may be attributed to a smaller sample size at the MSA level and thus lower statistical power. On the other hand, the inconsistent findings may be due to the strong urban-rural divide in political partisanship in the U.S. (Prewitt-Freilino et al., 2012). That is, because MSAs primarily consist of urban areas, the association between subjective well-being and election outcomes may be weaker because voters may vote along party lines in regions with strong political leanings.
The analyses on House elections produced mixed results, and some associations went in unexpected directions. This may be explained by the larger number of 435 candidates and the shorter terms for House elections of two years, thus contributing to greater heterogeneity among candidates and a shortened window in which subjective well-being could potentially alter one's vote. Future research should consider whether the characteristics of candidates (e.g., political leaning, voting record, tenure) moderate the results.
Modest changes in county-level subjective well-being could have flipped key swing states with small vote margins. In the 2020 presidential election, Georgia had a vote margin of 0.24%. If life satisfaction increased by 0.50 units, Trump may have had a larger vote margin than Biden in Georgia. Therefore, if our results are later verified as causal, subjective well-being plays a pivotal role in shaping election outcomes.
Population-Level Consequences of Subjective Well-Being
This study strengthens the literature that demonstrates how subjective well-being shapes policy-relevant outcomes. Past population-level research on intranational variability has linked subjective well-being to extraordinary altruism, as measured by the number of organ donations (Brethel-Haurwitz & Marsh, 2014) and population growth (Lucas, 2014). Therefore, to the extent that policymakers aim to lengthen their tenure and cultivate thriving communities, supporting citizens’ well-being is a pivotal step. Establishing a stronger link between subjective well-being and electoral outcomes has the potential to realign the priorities of policymakers with what truly matters to their constituents, thereby facilitating the promotion of population well-being.
Footnotes
This study draws on research supported by the Social Sciences and Humanities Research Council and the Canada Foundation for Innovation. This research was undertaken, in part, thanks to funding from the Canada Research Chairs Program.
Acknowledgments
This study draws on research supported by the Social Sciences and Humanities Research Council and the Canada Foundation for Innovation. This research was undertaken, in part, thanks to funding from the Canada Research Chairs Program. The data were drawn from the Gallup Sharecare Well-being Index, and the views expressed in this study are our own and do not reflect the views of Gallup.
Data Availability
The data that support the findings of this study are available from Gallup, but restrictions apply to the availability of these data, which were used under license for the current study. The data are not publicly available. Data are however available from the corresponding authors upon reasonable request and with permission of Gallup.
Supplementary Materials
The Supplementary Materials contain the standardized and unstandardized results from the multilevel models, multiple regressions, and year-to-year analyses using two different approaches. They also contain additional analyses, methodological details, figures, and scripts (for access see Index of Supplementary Materials below).
The authors have declared that no competing interests exist.