
Abstract
Statistics and math anxiety are pervasive problems for post-secondary students. We hypothesized that self-efficacy would be negatively related to math/statistics anxiety, and that anxiety sensitivity and perfectionism would be positively related to math/statistics anxiety, even when controlling for gender, university program, and education level. Method: Graduate and undergraduate students (N = 447, after exclusions) completed an online self-report questionnaire, including an abbreviated version of the Statistics Anxiety Rating Scale (STARS), math anxiety, self-efficacy, anxiety sensitivity, perfectionism, and demographics. Results: Exploratory factor analysis supported a six-factor structure for statistics anxiety. Self-efficacy was negatively associated with math/statistics anxiety, whereas anxiety sensitivity and perfectionism were positively associated with math/statistics anxiety. Relationships ranged from small-to-moderate, and most relationships persisted after adding covariates. Discussion: Our study suggests the feasibility of a short-form version of the STARS. Moreover, it provides important information on how personality is associated with domain-specific anxiety that can impede statistics education.
Relevance Statement
Statistics education has unique challenges, and many students experience a great deal of anxiety when faced with statistical concepts and mathematical calculations. Though a great deal of research has explored personality risk factors for generalized anxiety in clinical domains, comparatively few studies have examined the relationship between individual differences and domain-specific anxiety in statistics and mathematics classrooms. An interesting finding of the present research was that concern over mistakes and doubts about action (facets of perfectionism) predicted specific classroom-related fears (e.g., test anxiety), yet did not strongly relate to negative attitudes (e.g., attitudes about the value of statistics overall). Our approach applies common rigorous methods in personality science (e.g., basic psychometric soundness, quantitative analysis that accounts for familywise error rates, pre-registration, and open data) to a core topic of importance to educational research (i.e., classroom anxiety). We believe this cross-disciplinary approach is an important strength. Further, we believe that our research can open a dialogue about important personality variables that can impede learning in the classroom. In this way, we hope that our research can help teachers identify students in need of support by revealing personality variables that tend to co-occur with statistics anxiety.
Key Insights
A short-form statistics anxiety scale was found to have 6 factors. Perfectionism and anxiety sensitivity positively correlated with math and statistics anxiety. Self-efficacy negatively correlated with math and statistics anxiety. Results held when controlling for gender, university program, and education level.
Keywords
Anxiety is the leading mental health problem reported at universities today (LeViness et al., 2017).
Established risk factors for statistics anxiety include epistemological anxiety, mathematical self-concept, and self-esteem (Onwuegbuzie & Wilson, 2003). Problems with mathematical self-concept and self-worth are risk factors for math anxiety (Jameson & Fusco, 2014). While statistics and math anxieties are strongly correlated, they emerge as separate constructs in factor analysis, and differ insomuch that they are content-related anxieties experienced in different contexts with varying antecedents (Paechter et al., 2017). With the advent of computing, modern statistics education has moved away from a heavy focus on arithmetic and probability theory to greater emphasis on statistical thinking, conceptual understanding, interpretation, and technology use (GAISE College Report ASA Revision Committee, 2016). Onwuegbuzie & Wilson (2003) suggest statistics education (and the accompanying anxiety) often bears more in common with learning a new language than with math education. In this study, we examined protective and risk factors for statistics and math anxiety.
Protective and Risk Factors
S
We focus on two sub-dimensions of perfectionism from Frost et al. (1990):
A meta-analysis of 7 studies (
Multidimensionality of Statistics Anxiety
Statistics anxiety is a multifaceted construct that can be split into “anxiety” and “attitudes” towards statistics (Onwuegbuzie & Wilson, 2003). Three of Cruise et al.'s (1985) six factors tap this “anxiety” construct: test and class anxiety, interpretation anxiety, and fear of asking for help. In contrast, worth of statistics, fear of statistics teachers, and computational self-concept occupy the “attitudes” conceptual component of statistics anxiety. That is, attitudes about oneself or statistics as a discipline, rather than the emotional state of anxiety.
There is little research that specifically discusses self-efficacy, anxiety sensitivity, concern over mistakes and/or doubts about actions and their associations with Cruise et al.'s (1985) six statistics anxiety factors. Nonetheless, we might expect that anxiety sensitivity and perfectionism would be more strongly related to the three “anxiety” factors, given much research showing a positive correlation with these traits and generalized anxiety (Taylor et al., 2007; Walsh & Ugumba-Agwunobi, 2002).
Important Covariates
Students in arts programs experience higher levels of math anxiety relative to students in science programs (O'Leary et al., 2017). This anxiety might stem from fewer high school math requirements in arts programs, leading to anxiety from a lack of math training. Therefore, we will control for university program (arts vs. science vs. other).
Graduate students are more than six times as likely to experience mental health problems—including anxiety—than the general population (Evans et al., 2018). Given that statistics anxiety impacts students across education levels (Onwuegbuzie, 2000; Onwuegbuzie & Wilson, 2003) and may contribute to higher anxiety among graduate students, post-secondary students at undergraduate and graduate levels are our population of interest. These two samples—undergraduate vs. graduate—present a second covariate for our study.
Finally, women tend to score higher than men on traits corresponding with negative emotionality, such as neuroticism (Schmitt et al., 2008), and are almost twice as likely to be affected by anxiety disorders than men regardless of culture (Remes et al., 2016). Girls’ performance on math is more influenced by their math anxiety than boys; moreover, girls’ math performance is associated with their math anxiety, even after controlling for general test anxiety (Devine et al., 2012). Thus, gender is a third covariate.
Rationale
Statistics/math anxiety is an important topic to study because it has known negative effects on performance and engagement in statistics classrooms (Onwuegbuzie & Wilson, 2003). Moreover, anxiety is a naturally aversive state that most instructors would hope to minimize in their classroom to promote well-being in their students. Studying how personality is related to statistics anxiety may help us understand which students are at higher risk for statistics anxiety, to better inform future applied intervention research. There are numerous gaps in knowledge we attempted to fill. Undergraduate students are over-represented (Onwuegbuzie & Wilson, 2003), so we over-sampled graduate students. While studies have identified individual difference factors for math anxiety (e.g., nonverbal number skills; Ahmed et al., 2012), little research has tested the relationship between individual difference factors and statistics anxiety. Studies (e.g., Comerchero & Fortugno, 2013) tend to have small sample sizes (< 200), resulting in relatively imprecise estimates. That is, they could detect non-zero relationships, but precision of effect sizes tended to be low. To our knowledge, nobody has examined the link between anxiety sensitivity and math/statistics anxiety, despite well-known theory suggesting that anxiety sensitivity acts as an “intensifier” for anxiety (Taylor et al., 2007). Studies linking perfectionism to statistics anxiety (Onwuegbuzie & Daley, 1999; Walsh & Ugumba-Agwunobi, 2002), tended to focus on socially prescribed perfectionism—a useful measure, but not one that misses important features of perfectionism such as perseveration and concern over making mistakes. Prior research also tended to exclude important covariates. By using covariates, we can rule out alternative explanations for bivariate relationships that arise through potential confounds. Finally, the Statistics Anxiety Rating Scale (STARS; Cruise et al., 1985), is a burdensome measure with 51 items, which makes it difficult to incorporate into more rigorous methods such as daily diary research. Though it is not the primary focus of the study, we also tested the factor structure of a short-form version of the STARS.
Objectives
We examined self-efficacy, anxiety sensitivity, concern over mistakes, doubts about actions, and their relationship to math/statistics anxiety among post-secondary university students when controlling for degree programs, gender, and graduate student status. Our analysis plan and hypotheses were pre-registered (see Supplementary Materials).
Method
Power Analyses
Power analyses suggested that a sample size of 319 is sufficient to detect correlations of .20 or larger, assuming an alpha of .05 and 95% power. This effect size was estimated by averaging the relationships between all STARS subscales and facets of perfectionism across three studies (Comerchero & Fortugno, 2013; Onwuegbuzie & Daley, 1999; Walsh & Ugumba-Agwunobi, 2002). According to our preregistered plan, we decided a-priori to combine the SONA and Prolific samples, using sample as a covariate.
Participants
Participants were current undergraduate or graduate students recruited online. We collected data from two populations—undergraduate students at Dalhousie University through the SONA system (the online psychology participant pool), and graduate students from Prolific (an online survey company). Prolific participants sign up voluntarily for the website and it is advertised via word of mouth and social media. On January 13, 2022, there were 6768 graduate students in Prolific's pool, and the top 3 majors were Psychology (12%), Engineering (11%) and Computer Science (7%).
There were no inclusion or exclusion criteria for the SONA sample other than being a current undergraduate student at Dalhousie University. For the Prolific sample, current graduate students were eligible to participate. The SONA sample was recruited using ads posted online through Dalhousie University's Department of Psychology Participant Pool website. The Prolific sample was recruited using internal advertisement on the Prolific website. Only registered users on the Prolific website who met the screening criteria (current graduate students) could see the ad for the study.
Exclusions
Our initial sample consisted of 506 participants (
Sample Demographics
After exclusions, ages ranged from 16 years old to 53 years old ( Three participants’ gender were coded as “nonbinary”. To avoid excluding their data on equity/diversity grounds, each was arbitrarily assigned as “woman” for analyses involving gender, making the variable “man vs. not man”.
Materials
Screening
Prolific users were administered a screening survey when they first signed up as a participant with the service. Among other things, the survey asked users “Are you currently a student?” (yes/no) and “Which level of education are you currently in?” Only participants who answered “yes” to the student status question and one of “Graduate degree (MA/MSc/MPhil/other)” or “Doctorate degree (PhD/other)” were considered eligible for our study. The SONA participant pool comprised current undergraduate psychology students.
Baseline Demographics
Participants answered a demographics questionnaire following consent, asking about age, ethnicity, statistics course experience, education level, and university program (i.e., arts, science, other
2
In our original pre-registered plan, we were going to dichotomize programs into “arts vs. science.” However, many participants were in programs that did not cleanly fit into this dichotomy (e.g., Medicine, Engineering, Health). Thus, we added the “other” category, to avoid throwing out too much data.
Self-Efficacy
We measured self-efficacy with the 8-item New General Self-Efficacy Scale (NGSE; Chen et al., 2001). Participants responded on scale from 1 (strongly disagree) to 5 (strongly agree) on a timeframe of “the past year.” This scale demonstrates good alpha reliabilities when administered then re-administered (α = .85-.86; Chen et al., 2001), good test-retest reliability coefficients (
Anxiety Sensitivity
We measured anxiety sensitivity with the 18-item Anxiety Sensitivity Index-3 (ASI-3; Taylor et al., 2007). Participants responded using a 5-point scale 1 (very little) to 5 (very much) on their feelings “in general.” The ASI-3 has a hierarchical factor structure, with one higher-order factor and three lower-order factors (physical, cognitive, & social concerns; Kemper et al., 2012). We used the global total score rather than the three subscale scores, because (a) our hypotheses did not differ by subscale and (b) we wanted to reduce the overall number of statistical tests, and thus the familywise error rate. Internal consistencies tend to be strong for the total scores (α = .92; Kemper et al., 2012).
Perfectionism
Perfectionism was measured with short-form subscales from the Frost Multidimensional Perfectionism Scale (FMPS; Frost et al., 1990). We examined only the concern over mistakes (9 items) and doubts about actions (4 items) subscales. Participants responded on a scale from 1 (strongly disagree) to 5 (strongly agree) on a response scale “over the past several years.” Graham et al. (2010) provide evidence of their reliability and factorial validity.
Statistics Anxiety
The Statistics Anxiety Rating Scale (STARS; Cruise et al., 1985) was originally a 51-item questionnaire. To reduce participant burden, we used 16 of the 51 questionnaire items. We selected these items by examining the top two or three highest factor loadings on each subscale from validity data presented in Hanna et al. (2008). Participants answer items using a 5-point scale that measure statistics-related anxiety (Test and Class Anxiety, Interpretation Anxiety, and Fear of Asking for Help) and statistics-related feelings (Worth of Statistics, Fear of Statistics Teachers, and Computational Self-Concept). Each subscale has three items, except for the Fear of Asking for Help subscale, which has two items given low factor loadings (< .68; Hanna et al., 2008) and Computational Self-Concept, where one item (i.e., “
Factor Loadings for Abbreviated STARS

Math Anxiety
We measured math anxiety with the Abbreviated Math Anxiety Scale (AMAS; Hopko et al., 2003). The AMAS has 9 items, with participants indicating the amount of anxiety (from low anxiety to high anxiety) they would experience in the situations given. This scale demonstrates both good reliability for the global scale (α = .90) and good convergent/divergent validity (Hopko et al., 2003).
3
Our pre-registered plan indicated using a single total score for math anxiety. However, prior factor analytic work suggests a 2-factor model (i.e., learning and evaluation math anxiety), with two highly-correlated factors (
Bivariate and Adjusted Correlations Between Predictors and Outcomes
aPearson correlation coefficient. bConfidence interval. c
*
Procedure
The study was reviewed by Dalhousie University's Social Sciences and Humanities Research Ethics Board (#2020-5290). Participants were compensated with 0.5 credit points towards an eligible course (SONA) or £2.50 (Prolific). SONA participants could indicate “observer” status, meaning they may complete the study and receive compensation, but we would destroy their data and not use it for research. All questions had a “prefer not to answer” option, which was counted as missing data. After reading a consent form, participants took part in a cross-sectional survey using SurveyMonkey, where they answered each of the questionnaires specified above. Completing questionnaires took ∼20 minutes. Upon completion, participants were debriefed and compensated.
Transparency, Openness, and Reproducibility
Our confirmatory hypotheses and data analyses were pre-registered, with a time-stamped plan located in the Pre-registration. The cleaned data in .csv format are openly available in the Supplementary Materials. The raw data contains sensitive personal information, such as IP addresses; thus, this data cannot be made publicly available due to ethical concerns. There are a few other measures (two perfectionism measures; demographics) included that did not involve pre-registered hypotheses and are not presented in this paper. A full list of item wording for all measures can be found in the codebook: https://osf.io/zh5ab
Scripts used for our primary data analyses can be located in the Supplementary Materials in the “Core Data Analysis” folder. Users must install the statistical analysis software R (https://www.r-project.org/) to run these scripts. Supplementary analyses and data visualization are located in the Supplementary Materials in the “Supplementary Analysis” folder. These data have not been published elsewhere outside of an honours thesis by the 1st author.
Results
Exploratory Factor Analysis
We conducted an exploratory factor analysis on the abbreviated STARS. We used maximum likelihood estimation for the extraction of factors, oblimin rotation
4
We prefer an oblimin rotation to a varimax rotation because factor analysis data we relied on when selecting the highest factor loadings for the short form scale indicated correlated factors (Hanna et al., 2008) and because we do not believe that STARS subscales are orthogonal.
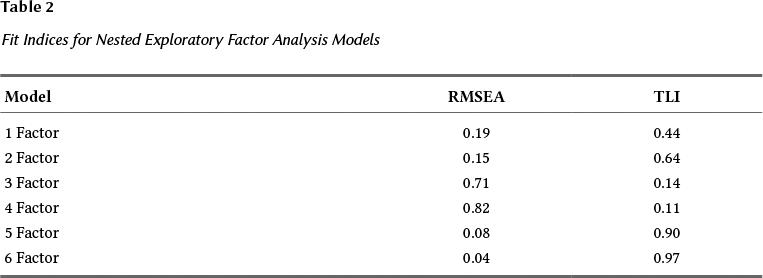
Parallel analysis suggested six factors; according to our preregistered plan, this was the decision criterion for determining the number of factors to retain. The abbreviated STARS follows the six-factor structure of Cruise et al.'s (1985) original scale. Six factors accounted for ∼66.8% of the variance, with factors contributing to the cumulative variance explained as follows: Worth of statistics (12.81%), test and class anxiety (12.15%) computational self-concept (11.4%), fear of asking for help (10.49%), fear of statistics teachers (10.34%), and interpretation anxiety (9.64%). Examining model fit indices also suggested that the 6-factor model fit best (Table 2). Factor loadings above .40 were considered substantial (Stevens, 1992). Each item surpassed the .40 threshold except Item 3, although we deemed it close enough (.37) to the threshold to be worth keeping.
Fit Indices for Nested Exploratory Factor Analysis Models

Descriptives
Figure 1 below presents plots of the raw data with means indicated as dotted red lines for averaged total scores. Given that all measures could theoretically range from 1–5, most means were towards the middle of the possible response scale. Some notable exceptions are self-efficacy, which tended to be high for most participants, and the attitude factors of statistics anxiety, which were more infrequently endorsed. The density plots often approximated normal distributions, though the three “attitudes” factors for statistics anxiety tended to be positively skewed and the test and class anxiety was negatively skewed.

Density Plots, Means, and Cronbach's Alpha Values
Confirmatory Hypothesis Tests
We calculated Pearson correlations between our predictors and math/statistics anxiety measures. Afterward, we controlled for gender, university program, and education level/sample (i.e., SONA/undergraduate vs. Prolific/graduate) by including these three variables as covariates in multiple regression. We adjusted
Prior to adjustment for covariates, self-efficacy was significantly negatively correlated with math anxiety and all statistics anxiety subscales except for worth of statistics. After controlling for gender, university program, and education level/sample (i.e., SONA vs. Prolific), self-efficacy's relationships became non-significant with test and class anxiety (pholm = .093) and fear of statistics teachers (pholm = .086); however, the other relationships remained statistically significant with mostly similar effect sizes. Effect sizes ranged from -.12 to -.29 in bivariate correlations and from -.09 to -.24 after adding covariates.
Anxiety sensitivity was positively correlated with math anxiety and each statistics anxiety subscale except for worth of statistics (pholm = .08). Relationships remained statistically significant after controlling for gender, university program, and education level. Effect sizes ranged from .11 to .35 in both the bivariate correlations and after adding covariates.
The pattern for both perfectionism variables was similar. Both concern over mistakes and doubts about actions were positively correlated with math anxiety and 4 of 6 statistics anxiety subscales before and after adding covariates. Standardized regression coefficients adjusting for covariates ranged from .05 to .36 for concern over mistakes and from -.01 to .35 for doubts about actions.
Exploratory Analyses
Supplementary relationships between covariates and math/statistics anxiety and data visualizations are located in the Supplementary Materials. Broadly, these show that gender (i.e., being a woman) was positively associated with math/statistics anxiety (significant
Discussion
We generally found support for our hypotheses: Self-efficacy, anxiety sensitivity, and perfectionism were correlated with both statistics/math anxiety. The strongest relationships tended to be with items conceptually related to anxiety. The weakest relationships tended to be with the worth of statistics and fear of statistics subscales. These subscales tended to include items that lacked an anxious affect component (e.g.,
Effect sizes for self-efficacy's significant relationships to math/statistics anxiety ranged from -.09 to -.24 after covariate adjustment, and there were non-significant associations with the test and class anxiety, worth of statistics, and fear of statistics teachers subscales. Self-efficacy may correlate more strongly with depression than with anxiety or attitudes towards statistics. Interventions that focus on developing and maintaining self-efficacy might modestly protect against at-risk students’ math/statistics anxiety, but the small relationships suggest relying on self-efficacy interventions alone would be insufficient.
As in many other domains (Taylor et al., 2007), anxiety sensitivity was positively associated with statistics anxiety. When students experience anxiety in the classroom (e.g., a difficult exam), over-focus on the physical, social, and cognitive features of their own anxiety can send students into a spiral of increasing anxiety. For such students, it may help to teach simple re-focusing techniques such as box breathing (i.e., slow deliberate breathing strategies to reduce anxious arousal).
The two dimensions of self-critical perfectionism we measured (i.e., doubts about actions, concern over mistakes) showed a similar pattern. Both dimensions positively correlated with math anxiety, test and class anxiety, interpretation anxiety, and fear of asking for help and computational self-concept but generally did not associate with the factors more closely associated with attitudes towards statistics (i.e., the remaining two STARS factors). Self-critical perfectionists may experience anxiety towards statistics, but not necessarily negative feelings towards statistics as a discipline. The correlations with statistics anxiety are consistent with prior studies (Comerchero & Fortugno, 2013; Onwuegbuzie & Daley, 1999; Walsh & Ugumba-Agwunobi, 2002), and we expand on that evidence by establishing that these associations persist when accounting for gender, university program, and education level. Assisting students with perfectionistic tendencies might lead to reduced math anxiety and fear of statistics-related tasks, which could improve math/statistics performance.
None of our predictors were significantly correlated with the worth of statistics subscale. Though anxiety sensitivity was the only predictor we examined that was significantly related to fear of statistics teachers after covariate adjustment, its effect size was very close in magnitude to self-efficacy (-.13 vs. .14). Thus, the results for this measure provide only weak evidence of a relationship. The item wording for the fear of statistics teachers subscale focuses on perceptions of how confusing instructors are, rather than fear, so the weak evidence may be because this subscale lacks content validity.
Exploratory analyses suggest that students in arts programs have higher statistics anxiety, consistent with humanities students having a higher aversion towards math than science students (O'Leary et al., 2017). Women had slightly higher levels of statistics anxiety than men, consistent with research on clinical anxiety symptoms (Remes et al., 2016). Though we initially thought graduate students would have higher levels of statistics anxiety than undergraduates given higher rates of mental illness (Evans et al., 2018), we instead found that graduate students had lower levels of statistics anxiety. This could be due to greater experience, higher average cognitive ability, or simply an artifact of a more culturally diverse sample collected through Prolific. Collectively, these findings call to attention the need for educators to be mindful of equity and individual differences in student populations.
Constraints on Generality
These results should reasonably generalize to other university students in comparable universities with undergraduate or graduate programs; however, it should be noted that these samples are not representative nor randomly sampled. Procedures are straightforward, and unlikely to vary if changed from online to pen-and-paper. We do not necessarily expect generalization to other perfectionism subscales (e.g., other-oriented perfectionism). We do not expect results for self-efficacy to apply across every type of domain-specific self-efficacy (e.g., physical self-efficacy). However, results do appear to generalize across two quantitative domains (math and statistics). Results are likely contingent on the content of introductory statistics curriculums at this point in history.
Within McAdams and Pals’ (2006) framework, perfectionism, anxiety sensitivity and self-efficacy might be thought of as dispositional traits—broad, stable characteristics that cut across multiple domains. In contrast, statistics/math anxiety are characteristic adaptations—contextualized within a specific time, place and social role. An important constraint on the generality of these results is that we do not measure domain-specific variations of personality (e.g., measures modified to be statistics-classroom specific) nor do we measure generalized trait anxiety or neuroticism. Without measurement of personality and anxiety at multiple levels (e.g., traits and characteristic adaptations) it is more difficult to disentangle the domain-specific and generalized relationships between variables, though we expect that statistics anxiety is distinct from generalized trait anxiety (Papousek et al., 2012). The largest relationships are likely when all measures are domain-specific.
Limitations
Further research on math/statistics anxiety protective and risk factors with a broader undergraduate sample can add to this study's findings. The cross-sectional design of our study means we are examining behaviours and feelings at a specific time. Thus, findings may not represent individuals’ true feelings over time. Conducting cross-sectional correlational analyses, while able to establish the presence of relationships, means we cannot infer causality. Future research might use longitudinal methods.
While our study provides useful psychometric data for an abbreviated version of the STARS, we inadvertently excluded an item on the computational self-concept subscale because of an administrative error. With only two items, findings for computational self-concept are less trustworthy. Selecting the top three factor loadings from Hanna et al. (2008) is a somewhat arbitrary selection criteria for item inclusion in a short form. Future research might apply statistical methods to test for pairwise differences between factor loadings to select items for the short form in a less arbitrary way. In addition, some elements of the STARS may be considered outdated (e.g., specifying anxiety towards statistics printouts), and future studies could explore developing a more contemporary version of the scale to possibly improve external validity. Future research might also investigate whether the lower levels of statistics anxiety in graduate student samples are due to higher average cognitive ability, graduate school selection processes, or merely an artifact of a more culturally diverse graduate student sample. Finally, Prolific uses an online crowdsourcing approach. Potential biases include (a) rapid-responder biases, since study slots are filled first-come first-serve; (b) sampling bias towards young, educated women; and (c) selection biases, since studies must compete for attention with a list of other studies which could be differentially appealing (Prolific, 2022).
Conclusion
Not all students are the same—they differ in experience, demographic characteristics, and personality. We found that individual differences in students predicted variation in statistics/math anxiety. Self-efficacy was modestly correlated with anxiety in the statistics classroom; as students’ self-confidence increases, their anxiety tends to decrease. Anxiety sensitivity intensified statistics anxiety through over-focus on the physical, cognitive, and social symptoms of anxiety. The perfectionism facets we studied focus on rigid black and white thinking (concern over mistakes) and perseveration (doubts about actions). Statistics education inevitably results in mistakes and uncertainty—which can be intolerable for perfectionistic people, resulting in greater anxiety. Demographically, women who are undergraduates in arts programs tended to experience the most fear in statistics classrooms. Nonetheless, the results for personality also held after controlling for gender, program, and graduate student status. Overall, our research suggests the importance of considering the unique personality and individual differences of our student population when teaching.
Footnotes
Acknowledgments
Shazia Kashif is thanked for her research assistance with some of the data analysis.
Research funded by a 2020 Social Sciences and Humanities Explore Grant (internal grant at Dalhousie University). This work was supported by a Social Sciences and Humanities Research Council Explore Grant [#39167], Halifax, Nova Scotia.
Ethics Statement
This study was reviewed by the Social Sciences and Humanities Research Ethics Board at Dalhousie University (REB# 2020-5290).
Other Manuscript Versions
This paper was modified from Nicholas McCaughey's honours thesis, which had the same title “The Association of Self-Efficacy, Anxiety Sensitivity, and Self-Critical Perfectionism with Statistics and Math Anxiety.” The honours thesis was not published and served as the first draft of the present manuscript.
Data Availability
For this article, data is freely available (McCaughey et al., 2021b)
Supplementary Materials
For this article, the following Supplementary Materials are available (for access see Index of Supplementary Materials below):
The authors have declared that no competing interests exist.