
Abstract
Autonomous robots can initiate their mission plans only after gathering sufficient information about the environment. Therefore reliable perception information plays a major role in the overall success of an autonomous robot. The Hidden Markov Model based post-perception filtering module proposed in this paper aims to identify and remove spurious perception information in a given perception sequence using the generic meta-pose definition. This method allows representing uncertainty in more abstract terms compared to the common physical representations. Our experiments with the four legged AIBO robot indicated that the proposed module improved perception and localization performance significantly.
Introduction
High level planning modules of autonomous robots have to rely on the perception capabilities to make sensible decisions. Without consistent perception information, autonomous robots cannot act at all since available information can never be precise enough to allow accomplishing any goals in dynamic environments.
A specific instance of this problem may be found in the Standard Platform League (SPL) (www.tzi.de/spl) of the RoboCup organization (www.robocup.org). In SPL, robots are only equipped with a monocular color camera with limited field of view. In addition to this limited perception capability, onboard computing power is also a limiting factor in the robots' performance. Together these factors increase the overall uncertainty and pose many challenges to researchers.
In SPL, teams of autonomous robots play soccer without obtaining any external help from human operators or an overhead camera. The robots typically use visually perceived landmarks, such as goal posts, beacons and corners formed by white field lines to locate themselves on the field shown on Figure 1.
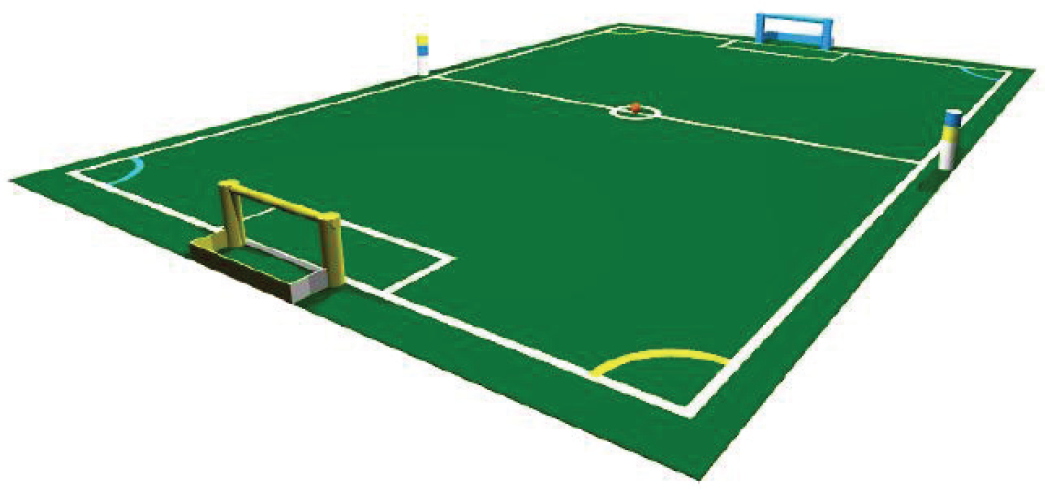
Official 2008 SPL field
Figure 2 shows a diagram of the core software modules commonly used by SPL teams. The visual perception module generates perception information from the images received by the camera. Next the localization module locates the robot on the field and stores its findings in a global memory location. Given the current world model, the planner module generates a decision, which is carried out by lower level control algorithms.

Commonly used robot software modules
The planning modules of the robots can generate the most robust decisions only after obtaining consistent low level perception information. When the information generated by the perception module is spurious, localization precision degenerates condemning the planning module to generate only suboptimal plans.
Most SPL teams (Chown, C. et al., 2008) (Akin, H. L. et al., 2008) (Stone, P.; Hester, T & Quinlan, M. 2008) (Röfer, T. et al., 2009) have used heuristic approaches to filter out the spurious landmarks, including sanity checks for size and dimensions of perceived objects.
This work proposes a novel probabilistic visual filtering technique based on the Hidden Markov Model infrastructure to remove any spurious or unexpected perception information. Using the proposed method it is possible to develop a prior belief over the visual state space of an autonomous soccer robot. Using this prior estimate, the robot can distinguish between correct and spurious perception information without utilizing any manually coded sanity checking algorithms. This filter can be implemented as a post perception module as shown in Fig. 2.
The rest of this paper is organized as follows. Some background information on current visual perception filtering techniques is provided in Section 2, followed by the detailed explanation of the proposed method in Section 3. Real world experiment results are presented in Section 4 and Section 5. Finally Section 6 concludes with an overview of the findings and some ideas for further studies.
Most SPL teams have employed heuristic approaches (Chown, C. et al., 2008) to filter out spurious landmarks, including sanity checks for size and dimensions of perceived objects. For instance, Cerberus Team (Akin, H. L. et al., 2008) has used a ball perception module solely based on sanity checks. In this approach, it is not possible to handle all possible cases, since maintaining such a large set of constraints is a tough programming task. Furthermore such a module is not general at all, even slightest alteration in the environment (e.g. changing the size of the ball) is sufficient for the module to fail completely.
Some sanity checks have used more elaborate heuristics than simple size or ratio based checks. Using the internal sensors of the robot, it is possible to design heuristic sanity checking algorithms which take into account the robot's current physical posture (Stone, P.; Hester, T & Quinlan, M. 2008). For instance Cerberus Team (Akin, H. L. et al., 2008) has implemented a flying ball sanity check, which projects the candidate ball perceptions onto the ground plane using a camera matrix transformation calculated using the robot's internal sensors. In fact some teams only rely in the projected values for distance perception of objects (Stone, P.; Hester, T & Quinlan, M. 2008).
Similarly, B-Human Team of SPL has used projected lines to block out the robot's own view in the image input (Röfer, T. et al., 2009). The perception module does not process regions marked with these lines, hence any misperceptions that could occur in these regions are eliminated. In addition visual processing takes less processing time since only a smaller region of the image is processed.
All of these heuristic solutions are aimed at removing spurious perceptions. However, such hand coded approaches can never guarantee completeness due to the immense size of the input space. Consider a pixel on an image, which can display 2563 different values in the commonly used RGB color model. If the image has 320times240 of these pixels, then there are (2563)(320 * 240) = 3.07 × 10554,858 possible numerically distinct images. Enumerating through the possible images to test the heuristic methods is a non-trivial task. Consider the next available higher resolution (2563)(640 * 480) = 8.95 * 102,219,433, which shows that enumeration is quickly out of question as the resolution increases. In fact, there are methods to reduce the size of the space by using a classification step (Akin, H. L. et al., 2008), which can reduce the number of possible colors in a pixel from 2563 to around 10. As a result, we end up with (103)(320 * 240) = 1 * 1076,800 distinct states to check, and further methods might be introduced to provide even more reduction. However, all of these reductions will introduce numerous assumptions with side effects involving systematic errors. For instance, if the classification method is not working as expected due to lighting conditions then the colors may be misperceived leading to another kind of perception problem.
Proposed method
Typically perception capabilities of an agent are expected to increase as the amount of perception data received increases. However there is no free lunch in perception processing as in any other processing system. As the perception capabilities increase, processing power requirements also require an increase, which might not always be available due to the limitations of mobile robotics platforms. One of the best ways of handling large amounts of data with limited processing power is to employ probabilistic methods (Fox, D.; Thrun, S. & Burgard, W., 2005). The visual perception filtering is an instance of such problems: there are large amounts of data coming from a very large visual state space that needs to be processed and the processing cycle is expected to be at most in the order of tens of milliseconds on a limited mobile platform.
In this section the underlying probabilistic framework is first described briefly. Next a description of the proposed method is provided in accordance with the probabilistic framework.
Probabilistic Infrastructure
Hidden Markov Model (HMM) (Alpaydin, E., 2004) (Cemgil, A. T., 2008) is essentially a probabilistic filtering method, which can be used to track various possible paths in a state space. Given a state space definition, a transition model and an observation model, an HMM can track the incoming signal of the observed state and provide an expectation for the next observation state. At any time point t, in the received observation sequence, an HMM maintains a probability distribution over the defined state space. The maximal point of the probability distribution represents the most likely state. There can be states with very similar expectation values depending on the characteristics of the received sequence. However the model becomes more effective in tracking the incoming signal as time passes. The sections below provide further information on the basic design questions of HMM components.
States
HMM typically works with a state vector representing all possible states of the system. It is important to design the state vector at the right level of abstraction. A too specific state vector with too many states would be intractable to process. Similarly, a too general state vector might not provide enough detail about the environment. Thus the goal of state definition design is to come up with a concise and efficient state definition.
Transition Model
Once state definition is set, the next step in designing an HMM is to formulate a transition model to provide an idea about the successor state of the system given the current state. According to the Markovian assumption of the HMM, a single state of the system defines the system completely independent of any past states. Thus our prediction about the current state should be sufficient to make predictions about the next possible states.
In order to predict the next state we essentially need a vector of the same size as the state vector representing the next state given the current state. Once we have this definition, we can calculate the next expected states using the following equation:

for any given state x, transition function f(x), and transition probability p(x).
We therefore define a probability distribution for each state, represented by a discretized probability vector. These vectors are used to form a matrix called the transition model matrix.
Observation Model
An observation may not necessarily belong to its corresponding landmark due to the uncertainties associated with the observation generation procedure. For instance, in robotic soccer a goal bar may be falsely perceived as a beacon, or a goal bar may be perceived where nothing should be observed.
To handle such uncertainties the observation model of an HMM defines another set of vectors, specifying a probability distribution over all possible states for each observation. Similar to the transition matrix, an observation model matrix can be generated using the observation probability vectors for each state.
Visual Perception Filtering using an HMM
The filtering algorithm is presented in Fig 3. Details of the HMM adaptation used in the proposed method, which provides the expectation vector and the probability distribution mentioned in the algorithm are described below.

Proposed filtering algorithm
State Definition: Meta-Pose
In this study, a hybrid state space definition, called meta-pose, is proposed. In this representation a small set of discrete values are used to represent all of the possible physical conditions in which the corresponding landmark might be observed. This definition removes the higher level module dependencies including localization information since we are no longer interested in the specific position of a robot in the environment. Instead, the module only requires an indication of a possible meta-pose. Thus all that the system requires as input is reduced to the output of the lower level perception modules.
It is possible to define high level maps using the meta-pose as the state definition of the proposed HMM implementation. Commonly such maps are constructed based on specific landmarks that indicate particular positions in a given environment, whereas the use of meta-pose definitions allows us to define more abstract maps. For instance, two goals on the opposite sides of the field can be considered as landmarks in a robotic soccer field. The meta-pose definitions of these landmarks provide us, all the possible physical configurations of a robot in which the corresponding goal might be seen. In this case, the high level map will contain two landmarks, each representing a physical goal. These definitions enable us to apply further reasoning on the received perception information. For example, two landmarks can not simultaneously be observed due to the physical limitations of the environment and the robot's narrow visual field of view. One benefit of meta-pose definitions is that they allow implementation of the previously mentioned high level reasoning using a simple HMM filtering implementation without any need to specify sanity checking rules explicitly.
In the 2008 version of AIBO soccer field in the Standard Platform League (Fig. 1) the landmarks selected for the experiments were the two beacons and the four vertical bars of the goals, making a total of six landmarks. A seventh state was used to represent the meta-pose in which no observations were made. The state vector was initialized with the uniform distribution since no observations were available at the beginning of processing.
Transition Model Definition
Columns of the transition matrix, as shown in Table 2, correspond to the individual states of the proposed HMM implementation. Thus column 1 represents the first state of the HMM and transitions from this meta-pose to all other possible meta-poses. The formulation of the transition matrix is based on a number of assumptions, which are described below.
Expert coded transition matrix parameters

The state transitions are assumed to have a Gaussian probability distribution. Thus, whenever the robot observes a landmark, the next state is assumed to be around the previously observed state with a Gaussian probability distribution peaking at the previously observed state. The only exception to this is the seventh state, which is the next state at all times with a probability of 0.5. This figure is derived empirically after examining a large number of sample log files gathered from soccer games and tests, in which around half of the images contained no perception information.
Gaussian transition probability distribution is a reasonable assumption, derived from the observation of physical constraints of the environment. When a landmark is perceived, observing that particular landmark and the landmarks around it becomes more probable in the next state. This assumption can be used in other domains as well, where the states are expected to be observed in an ordered fashion.
Having no observation in an image indicates the current state to be the seventh state. In such cases it is not easy to make a guess about the next state. Therefore, the seventh column of the transition matrix has uniform distribution. The cells with the value zero are taken to be 0.0001 in the implementation of all matrices so that the probabilities will not converge to zero.
Observation Model Definition
Table 3 shows the observation matrix used in the experiments. The rows indicate observations received in the corresponding states. For example, the second row shows information about the second meta-pose, which corresponds to the right yellow goal bar on the robot soccer field. The value in the second column of the second row of the matrix indicates the probability of being in meta-pose number 2 when a right yellow goal bar is observed. As can be seen in the table, the diagonal values are all the same. The matrix contains all combinations of possible perceptions and possible states.
Expert coded observation matrix parameters

The values were formulated using the empirical observations and prior expertise on the subject. Our goal perception module rarely perceives goal bars on beacons. Thus all such values are given a rather low value of 0.15. Other misperception expectations are also defined similarly.
Just like the transition matrix, the seventh state also requires special treatment. Perceptions may or may not be correct when the system is in the seventh state, since the robot is not in any one of the physical meta-poses that indicate a prior position of the robot. The value at column 7, row 7 is lower than the rest of the diagonal values. The reason for this difference is that the proposed HMM implementation believes that the presence of no observation indicates the seventh meta-pose slower compared to other cases, in order not to waste the precious effects of the received perception information.
The final parameter of our HMM implementation is the unexpected state threshold, which defines how much belief is required for a state to be an expected state. Considering the above parameters the value of 0.1 was found to be appropriate empirically.
The probabilistic solution consists of a single HMM update for each received observation, which requires multiplication of a state vector and two matrices. If the state space is of size N, then the state vector is also of size N and the transition/observation matrices are of size NxN. Since the values of the vectors and matrices are known at compile time, there is much room for optimization. In the most extreme case, all possible values may be calculated before hand to implement a lookup table for the HMM update procedure. Therefore, it is possible to perform an HMM update in our implementation in constant time, which makes the computational complexity of the system O(1).
Experimental setup
Two different set of experiments in our study were conducted with the four legged AIBO robot (http://tinyurl.com/yb5zeej) in a scaled SPL field (version 2008), shown in Figure 4.

Misperception (a) and localization (b) experiment paths. The circles indicate the starting points; the plus signs show the targets.
In the first set of experiments performance of the proposed module was tested according to its effects on the number of misperceptions. Figure 3a shows the path the robot follows on the field during the misperception experiments. The data collected at each one of the five runs were manually analyzed to calculate the false positive and true positive responses of the system.
In the second set of experiments effects of the proposed module on our current localization algorithm (Monte Carlo Based Localization) (Kaplan, K. et al., 2005) were tested 1 . Since in most robotic systems, the localization module is a mission critical module it was considered to be a good modality for our experiments. Figure 3b shows the path the robots follow during the localization performance experiments. This path was particularly selected to be towards the misplaced goal landmark since the effects of the proposed module could only be observed in the presence of misperceptions. In the localization performance experiments, the robot went to its target position from its starting point. The robot was stopped when it reached its target and logs were recorded. This experiment was repeated five times starting from each of the two initial locations.
An overhead camera system was used in these experiments to provide the ground truth location of the robot as supervision input. The output of the localization algorithm was compared with the ground truth value.
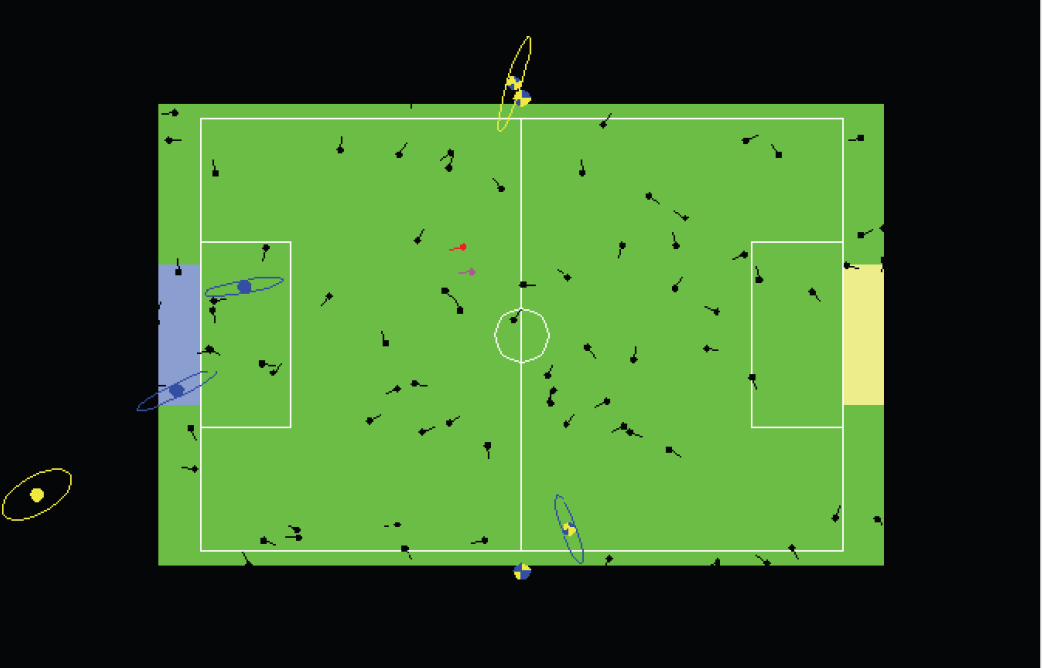
In both experiments, the AIBO robot went to a specific point on the field using its localization module shown in Figure 4. Some additional landmarks were placed around the field at unexpected positions to generate spurious observations. For instance a yellow goal was specifically placed on top of the blue goal and two additional beacons were misplaced on opposite corners of the field, as shown in Figure 5.

Scaled SPL soccer field with added misperception sources
Misperception Elimination Experiment
The results of the misperception elimination experiment are presented in Table 4. About 80 percent of the misperceptions were removed in a total of 4089 frames. Along with these misperceptions, some of the legitimate perception information was also removed as a side effect. These amounted to 22 percent of the otherwise available perception information. When frames with no observation were considered valuable, then the ratio of false positives (legitimate perception information) decreased to 10 percent.
Results of the misperception elimination experiment
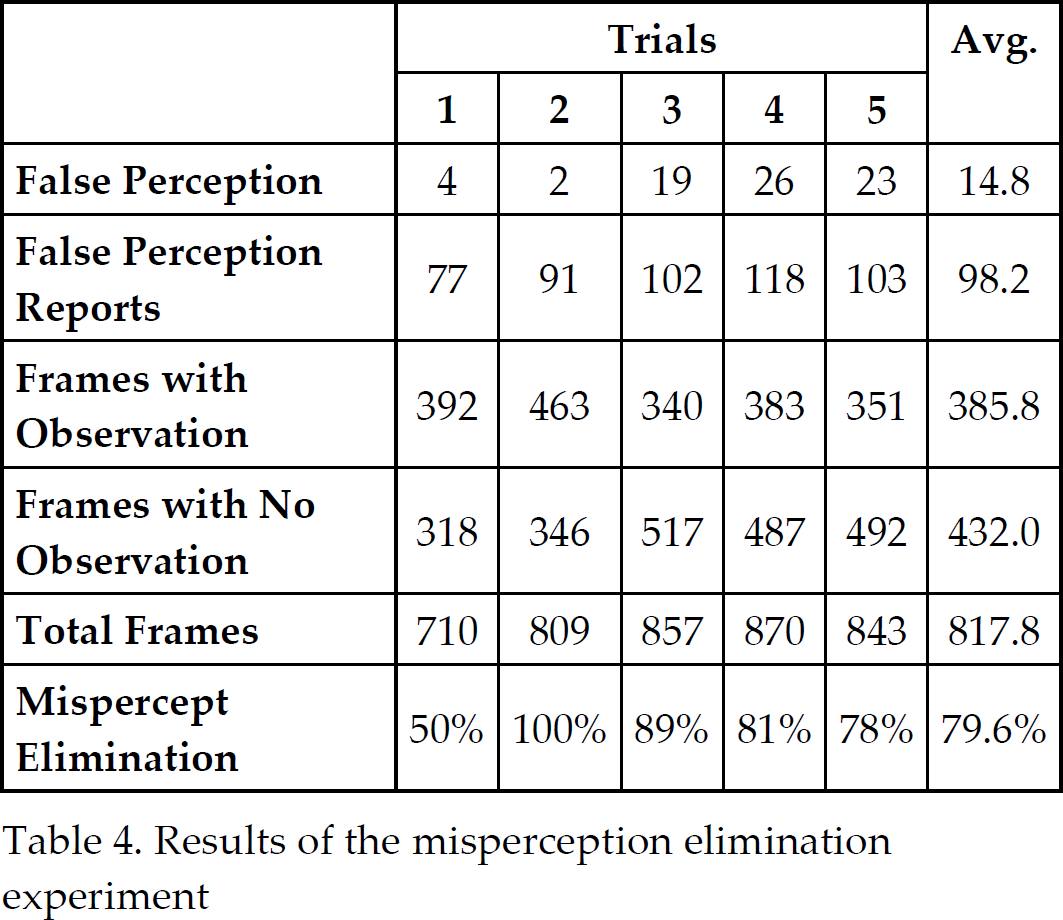
Results of the misperception elimination experiment
The primary effect of our proposed post-perception module was the removal of misperceptions from the localization input. Particles of the Monte Carlo localization algorithm (Kaplan, K. et al., 2005) diverged in cases where misperceptions appeared consistently in the input of localization. In such cases our algorithm only used the odometry information to update the pose estimate, delaying effects of the divergence for a limited period of time.
Figures 6–8 show the progress of particles during a typical experiment. The red dot shows the pose estimate of the robot and the pink dot shows the ground truth provided by the overhead camera system. The robot started from a corner of the field facing the misplaced yellow goal. At the beginning, when the robot was at a distant point on the field, there were no misperceptions observed and the particles converged satisfactorily as seen in Figure 6.

Good convergence

The first misperception frame still has good convergence
Convergence lost after nine frames
Figure 7 shows that one of the bars of the yellow goal was falsely perceived and the particles diverge after nine frames (around 0.27 seconds) as shown in Figure 8.
A numeric representation of the proposed module's effects on the localization algorithm was the particle based error metric, which was calculated as an average of the errors made by each particle compared to the ground truth position:

This metric showed a rapid increase or decrease behavior depending on the received perception information. Since the unexpected perceptions were removed by the proposed module, sudden changes in particle errors were less common in the corresponding graphs. When the proposed module was active, the spurious perception information was not sent to the localization module, avoiding divergence of the particles.
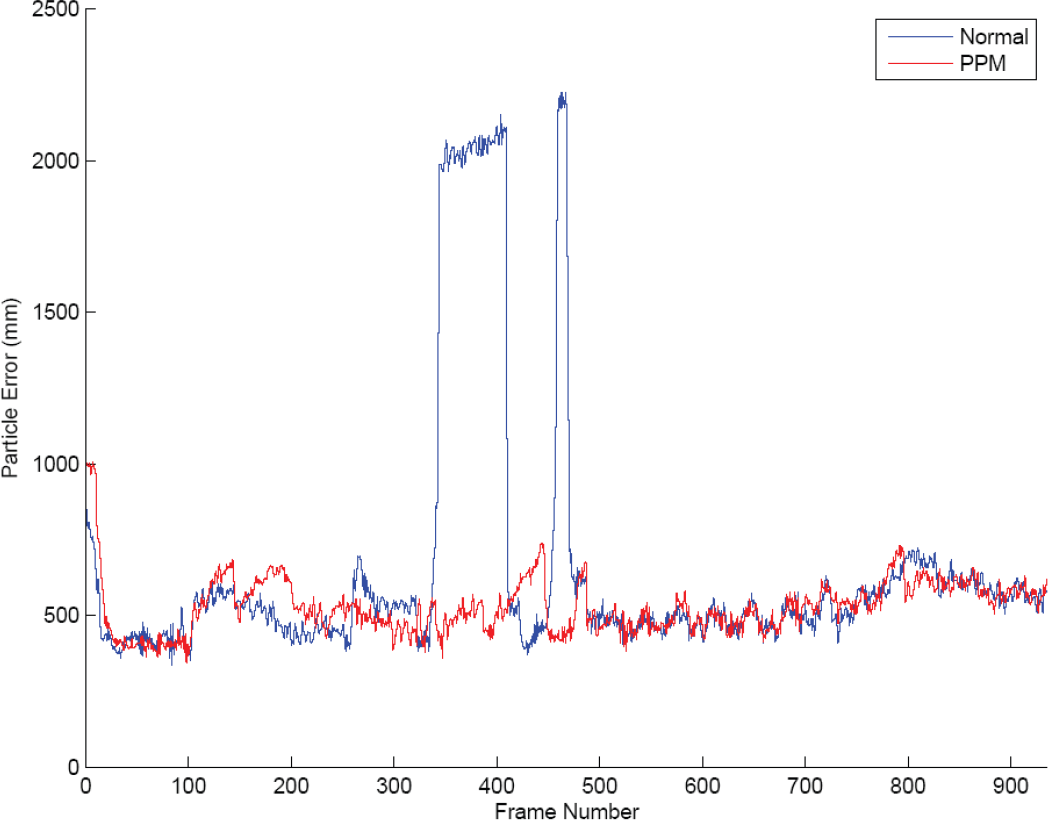
Figures 9–11 shows results of the localization performance experiments, where the error rate is calculated according to the error metric defined above.

Case where four divergences are eliminated.
Case where two divergences are eliminated.

Case where three divergences are eliminated.
Blue curves in these figures represent error rates in the standard run of the localization algorithm. The red curves show the reduced error rate, that we obtained by introducing the proposed post-perception filtering module into the robot control system.
For instance, in Figure 9, the standard run of the present localization module diverged four times; whereas the proposed module handled these divergencies by removing the misperceptions, as shown with the red curve. Figure 10 also shows a similar filtering case, where the proposed module has been able to remove disastrous effects of misperceptions.
Figure 11 represent a typical situation, where the proposed module has been able to filter first three divergencies by removing erroneous perception information. However, if misperceptions are quite persistent and correct perception information is not available anymore, then the post-perception module starts to believe in the spurious perception, after about 400 frames or 12 seconds. On the other hand, this degeneration is necessary to handle kidnapping situations, where the robot is instantly moved to a new location in the environment.
Commonly used perception algorithms on mobile robots have many assumptions and are thus bound to be suboptimal, primarily due to time and/or space complexity problems associated with the size of the input space. Most of the problems encountered in these methods may be traced to inaccurate perception of the landmarks, either by lack of their perception or worse by their misperception. In this study, we proposed a Hidden Markov Model based approach, which creates an expectation of landmarks to be perceived. It has been possible to detect unexpected landmarks using this probabilistic approach.
The experiments we conducted in real world environment, namely on the Standard Platform League setup of the RoboCup, demonstrated benefits of our proposed method implementation clearly. Results of the misperception elimination experiments indicated that 80 percent of the misperceptions were eliminated on the average.
The second set of experiments in our study provided even more conclusive findings. Initially the localization module failed in the presence of spurious landmarks. However the results of our second experiment showed that the localization module worked much more successfully when misperceptions were filtered by the proposed module.
Consequently, our study has demonstrated the critical role of Hidden Markov Model in filtering misperceptions in visual input. Further studies should be performed to extend our proposed module with online learning methods to be used in learning the effects of misperceptions in dynamic environments and with sensor fusion techniques for better use of simpler perception methods.
Footnotes
1
Videos of the localization performance experiments are available from: ![]() and http://tinyurl.com/yh3fmh7
and http://tinyurl.com/yh3fmh7