
Abstract
The use of unmanned aerial vehicles (UAVs) was introduced to monitor a traffic situation and the respective cruise route optimization problem was given. Firstly, a multi-objective optimization model was proposed, which considered two scenarios: the first scenario was that there were enough UAVs to monitor all the targets, while the second scenario was that only some targets could be monitored due to a lack of UAVs. A multi-objective evolutionary algorithm was subsequently proposed to plan the UAV cruise route. Next, a route planning experiment, using the Microdrones md4-1000 UAV, was conducted and a UAV route planning case was studied.
The experiment showed that the UAV actual flight route was almost consistent with the planned route. The case study showed that, compared with the initial optimal solutions, the optimal total UAV cruise distance and the number of UAVs used in scenario 1 decreased by 41.65% and 40.00%, respectively. Meanwhile, the total UAV cruise distance and the number of targets monitored in scenario 2 reduced by 15.75% and increased by 27.27%, respectively. In addition, a comparison study with other algorithms was conducted, while the optimization results were also improved. This demonstrated that the proposed UAV cruise route planning model was effective.
1. Introduction
Multi-source and abundant traffic information is the foundation of traffic management and transportation planning. Due to limited budgets, some urban roads and many rural roads in China are not installed with any fixed traffic detectors. Therefore, it is difficult to take effective measures to monitor traffic situations and detect traffic incidents due to the lack of traffic information. Given their unique advantages of mobility, flexibility and wide view, UAVs have been used widely in the fields of meteorology, environment monitoring and traffic monitoring [1, 2, 3]. Hence, in this paper, a UAV is introduced to collect road traffic information and detect traffic incidents.
After cruise route planning takes place, a UAV flies to the road targets where its camera will take pictures of the road traffic situation. Then, traffic parameters (such as road density, vehicle queuing length and vehicle speed) are extracted from the UAV video by traffic image processing technology. In turn, traffic incident detection and traffic congestion analysis can be conducted based on the extracted traffic parameters. However, maximum flight distance of a UAV is always limited; for example, the maximum flight time for most existing civil UAVs with a battery is no more than 25 minutes. In addition, due to insufficient budgets, the number of UAVs available is always limited; therefore, it is essential to plan the UAV cruise route by minimizing the cruise cost as much as possible.
The UAV cruise route optimization problem had been studied previously. Hutchison formulated the UAV cruise route optimization problem as the travelling salesman problem (TSP), adopting a simulated annealing algorithm to optimize the shortest UAV cruise route [4]. Tian et al. considered the time window of targets and formulated the UAV cruise route planning problem as a single objective problem, then adopted a genetic algorithm to optimize the UAV cruise route [5]. Yan et al. selected road segments as monitored targets, although only one UAV was employed to monitor these targets for traffic information collection; the optimization problem was then formulated using the TSP, with a genetic algorithm employed to optimize the shortest route [6]. In summary, the above-mentioned studies deploy UAVs to monitor all targets with the aim of minimizing the UAV cruise cost, while formulating the UAV cruise route planning problem as a single objective optimization problem, even though none of them considers the influence of multi-objective optimization on UAV cruise route planning.
Meanwhile, Liu et al. proposed a multi-objective UAV cruise route optimization model for traffic surveillance, which considered the impact of time windows and multi-surveillance on route planning, as well as aimed to minimize the total UAV cruise distance and the number of UAVs used [7]. Liu et al. [8] considered the length of road segments and developed a new UAV route planning optimization model for road segment traffic surveillance. In summary, the above studies make an assumption that, with enough UAVs, all targets can be monitored. That said, due to insufficient budgets, the number of UAVs available is always limited, such that not all targets can be monitored by UAVs in this situation. Generally, the scenario in which UAV route planning involves an insufficient number of UAVs is seldom considered. Additionally, UAV flight route accuracy between the planned route and the actual flight route is seldom discussed.
Therefore, this paper first considers the issues relating to a limited number of UAVs, UAV maximum flight distance and multi-objective optimization, as well as proposes a multi-objective optimization model. In turn, an evolutionary algorithm is proposed to plan the UAV cruise route. Next, a UAV flight experiment is conducted to verify UAV fight route accuracy. Finally, a case study is implemented to validate the effectiveness of the proposed method compared with other algorithms.
The remainder of this paper is structured as follows. Section 2 proposes a multi-objective optimization model for UAV cruise route planning. Section 3 proposes an evolutionary algorithm for solving the UAV route planning problem. In section 4, a UAV flight experiment is conducted, while a case study is used to validate the proposed algorithm. Finally, conclusions and discussions are presented.
2. Modelling
As mentioned above, there are two scenarios for planning a UAV cruise route, which are concerned with whether the number of UAVs involved is enough or insufficient. Hence, two UAV cruise route planning scenarios are given as follows:
Scenario 1
There are enough UAVs to monitor all targets, but we need to minimize the UAV cruise cost as much as possible. In this situation, two optimization objectives are considered, i.e., minimize the total UAV cruise distance and minimize the number of UAVs used. After optimization, the minimum number of UAVs monitoring all targets can be determined.
Scenario 2
As the number of available UAVs is limited, only some targets can be monitored by them. In this situation, we need to use the available number of UAVs to monitor targets as much as possible with the minimum cost. Therefore, two optimization objectives are considered, i.e., minimize the total cruise distance and monitor targets as much as possible.
Assuming that the number of targets is Nc and the UAV base is labelled as “0”, the target set with the UAV base is denoted as
2.1. Modelling scenario 1
According to the above description, the mathematical model for scenario 1 is shown as follows:
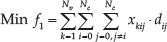
Minimize the total UAV cruise distance:
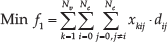
Minimize the number of UAVs used:

The constraints are listed as follows:

Eq. (3) ensures that the UAV takes off from the base.
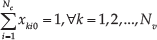
Eq. (4) ensures that the UAV flies back to the base.


Eqs. (5–6) mean that there is only one UAV is able to arrive at any given target, while there is only one UAV that can depart from any given target. Therefore, Eqs. (5–6) ensure that each target is visited by only one UAV.
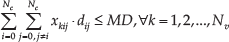
Eq. (7) ensures that the UAV maximum cruise distance is not exceeded.

Eq. (8) ensures the number of available UAVs is not exceeded.
The decision variable is denoted as follow:

where
2.2. Modelling scenario 2
According to the above description, the mathematical model for scenario 2 is shown as follows:
Minimize the total UAV cruise distance:
Minimize the number of unmonitored targets (i.e., maximize the number of monitored targets):

The constraints are listed as follows:

Eq. (12) ensures that each UAV takes off from the base.
Eq. (13) ensures that each UAV flies back to the base.
Eqs. (14–15) mean that there is, at most, one UAV that arrives at any given target, while there is, at most, one UAV that departs from any given target. Therefore, Eqs. (14–15) ensure that one target is visited by, at most, one UAV, i.e., some targets may not be visited by any UAVs.

Eq. (16) ensures that the UAV maximum cruise distance is not exceeded.

Eq. (17) means that the number of UAVs departing from a UAV base is Nv which ensures that all UAVs are used to cruise targets.
The decision variable is denoted as follows:

where
It can be seen that the second optimization objectives of the two scenarios are different. Meanwhile, constraints (5, 6, 8) are also different from constraints (14, 15, 17).
3. Algorithm for UAV Cruise Route Planning
As for multi-objective optimization, different weights are always given to different objective functions, after which the multi-objective problem is converted into a single objective problem, and this traditional optimization method is always used to solve this kind of problem. However, the weights are difficult to determine and the optimization result is always bad. Meanwhile, different objectives will influence each other in a complicated way. Therefore, it is important to find an optimization set for different objective functions. In this context, some elitist multi-objective algorithms have been developed, such as the strength Pareto evolutionary algorithm (SPEA) [9] and the Pareto archived evolutionary strategy (PAES) [10]. As elitist strategy, SPEA uses an external population to store all non-dominated solutions and assigns a fitness to non-dominated solutions in every generation, after which it adopts a deterministic clustering technique to guarantee the algorithm's diversity. PAES compares the offspring with the parent: if the offspring works better than the parent, the offspring is adopted as the next parent; otherwise, the offspring is deleted. Once the parent and the offspring no longer dominate each other, an archive of the best solutions is used to compare the offspring and the parent before one of them is selected. In addition, other multi-objective evolutionary algorithms have been used in solving the multi-objective optimization problem [11, 12, 13], including the non-dominated sorting, crossover, mutation and tournament selection algorithms. Based on the aforementioned, an evolutionary algorithm is proposed to plan UAV cruise routes; its flow chart is shown in Figure 1.

As Figure 1 shows, the proposed algorithm operations include feasible UAV route chromosome generation, non-dominated sorting, tournament selection, crossover and mutation. For this particular optimization problem, feasible UAV route chromosome generation, crossover and mutation are especially proposed in this paper, which are marked in the grey boxes in Figure 1. The methods for generating a feasible UAV route chromosome for scenarios 1 and 2 are given in sections 3.1 and 3.2, respectively; non-dominated sorting is presented in section 3.3; tournament selection is presented in section 3.4; and crossover and mutation are presented in sections 3.5 and 3.6, respectively.
3.1. Feasible chromosome generation in scenario 1
Feasible UAV route chromosome generation should consider two points: (1) UAV route chromosome representation and (2) satisfying UAV route different constraints. A targeted direct arrangement method [14] is adopted to depict the UAV route chromosome because it is easy to represent and code the UAV route chromosome with this approach. Meanwhile, a sub-route division method is proposed to generate a feasible UAV route, which is shown in Figure 2.

Algorithm structure of the sub-route division method
A UAV chromosome of eight targets, 3-5-8-2-1-7-6-4, is used to illustrate the sub-route division method. Firstly, target 3 is selected as the first target for UAV 1 and then the length of sub-route 0-3-0 is calculated if the length does not exceed the UAV maximum cruise distance, then sub-route 0-3-0 is feasible. Next, target 5 is selected as the second target for UAV 1, after which the length of sub-route 0-3-5-0 is calculated; if the sub-route length exceeds the UAV maximum cruise distance, the sub-route is not feasible. Therefore, 0-3-5-0 is the feasible route for UAV 1, which can satisfy the UAV maximum cruise distance constraint.
The remaining chromosome is then 8-2-1-7-6-4, while the sub-route division is repeated until any target is input into a UAV sub-route. Assuming that the route division result is 0-3-5-0, 0-8-2-1-7-6-0 and 0-4-0, this means that three UAVs are needed, i.e., sub-route 0-3-5-0 for UAV 1, sub-route 0-8-2-1-7-6-0 for UAV 2 and sub-route 0-4-0 for UAV 3. It can be seen from the feasible sub-route divisions that a UAV takes off from and flies back to the base, that each target is only monitored by one UAV and that the UAV maximum cruise distance is not exceeded. Based on three UAV sub-routes, the optimization objective values can be calculated.
3.2. Feasible chromosome generation in scenario 2
As the number of UAVs is limited, only some targets can be monitored. The steps for generating feasible chromosomes are listed as follows:
Assume that, in scenario 1, the minimum number of UAVs to monitor all targets is set as m and the number of UAVs available is n, with n being less than m. In this situation, we can select n sub-routes from m sub-routes, i.e., the combination number of generating new feasible UAV sub-routes is
Calculate the two objectives for feasible UAV route chromosomes.
Conduct non-dominated sorting (see section 3.3) for UAV route chromosomes, after which the chromosome with the lowest rank is selected as the feasible one.
For example, a UAV route chromosome 0-7-3-2-4-5-6-1-0 can be divided into three sub-routes, i.e., 0-7-3-0 (sub-route 1), 0-2-4-5-6-0 (sub-route 2) and 0-1-0 (sub-route 3). If the number of available UAVs is two, then the combination number of possible UAV routes is
3.3. Non-dominated sorting
Non-dominated sorting [11] is used to select the superior individuals of the population, whose steps are listed as follows: (1) calculate the two objective values for different superior individuals; (2) determine which individual has a preferable domination; and (3) calculate the crowding distance and Pareto rank for each individual. For minimization problems, the individuals with smaller objective values occupy the lower ranks. If the rank of an individual is the lowest (i.e., the rank value is 1), it is selected first. If the rank values of different individuals are the same, individuals with the greater crowding distance are selected first.
3.4. Tournament selection
The function of tournament selection [11] is to select prior individuals and put them into the parent population, which is helpful to maintain population diversity. The steps in tournament selection are listed as follows: (1) determine the tournament pool size (e.g., 10 UAV routes) and the tournament number in each tournament selection (e.g., two UAV routes); (2) put the two UAV routes with a high priority into the tournament pool; and (3) select other UAV routes with a high priority until the tournament pool is full.
3.5. Order-based crossover
Order-based crossover is adopted in order to reconstruct chromosomes. Assuming that there are two parent UAV routes,
3.6. Multiple-exchange mutation
The function of multiple-exchange mutation is to guarantee the population diversity and improve the local space search ability. The steps of multiple-exchange mutation are listed as follows: (1) randomly determine two exchange positions of a chromosome; (2) determine the number of multiple-exchanges and conduct a multiple-exchange mutation operation. For example, multiple-exchange mutation should be conducted twice in respect of the UAV route
4. UAV Flight Experiment and Case Study
4.1. UAV flight experiment
Besides UAV flight planning, we are also concerned about whether the UAV flight route accuracy is good enough because a UAV flight may be affected by its commensurate technological performance and environment. To this end, a md4-1000 UAV cruise route planning experiment was conducted on the Tongji University campus, China, in 2012, in order to analyse the difference between a planned UAV route and an actual fight route. The maximum flight distance for the md4-1000 UAV is 40km with full battery capacity, using either remote control or Waypoint automatic flight modes. Some UAV cruise route planning pictures are shown in Figure 3.

UAV cruise route planning experiment
Figure 3(a) shows the md4-1000 UAV, while Figure 3(b) shows the planned and actual UAV flight routes in Google Earth. As Figure 3(b) shows, there are two parallel lines on the campus playground: the upper line represents the UAV's actual flight route, while the lower line represents its planned flight route. It can be seen that the UAV's actual flight route was almost consistent with the planned flight route.
4.2. Case study
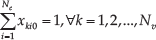
Assuming that there are 20 intersections located in a square area, and the traffic situations of these targets are monitored by UAVs. Twenty intersections, the UAV base and the UAVs’ IDs are shown in Figure 4; the length of the square side is set at 20km. In addition, the number of available UAVs is set as five, while their maximum cruise distance is set at 40km.
Distribution of targets and the UAV base [14]
Scenario 1: all targets were monitored by UAVs
The proposed approach was implemented on the MATLAB platform, with the multi-objective algorithm parameters set as follows: the chromosome population size was set at 100, the tournament pool size was set at 50, the individual tournament number in each selection was set at 2, the maximum iteration was set at 300, the crossover and mutation rates were respectively set at 0.8 and 0.1, and the multiple-exchange time of the mutation operation was set at 5.
The case simulation was implemented 20 times, while the Pareto optimized solutions are shown in Figure 5(a). Also in Figure 5(a), 100 squares represent 100 initial solutions, while 20 crosses represent 20 optimized solutions. The optimal UAV planned cruise route is shown in Figure 5(b), which shows that the minimum number of UAVs to monitor all targets was three.
Optimization result of UAV cruise route planning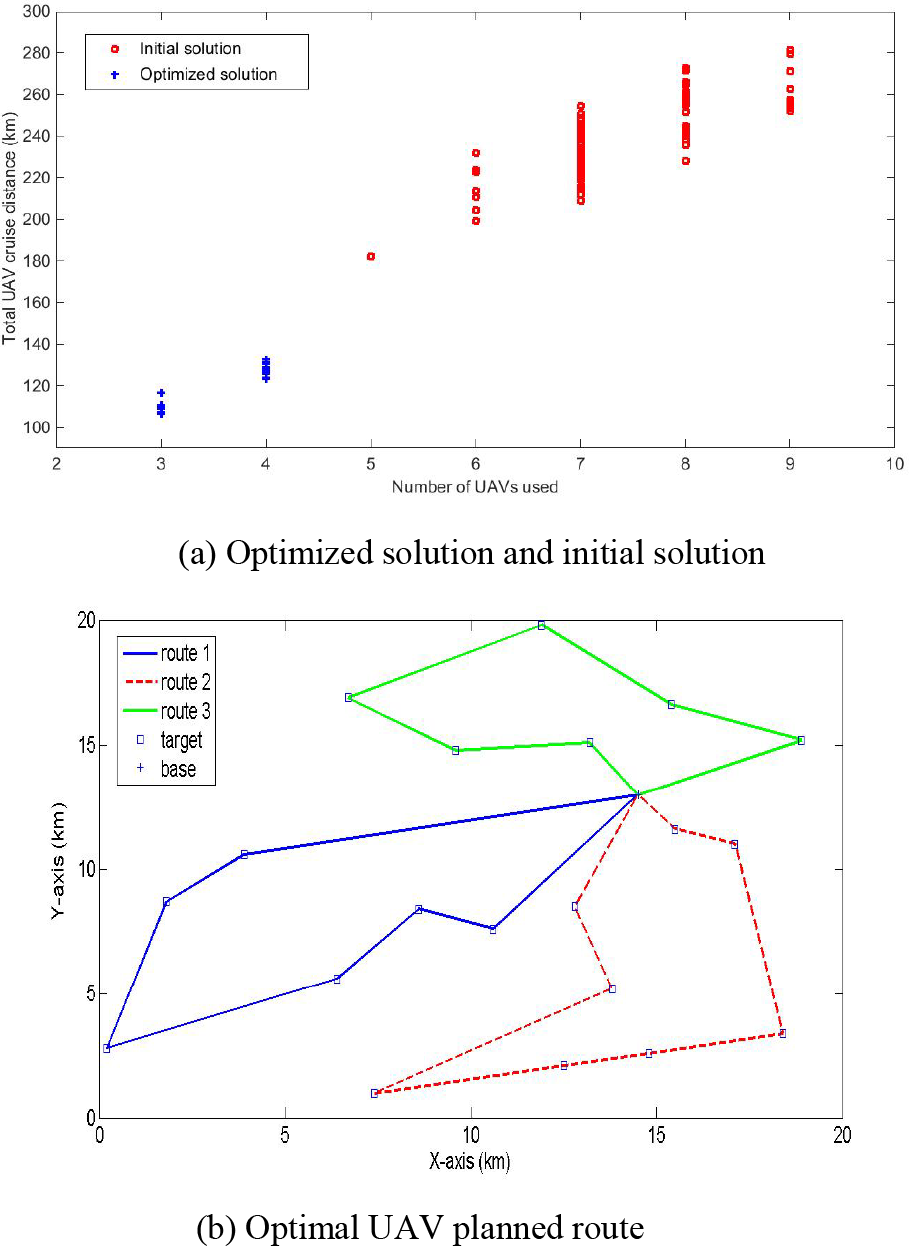
With reference to Figure 5, the resulting comparison of the initial and optimized optimal solutions is listed in Table 1.
Resulting comparison of initial and optimized optimal solutions

As Table 1 shows, compared with the initial solutions, the average cruise distance and the average number of UAVs used decreased by 49.86% and 51.53%, respectively, while the optimal cruise distance and the number of UAVs used decreased by 41.65% and 40.00%, respectively. This demonstrated that the two objective values had been improved significantly. In addition, a comparison study of SPEA and PAES algorithms was conducted. The optimization was also implemented 20 times, such that 20 optimized solutions were obtained for both SPEA and PAES algorithms. The resulting comparison of different algorithms is listed in Table 2.
Optimized solution comparison of different algorithms

As Table 2 shown, with the exception of objective 2 (i.e., the number of UAVs used) in optimal optimized solutions, other solutions of the proposed algorithm decreased to some extent compared with SPEA and PAES, this demonstrated that the proposed algorithm was effective.
Scenario 2: only some targets were monitored by UAVs
In scenario 1, at least three UAVs were needed to monitor all targets, if the number of available UAVs was only two, such that only some targets could be monitored. The proposed approach was also implemented on the MATLAB platform, while the algorithm parameters were the same as scenario 1. Case simulation was also implemented 20 times, while the Pareto optimized solutions are shown in Figure 6. Also in Figure 6, 100 squares represent 100 initial solutions, while 20 crosses represent 20 optimized solutions. In addition, there are five individuals in the first Pareto front, which are labelled as “1”, “2”, “3”, “4” and “5”. Meanwhile, UAV routes for these five Pareto front individuals are shown in Figure 7.

Pareto optimal solution
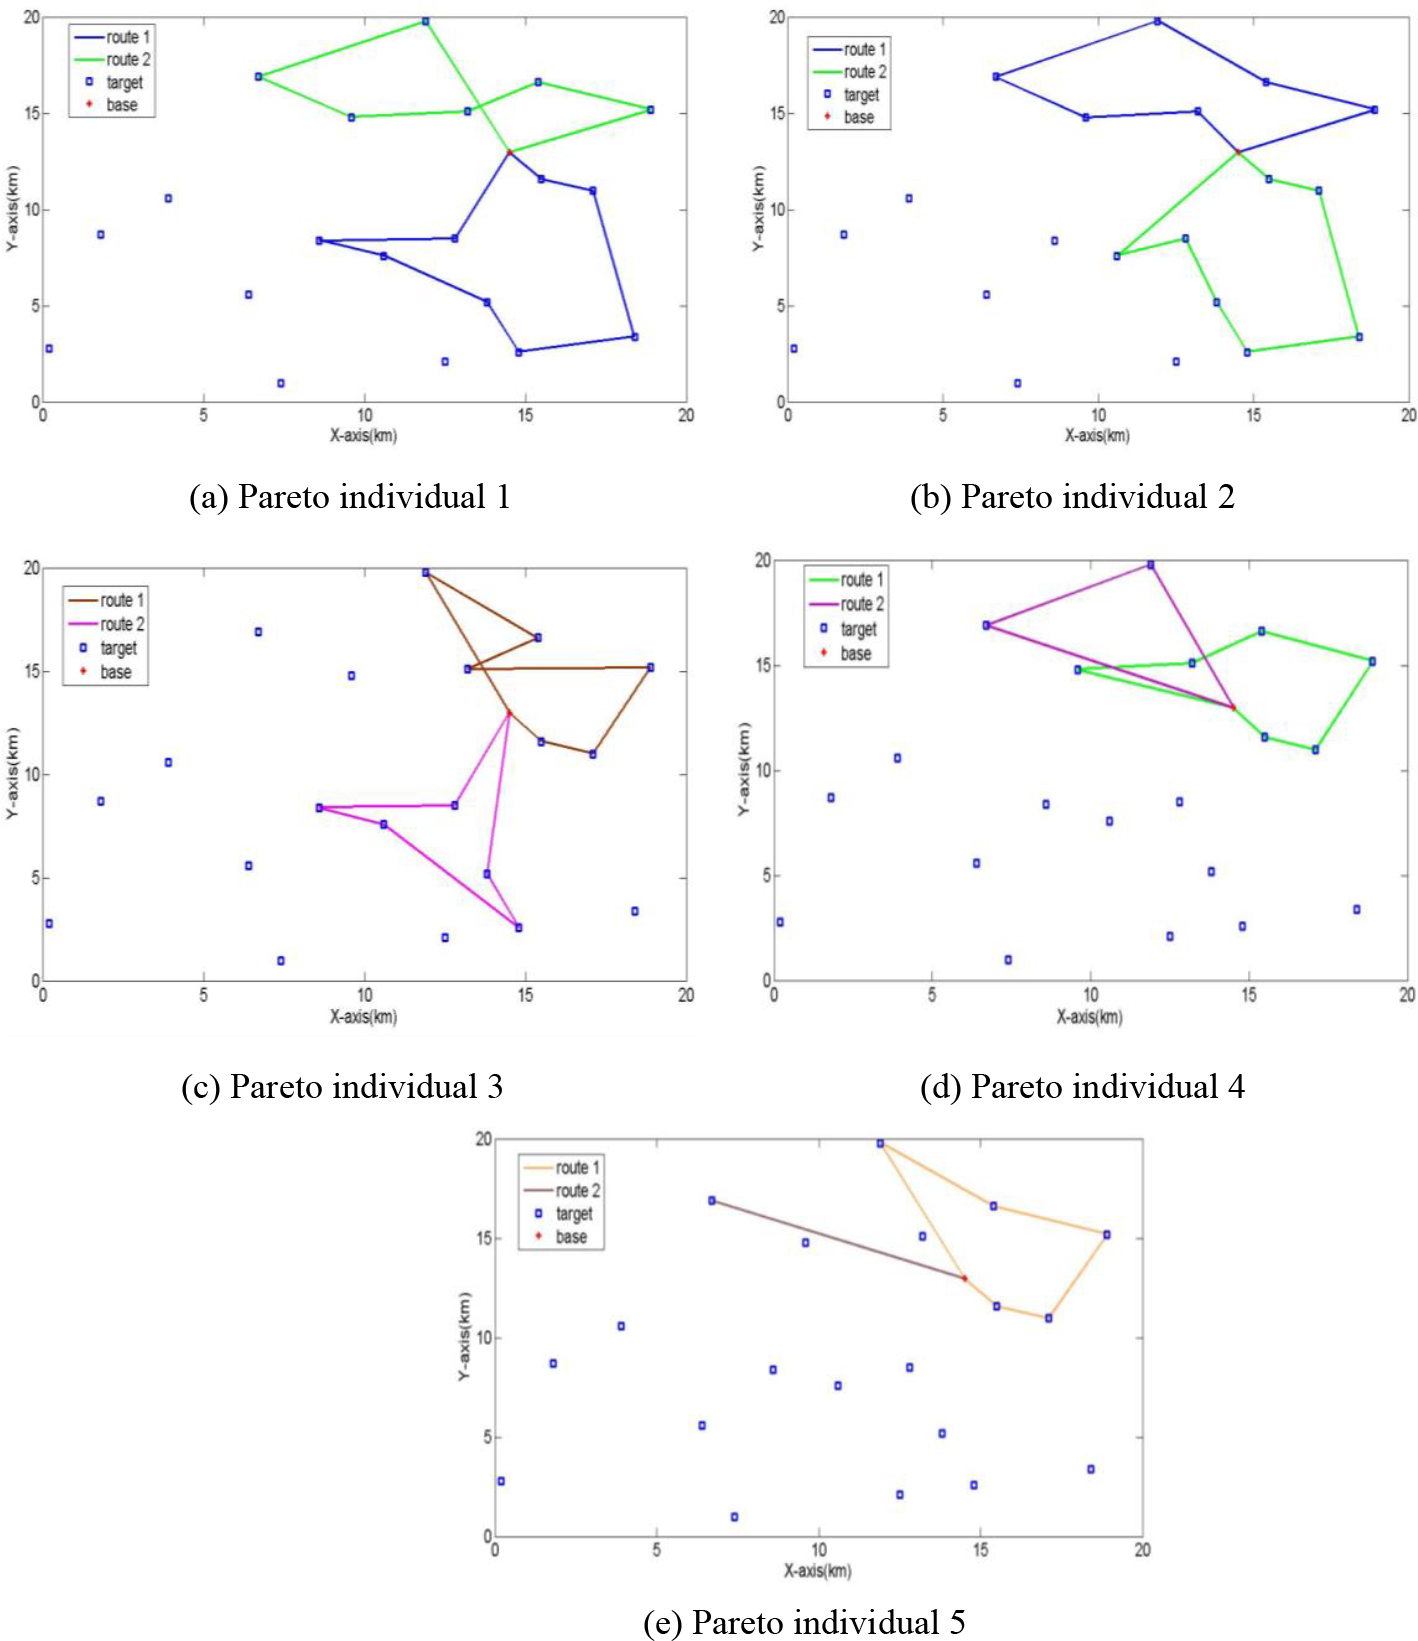
UAV routes for five Pareto front individuals
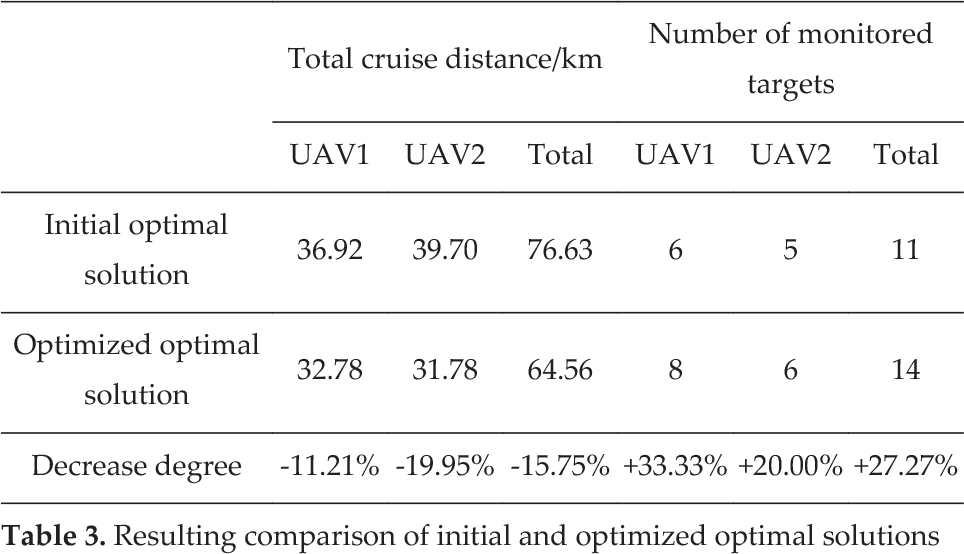
If we need to monitor as many targets as possible, the individual “1” of the Pareto front is preferred; its UAV routes are 0-1-8-7-10-12-2-14-5-0 for UAV 1 and 0-17-11-20-18-3-4-0 for UAV 2. Compared with the initial optimal solutions, the optimized optimal total cruise distance falls by 15.75%, whereas the optimized optimal number of monitored targets increases by 27.27%, which is shown in Table 3.
Resulting comparison of initial and optimized optimal solutions
In addition, a comparison study of SPEA and PAES algorithms was conducted with regard to the condition in which as many targets as possible were monitored. The optimization was also implemented 20 times, while 20 optimized solutions were obtained for both SPEA and PAES algorithms. The optimal resulting comparison of different algorithms is listed in Table 4.
Optimal solution comparison of different algorithms

As Table 4 shows, in the scenario in which as many targets as possible were monitored, the maximum number of monitored targets for the each of the three algorithms was the same, i.e., 14 targets. As for the total cruise distance, the proposed algorithm performed better than the SPEA and PAES algorithms, while the decrease degree was 3.30% and 4.06%, respectively.
5. Conclusions
This paper proposed a multi-objective optimization method to plan UAV cruise routes; a UAV flight experiment was also conducted. The experiment showed that the UAV actual flight route was highly consistent with the planned route; the case study showed that the two objective values for two scenarios were improved significantly. In addition, a comparison study with other algorithms was conducted and the optimization results were also improved to some extent, which demonstrates that the proposed method for planning UAV cruise routes is effective.
Besides traffic monitoring, UAVs can also be used for monitoring oil spills at sea and atmospheric pollution. As for oil spills at sea, UAVs can carry high-resolution cameras and take aerial surveillance in the affected area continuously. The affected area can then be filtered out efficiently, while the drifting and diffusion processes of the oil spill can be presented, which will be helpful when making proper decisions to reduce accidental loss. As for atmospheric pollution, an atmospheric detector can be attached to a UAV (especially an electricity-powered UAV), after which the UAV can fly at a certain altitude to collect air pollution data. If the UAV-based monitoring lasts for several months, different kinds of air pollution data can be obtained. By combining the aerial pollution data with the surface data, more detailed and sophisticated models can be established to describe the generation and diffusion of air pollution.
Footnotes
6. Acknowledgements
This research was supported by the National Natural Science Foundation of China (51408417, 61070112, 61503284), the University Science and Technology Development Fund of Tianjin City, China (20140917). It was also supported as a project of the China Scholarship Council ([2015]3069) and a key project of the Natural Science Foundation of Tianjin City, China (12JCZDJC34500).