
Abstract
The current escalation in user demand for web contents, particularly Video on Demand (VoD), is causing a continuing increase in both the types of web traffic and the volumes of data transmitted. The greater demand arises from the new means of communication employed by individuals and companies, as well as the development of readily usable applications distributed by ‘app stores’. In this paper, we suggest that the stakeholders of a VoD framework, the Content Providers (CPs) and the Internet Service Providers (telcos/ISPs), should guarantee a solid Quality of Experience (QoE) to the end user through two potential investments: either in ultra-broadband (UBB) or in the technologies for the acceleration of web content, known as the Content Delivery Network (CDN) and Transparent Internet Caching (TIC). The aim of the paper is to analyse these investments in terms of providers' profits. The base hypothesis is that the investments are subsidized by the CPs, which, in recent years, have indeed been directing a large part of their revenues towards investments in network infrastructure.
Keywords
1. Introduction
The current development of new means and patterns of communication is causing an ever greater demand for online content. Certain estimates indicate that, by 2018, digital TV and online video will be the two services with maximum growth rates [1]. In 2012, there were 43 million worldwide subscribers to online video providers. Devices that deliver TV and film content on demand can already be found in 6% of the world's households. As this percentage climbs to 10% by the end of the decade, the number of people subscribing to at least one streaming VoD service will pass 180 million. Indeed, the rapid expansion of digital home entertainment, especially the VoD segment, was driven by the possibility of using it on any device – PC, tablet, smart TV or smartphones – with an offer enriched by the proposals of many mobile network operators and mobile virtual network operators [2].
The growth of VoD is having a disruptive effect not only on the online entertainment market, but also on the entire Internet. It is, nevertheless, necessary to consider that the diffusion in Europe of VoD offerings depends on broadband development and digital growth. For this purpose, the European Commission, in the Digital Agenda (the first of the seven flagship initiatives of the Europe 2020 strategy) [3], has stressed the importance of increasing wideband services and set multiple objectives in this area in order to promote social inclusion and competitiveness in the EU. The principle objectives of the Digital Agenda include the following: basic broadband coverage for 100% of all EU citizens; high speed broadband (speeds greater than 30 Mbps) by 2020 for 100% of all EU citizens; and ultra-fast broadband (speeds greater than 100 Mbps) by 2020 for 50% of all European users. The Internet, therefore, has become an ever more evolved and indispensable instrument for global communication. As such, in order to develop their businesses, the CPs must ensure that their offer of web content also includes a solid QoE to end users. The QoE can be expressed in terms of numerous parameters, such as the time taken to download and visualize video, the sequentiality of download, and the time taken to construct the visualization by the terminals. Essentially, to improve QoE, the provider must guarantee the Throughput and Download Time. At the applied level, Throughput consists of the effective speed of transfer of the VoD as requested by the final user. This is conditioned by the latency of the packets in arriving in the end users' Internet servers, as well as the loss of the packets themselves in the IP network. The Download Time, or effective time for downloading the VoD, depends essentially on the efficiency of the protocol for exchanging content between a website and an end user. These parameters can be improved by investment in UBB and/or acceleration technologies, such as the CDN and TIC. In particular, through CDN technology, the web content copies are stored in the appropriate caches and distributed in the network through the Points of Presence (PoPs). Thus, instead of accessing directly from the source, the end users can download web content stored in the cache server, which replicates the exact content of the source server, allowing users to download files from the nearest mirror. The benefits of CDN technology can be summarized as follows: higher speed when downloading files; increased availability of content (independent from network congestion and data centre overload); reduction in the file opening time; less delay and less packet loss. In addition, the TIC technology relies on transparent caching systems, which locally store the most frequently requested web content in order to deliver them directly to end users. The benefits of TIC technology are an improvement in the cache's efficiency regarding video traffic (with values ranging between 60% and 80%), reduced latency, improved QoE and a reduction in traffic on the backbone of telcos.
Thus, the CPs ask the Internet operators, through specific agreements, to increase the connection capacity (UBB) and insert their own platforms for QoE (cache, CDN/TIC) within the PoPs in order to make the web content more accessible to the end user, in terms of means of access and performance. In particular, this issue is of topical importance, considering the recent growth in agreements between the telcos and the CPs, at both the European and global levels. For example, the main American CP of VoD, Netflix, has signed numerous agreements with telcos, which have permitted rapid global growth, making Netflix one of the main online television networks in the world, with a vast selection of films and TV series in high definition (HD) or 4k ultra-HD, without any advertising interruptions. Netflix has also succeeded in this rapid global expansion because it offers a geolocalized service capable of providing programmes that are both subtitled and dubbed. Thanks to agreements with national telcos, Netflix has also penetrated the European market, in particular the United Kingdom, Denmark, Finland, Norway, Sweden, Germany, Ireland, Spain, Austria, Belgium, France and Switzerland. Netflix recently signed an accord with the Italian telcos, VoDafone and Telecom Italia, to launch a service in Italy by October 2015. In this case, the telcos will issue promotional offers, which include Netflix with the purchase of 4G and fibre-optic services.
From the point of view of investments in Internet infrastructure, there has been a shift in recent years in these costs from the telcos/ISPs to the CPs. In fact, the telcos are reducing this type of investment, in order to control their annual balances against a backdrop of a notable reduction in revenues. Conversely, the CPs are registering very high rates of increase in billings, while, at a global level, they are directing a large part of their revenues towards capital expenditures. According to a recent study [4], the investments by CPs have averaged USD 33 billion per year in the period 2011–2013. This information was elaborated by analysing the capital expenses of the most important CPs: Google, Facebook, Yahoo!, Microsoft, Tencent, Alibaba, Baidu, Amazon, eBay, Netflix and Apple. In the light of this new trend, the initial hypothesis of this article is that the investments, in both UBB and CDN/TIC acceleration technologies, are subsidized by the CPs by means of a percentage share of the fees paid by the end user for the VoD.
The aim of the paper, then, is to describe traffic management of VoD in a two-sided market context, in which two sets of agents interact through an intermediary or platform [5], as well as evaluate the investments directed at improving QoE, in terms of the profit for the stakeholders involved.
In the next section, the paper continues with a description of the VoD model in a two-sided market optic. Section 3 then analyses investment in UBB and CDN/TIC. Section 4 describes the results obtained, while Section 5 presents the conclusions.
2. The VoD Model
The modelling of traffic management in the VoD context derives from the two-sided market scenario, which has undergone extensive studies within various fields. For instance, with regard the two-sided market, Rochet and Tirole focus on competing credit card markets [6], Choi analyses the effects of multihoming in digital media systems [7] and Jullien describes the intermediation activity when trading partners are involved into a commercial relationship [8]. Lu et al. integrate the two-sided market concept into the larger e-business framework formed by social media and social networks [9]. Meanwhile, Roson summarizes and critically assesses the available literature concerning two-sided markets [10], whereas while Rochet and Tirole provide a roadmap to the burgeoning literature on two-sided markets [11].
Two-sided markets feature the presence of a central platform, represented and managed by an operator who serves as interface for the two user groups, which are independent of each other. The operator serves as the ‘mediator’ between the two sides of the market, permitting them to carry out transactions and interactions. In the VoD scenario, it is the ISP network operator who serves as mediator between the CP and the end user. Two-sided markets are usually investigated using Hotelling's localization model of [12], which has been widely applied in the literature and contextualized in the digital market. For example, Foros and Hansen analyse the competition between two ISPs operating in the same geographical area in order to determine the quality of interconnection [13]. A large strand of literature refers the two-sided market framework and the Hotelling model in order to compare ISPs and CPs, under the net neutrality debate, which is a policy issue that has the potential to modify the dynamics of accessing online content [14]. The focal point of the debate lies in whether broadband service providers should be allowed to charge content providers for the preferential delivery of their digital content [15]. The debate affects the interaction between the players involved in the provision of online content [16].
In particular, Choi and Kim analyse the effects of net neutrality regulation on investment incentives for ISPs and CPs, as well as their implications for social welfare [17].
Economides and Tåg modelize a scenario in which the end user is expected to choose between two content providers and two ISP operators, of which one is an incumbent, while the other is a new competitor on the market [18]. Following this model, we consider that the incumbent ISP sells the new competitor – defined as an Other Licensed Operator (OLO) – the access to the last mile Local-Loop Unbundling (LLU), at price pa, as the location licence for the use of the cables that permit Internet access. Regardless of whether the specific model is neutral or discriminatory, in terms of the principle of net neutrality, this competitive environment can be summarized as follows:
Two ISPs, of which an incumbent ISP1 and an OLO ISP2, compete for the greatest number of subscribers to whom they sell access to the Internet at price ai (with i = 1, 2). The sale is, typically, by monthly subscription, permitting the subscriber to access the content offered by the CPs.
Two CPs, respectively CP1 and CP2, in turn compete to transmit their content to the users, via operators ISP1 and ISP2. Advertisers are CPs' main source of revenue, paying for advertising space that is necessarily visible to the end user within the web content.
In this paper, the stakeholders are the two CPs and the two ISPs, in which ISP1 is the incumbent and ISP2 is the follower [19]. ISP1 retains ownership of the network for connection and ISP2 pays ISP1 the tariff pa, which represents a percentage share of the ISP2 profit that is ceded to ISP1. To connect to the Internet, the end user must pay a1 when subscribing to ISP1 and a2 when subscribing to ISP2.
The ISPs guarantee best effort access to the CPs, in keeping with the principle of net neutrality.
In the proposed modelizing, it is the CPs that sustain the investments of the ISPs by means of the tariff on VoD, which the consumer pays in order to use it. Thus, the CP supports the investments by the ISP, in turn ceding a share of its own profit. The investments examined here are of two types: the first consists of widening the band, achieving the so-called UBB; the second is directed at reducing the user's waiting times. Indeed, to improve content delivery, it is necessary to develop both the connection capacity, meaning UBB, and the cache technologies for acceleration of the requested video, which will be situated as close as possible to the user.
The focus of this study is the analysis of the investments on the part of the network operators, subsidized by the CPs, in the context of the VoD model, as represented in Figure 1.

The VOD model
In the VoD model, the end user chooses both the ISP and the CP. The choice of network operator permits the user to connect to the Internet, while the choice of CP permits the user to ask for specific video content on demand.
The end user's choices are, therefore, as following:
Internet connection: The end user can choose ISP1 or the alternative ISP2, paying tariff a1 for l' ISP1, which holds the last mile for web connection, or tariff a2 for the OLO ISP2, which in turn must pay tariff pa to access the LLU infrastructure of ISP1.
VoD: The end user can choose between CP1 or CP2, respectively paying the VoD flat fee f1 or f2. In this regard, the CPs will pay the percentage share q1 to ISP1 and q2 to ISP2. The purpose of these percentage shares is to support the investments that the ISPs will make in UBB or CDN/TIC technologies.
In order to understand the analytical relations between ISPs and CPs within the VoD model, we describe the main functions of operators involved in this framework in the following section.
2.1 ISPs
We assume that the ISPs offer to all customers a flat rate (a1 or a2 for access to the Internet at all hours and days of the year at a fixed – usually monthly – tariff). Indeed, an ISP's profit is given by multiplying i flat tariff by the number of ISP users, plus (for ISP1) or less (for ISP2) the price of LLU (p|a), which is a positive constant and fixed by the incumbent. Furthermore, in considering ISPs' costs, we assume that marginal costs are taken to be zero, while fixed costs are denoted FCISP1 and FCISP2, respectively, for ISP1 and ISP2. Moreover, we assume that the percentage share of a CP's revenue has a neutral effect on an ISP's profit because it is forwarded on the investments in UBB or CDN/TIC technologies. Therefore, an ISP's profits are given as:
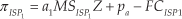

where MSISP1 and MSISP2 are, respectively, the market shares of ISP1 and ISP2, while Z is the total number of potential Internet users in a certain country.
In order to assess the market shares, we assume that users, whose mass is normalized to one, are heterogeneous with respect to their preferences toward two ISPs in the Hotelling manner. The end user's gross utility from Internet access depends on an ISP's bandwidth capacity (μ), wait time (τ) and access tariff (a1 or a2). Therefore, ISPs have market shares that, according to the Hotelling framework, are given as:


2.2 CPs
We assume that each content provider makes an agreement with a single ISP in order to boost investment in UBB or CDN/ICT. This means that, for instance, CP1 agrees with ISP1, while CP2 agrees with ISP2. Furthermore, we suppose that marginal costs are taken to be zero [18].
The CPs' profit functions are given by:


where N is the number of potential VoD users in a certain country, FCCP1 and FCCP2 are the fixed costs of CP1 and CP2, respectively, and q1 and q2 are the percentage shares according to which CPs revenues are forwarded, in order to subsidize the ISPs' investments in UBB or CDN/ICT technologies.
The market shares of CP1 and CP2 (MSCP1 and MSCP2), under the net neutrality regime, depend on demand intensity (Λ), wait time (τ) and bandwidth capacity (μ) are given by [17]:


3. Analysis of Investments
We can utilize the VoD model to evaluate the investments in UBB or CDN/TIC technologies in terms of profit for the ISPs and the CPs.
In the VoD model, the end user pays the fee f1,2 to the CP, which forwards the percentage share q1,2 to the ISP. The ISP uses the tariff to make the investments intended to improve the QoE of the end user in the use of VoD, without latencies or losses in content.
The VoD model considers the following variables, which are relative to the two types of potential investment:
τ: wait time (expressed in seconds)
μ: bandwidth capacity (expressed in Mbit/s)
Λ: demand intensity (expressed in Mbit/s)
The following hypotheses are also considered [17]:
If μ> 3/2 Λ, the bandwidth capacity μ must be sufficient to satisfy the demand for video contents Λ
If the bandwidth capacity μ increases, then the wait time τ decreases to the same extent.
The tariffs a1 and a2, which are paid to the end user for access to the network, are considered constant.
3.1 Investment in UBB
In this section, we see how the CPs might subsidize investments in UBB by ceding a percentage share of the VoD tariff to the ISPs, thereby permitting them to increase bandwidth μ. The increase in bandwidth μ permits the simultaneous reduction in wait time τ for highly sensitive content, which in turn increases the QoE for the final user.
It is, therefore, interesting to analyse the relationship between the profit trend and the increase in bandwidth μ for both the CPs and the ISPs. The application of the VoD model illustrates how the CPs must sustain a reduction in profit due to lost revenue (a percentage reduction in tariff), which is not compensated by an increasing market share in the short-term. Conversely, the ISP does not suffer investment costs, since it is supported by the CP, thereby obtaining an increase in profit due to its growth in market share. Figures 2 and 3 respectively illustrate the profit trend of the CP and the ISP with the increase in bandwidth μ. The simulations were carried out considering various levels of percentage reduction in the VoD tariff. The range considered varies between 1% and 70%, beyond which the value of CP profit becomes negative. Figure 2 demonstrates the relationship between the reduction in profits, as experienced by the CP, and the increase in bandwidth μ. Two different scenarios are considered: a CP with access to a wider bandwidth (μ=7) and a CP with access to a narrower bandwidth (μ=4). We take these values into consideration because, at the EMEA level, the average bandwidth capacity is 5.1 Mbps, such that it is likely that a follower operator has a narrower bandwidth capacity than the average, whereas a leader operator has a higher capacity than the average.
A CP with access to a narrower bandwidth shows a greater reduction in profit alongside the increased width in band. This result is due to the fact that such a CP, in addition to supporting the reduction in revenue due to the lost income from the percentage share of the VoD tariff, also obtains a smaller increase in market share. As a result, the CP experiences a greater loss in profits when there is an equal increase in bandwidth and a percentage share of the VoD tariff is forwarded to the ISP. We observe that, for small increments in bandwidth, the difference is minimal. With greater increase in the bandwidth, the difference becomes greater. For example, with a 40% increase in bandwidth, the CP with μ of 7 shows a profit loss of 44%, while if μ is equal to 4, the CP experiences a profit loss of 65%. These results remain valid, independently of the percentage reduction in the CP's VoD tariff.
For the ISPs, it is again interesting to analyse the relationship between profit and an increase in bandwidth capacity.
Figure 3 presents three scenarios:
1.a – An ISP1 leader with respect to an ISP2 (μ1=7, μ2=6)
2.a – An ISP1 follower with respect to ISP2 (μ1=7, μ2=8)
3.a – An ISP1 peer with respect to ISP2 (μ1=μ2=7)
We assume these values because 7 Mbit/s is the basic offer for ADSL; as such, we consider μ=7 as a benchmark of the different scenarios.
Again, in this case, for small increases in bandwidth, the trend in profit is similar in each of the three cases. With greater increase in bandwidth, there is a difference in the profits of the ISPs. For example, for an increase in bandwidth of 20%, there is a profit increase of 40% when the ISP is in the follower position (case 2.a), a profit increase of 20% when the ISP is in the peer position (case 3.a), and an increase of 15% when the ISP is in the leader position (case 1.a). We can observe, therefore, that, under the hypotheses of this model, the greatest increase in profit is obtained when the ISP is in the follower position, in which case, the ISP follower would then have a greater propensity to invest in UBB.

Relationship between CP profits and increase in bandwidth μ

Relationship between ISP profit and increase in bandwidth μ
3.2 Investment in CDN/TIC technologies
Applying the same hypotheses as for the investments in greater bandwidth, we now examine the investment intended to reduce the wait times for use of VoD. This investment is intended to guarantee a solid end user QoE, which is supported by the CPs. It is implemented by the ISPs through means of accelerators, such as CDN and TIC, which reduce wait times when inserted into the PoPs. In this model, the simulations are conducted on the variable τ in order to study the trend of reduction in wait time, given that CDN/TIC acceleration technologies are intended for exactly this purpose.
Both demand intensity Λ and bandwidth capacity μ are considered constant. The following scenarios are compared:
1.b – An ISP1 leader with respect to ISP2
2.b – An ISP1 follower with respect to ISP2
3.b – An ISP1 peer with respect to ISP2
For this case, it is again interesting to analyse the relationship between profit and reduction in wait time τ. The CPs forward a share of profit to the ISPs in order to invest in CDN/TIC acceleration technologies. As the technologies are intended to reduce τ, they have no influence in increasing bandwidth capacity μ. Once again, the operators' profits have an opposing trend: they decrease for the CPs and increase for the ISPs. The decrease in the CPs' profit is due to the reduction in VoD, which is not compensated by the increase in market share. The ISP, on the contrary, obtains an increase in market share without supporting the cost of investment, which means the effect on profit is positive. Again, in this case, the simulations were carried out in consideration of different levels of percentage reduction in the VoD tariff: between 1% and 70%, beyond which the profit assumes a negative value. Figure 4 compares two CPs with respective bandwidth capacities of μ=7 and μ=4. The CP with the least bandwidth capacity shows a greater reduction in profit with a decrease in wait time τ. We observe that, for the very small reduction in τ, the reduction in profits for the CPs is similar for both bandwidth capacities μ=7 and μ=4. With the increasing percentage reduction in wait time, a significant difference in reduction of profit takes shape. For example, for a reduction in τ of 10%, the CP with μ=7 gives up 12% of its profit, while the CP with μ=4 gives up 34%. Again, in this case, these results remain unchanged despite variation in the percentage reduction of the CP's VoD tariff.

Relationship between CP profit and reduction in wait time τ
Figure 5 shows, from the network operators' point of view, how an ISP1 in the follower position would have a greater propensity to invest in technologies in order reduce waits times. For small reductions in τ, the reduction in the profits of the ISPs is similar. With decreasing τ, notable differences in the ISPs' profits begin to appear. For example, with a 50% reduction of τ, there is an increase in profit for the follower ISP (2b) of 18%, an increase of 8% for the ISP in the peer role (3.b) and an increase of 5% for the leader ISP (1.b).

Relationship between ISP profit and reduction in wait time τ
Similar to investment in UBB, the case for investing in CDN/TIC technologies again presents a situation where the ISP follower demonstrates a greater propensity to investment, incentivized by the greater possible percentage increases in profit.
4. Comparison Between UBB and CDN/TIC Investments
We now compare the two investments under analysis: in UBB and in CDN/TIC technologies in order to accelerate content delivery. Figure 6 illustrates the reduction in profits under the two hypotheses, considering two CPs with access to different bandwidth capacities (μ=7 and μ=4). The first result to note is that the profit reduction experienced by the CP is less in the case where it has access to a greater bandwidth capacity. This result remains valid under both investment hypotheses.
Comparing the two hypotheses, we observe that, up to a certain threshold (30% increment in bandwidth and 40% reduction in wait time), when the CP has access to a greater bandwidth capacity (μ=7), neither of the alternatives is clearly favoured over the other. Beyond these thresholds, we observe that the investment in UBB is preferable to that in CDN/TIC. For example, given a 50% increase in bandwidth, the profit lost with investment in UBB is 44%, while the loss in profit is 50% with investment in CDN/TIC.
When the CP has access to a narrower initial bandwidth capacity (μ=4), the profit given up is greater than the case where there is a higher initial bandwidth capacity. Comparing the two investments, it is more advantageous for the CP to invest in UBB, since this choice yields a smaller reduction in profit. For example, with either a 30% increase in band or a 40% reduction in wait time, the CP's investment in UBB brings about a profit loss of 60%, while the choice of investment in CDN/TIC causes a loss of 70%.
More generally, regardless of the initial bandwidth capacity, and beyond a certain threshold (in the case of μ=7), the investment in UBB is more advantageous for the CP, since it yields a smaller reduction in profit compared to investment in CDN/TIC.

Relationship between CP profits and both investment choices (τ and μ)
Figure 7 permits comparison of the two investments in relation to the three cases: 1a, 2a, 3a for investment in UBB; and 1b, 2b and 3b for investment in CDN/TIC technologies in order to reduce wait time.

Relationship between ISP profit and two potential investments (τ and μ)
We can then compare the investment alternatives of increasing bandwidth against a reduction in wait times and the resulting increase in profit for ISP1. Under the parity of percentage increase in profit, for example, at 15%, the ISP1 in the follower position can invest in a bandwidth increase of 8% (case 2a) or, alternatively, in a 40% reduction in wait time (case 2b). Independently of the increase in profit, we can observe that case 2a dominates the other scenarios. Scenario 1b offers the worst case, heavily dominated by all the other scenarios. Meanwhile, scenarios 3a and 2b approximately follow the same trend. Finally, scenario 1a dominates cases 1b and 3b, meaning that only case 2b has an effective advantage compared to the investments in UBB. These investments, in fact, permit a greater increase in profit compared to all the other cases of investment in CDN/TIC, except for that of 2b, in which the ISP is a follower. This consideration is still more valid when the same percentage shifts exist: an increase of 10% in the bandwidth capacity permits the operators a greater profit increase compared to when there is less than 10% reduction in wait time. Thus, the investment in broadband results is more profitable for the operators. Given that, technically, the investment in broadband is a preparatory step towards investments in CDN/TIC, it should be afforded priority consideration in the policies of digital development for modern economies in order to sustain economic growth [20–21], productivity improvement [22] and social development in both developed and developing countries [23]. Indeed, broadband development has considerable economic impact at all levels of individuals, firms and communities [24].
Investment in broadband is currently receiving significant emphasis at the European level. Indeed, the European Commission, in its Digital Agenda, is proposing to support the European economy by investing in broadband for the broader aims of stimulating innovation and economic growth [3]. For the purpose of investments in CDN/TIC acceleration, the network has to achieve greater efficiency and flexibility in order to simplify the flow of VoD and permit more rapid functionality in software applications.
5. Conclusions
The evolution of Internet content is tightly linked to the needs of the end user concerning access to content with a high QoE in terms of means of use and performance. The improvement in QoE requires high values of throughput at the applied level, short periods for downloading pages, and integrity and fluidity in video content. The achievement of specific performance levels is essential for optimal utilization of VoD. The need for network operators to provide higher bandwidth and develop ever more efficient transport networks becomes still greater due to the current global expansion of VoD content providers, such as Netflix, which has now penetrated beyond the United States into the markets of Canada, Latin America, New Zealand, Australia, Japan and Europe.
This evolution in content delivery makes clear the need for increased investment, which is intended to guarantee the quality of the end user's experience. In this regard, there has been a shift in the cost of investment from traditional telcos to CPs in recent years. In fact, at a global level, the capital expenditure of CPs has gone from around USD 23 billion in 2008 to USD 46 billion in 2013, with predictions of going well beyond USD 100 billion US by 2019 [4]. Given this trend, the hypothesis at the base of the current work is that the costs of investments aimed at improving QoE should be supported by the CPs. The potential investments in improved content delivery are of two types: those intended to broaden the bandwidth (to UBB) and those concerned with using CDN/TIC technologies to reduce transmission times for VoD content. Using CDN technologies, the video content is memorized in designated caches and distributed in the network through the access PoPs. Meanwhile, TIC exploits a local memory in which all the video content is maintained and then used on demand.
In this paper, we study the two principal areas of investment (bandwidth and acceleration technologies), using a model of VoD traffic management based on a two-sided market, where the groups on the two sides are the end users and the CPs, which interact through the intermediary ISP. We hypothesize that investments made by the network operators are supported by the CPS through a percentage share of the VoD tariff paid by the end user.
The results of the simulations demonstrate that, with increasing bandwidth capacity, the profit of the CPs decreases, particularly for a CP that initially has access to a narrower bandwidth. The reduction in profit is due to the loss in revenue from giving up a percentage share of the VoD tariff paid by the end user. Furthermore, from an operational point of view, the CPs should consider the time restrictions in terms of achieving the investments. In fact, the potential annual increase in bandwidth varies between nations: for example, the increase in Ireland is 63%, 36% in Sweden, 27% in Finland and 17% in Switzerland. At the global level, the average annual increase in bandwidth is 30% [1].
The ISPs obtain an increase in profit with increasing bandwidth μ, since CPs do not support the cost of investment. The increment of profit is greatest for those ISPs in the follower position.
Similar to the investments in UBB, in the case of investments in CDN/TIC, the CPs again experience a reduction in profit, which is greater for those CPs that start with access to a narrower bandwidth. Again, in this case, the profit enjoyed by the ISPs increases with the reduction in wait times, since the costs of the investment are supported by the CPs. The ISP that enjoys the greatest profit increase is once again the follower.
Comparing the investment alternatives from the CPs' point of view, the modelling demonstrates that the strategic choice of broadening the network ought to dominate investment in CDN/TIC, since it permits a smaller reduction in profits. This result is valid for those CPs starting from a position of greater bandwidth capacity, with more than 30% increase in bandwidth or more than 40% decrease in wait time. The choice is still more valid in the case of a CP that starts with access to a narrower bandwidth capacity (μ=4).
From the ISPs' point of view, the modelling again demonstrates the greater advantage of investment in broadband, compared to investment in CDN/TIC technologies. In fact, with the exception of the scenario of investment in CDN/TIC technologies by ISPs in a follower position, the best option in terms of increased profits is to invest in UBB. Such investment, apart from being more advantageous in terms of profits, is also technologically preparatory to investment in CDN/TIC acceleration, which is in turn optimized by the broadened network.
The proposed result of investment in high speed and UBB is actually supported by the European Community, in its Digital Agenda [3], which indicates the broadening of the network as an unavoidable and indispensable priority for the socioeconomic growth of its member states.